Statement on Monetary Policy – August 2018 4. Inflation
Inflation remains low and stable
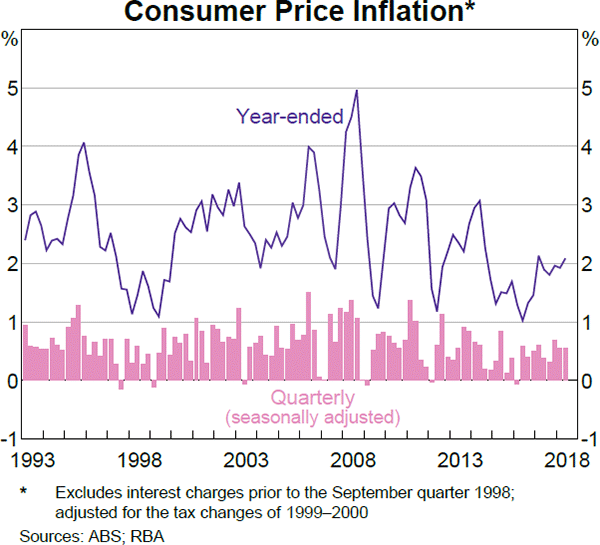
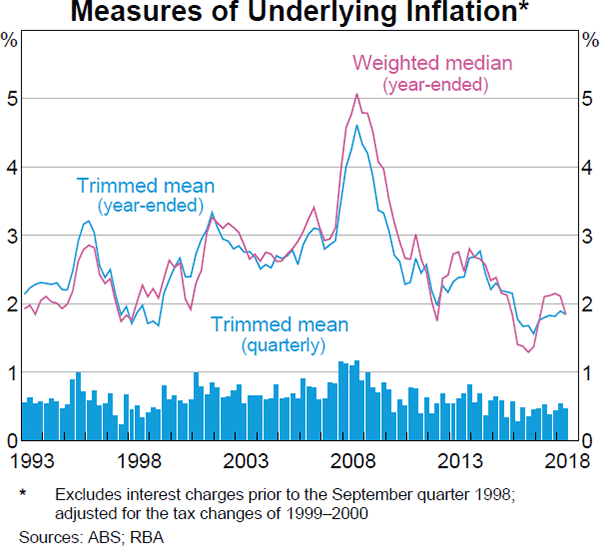
The June quarter inflation outcomes were in line with the forecast in the May Statement on Monetary Policy. Headline inflation was steady at 0.5 per cent (seasonally adjusted) in the quarter, to be 2.1 per cent over the year (Graph 4.1; Table 4.1). Underlying inflation was also steady at ½ per cent in the quarter and close to 2 per cent over the year (Graph 4.2). The recent period of low and stable inflation primarily reflects spare capacity in the economy and the associated low wages growth. Ongoing competition in the retail sector has also continued to put downward pressure on inflation. In contrast, higher electricity and fuel prices and further increases in the tobacco excise have boosted inflation over the past year.
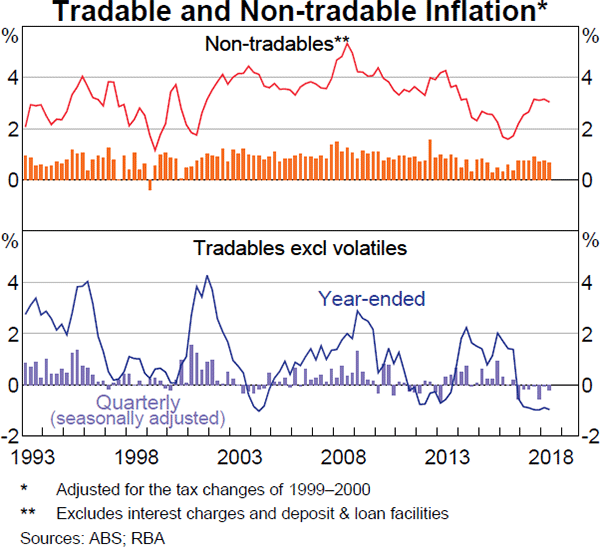
Prices of non-tradable items have risen by around 3 per cent over the year (Graph 4.3). There have been large price increases for tobacco and electricity. However, inflation in the prices of other non-tradable items has been more subdued, reflecting low wages and rent growth and, more recently, a slowing in the growth of administered prices. Prices of tradable items, excluding volatile components, have fallen over the past two years.
| Quarterly(a) | Year-ended(b) | |||
|---|---|---|---|---|
| June quarter 2018 | March quarter 2018 | June quarter 2018 | March quarter 2018 | |
| Consumer Price Index | 0.4 | 0.4 | 2.1 | 1.9 |
| Seasonally adjusted CPI | 0.5 | 0.6 | ||
| – Tradables | 0.4 | 0.2 | 0.3 | −0.5 |
| – Tradables (excl volatile items) | −0.2 | 0.0 | −1.0 | −0.9 |
| – Non-tradables | 0.7 | 0.8 | 3.0 | 3.1 |
| Selected Underlying Measures | ||||
| Trimmed mean | 0.5 | 0.6 | 1.9 | 1.9 |
| Weighted median | 0.5 | 0.5 | 1.9 | 2.1 |
| CPI excl volatile items(c) | 0.4 | 0.5 | 1.8 | 2.0 |
|
(a) Except for the headline CPI, quarterly changes are based on seasonally adjusted data; those not published by the ABS are calculated by the RBA using seasonal factors published by the ABS Sources: ABS; RBA |
||||
Inflation in market services prices remains subdued
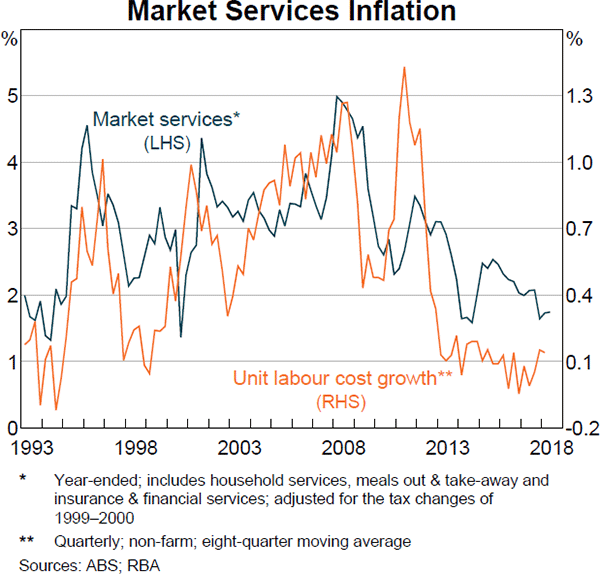
Inflation in the prices of market services, which include such services as hairdressing and meals out, remains low (Graph 4.4). This is mainly because labour cost growth has been subdued; labour costs account for around two-fifths of final prices for these services. However, some specific factors have also lowered market services inflation over the past year or so, including reforms to state-based compulsory third-party insurance schemes, and the NSW Government's Active Kids voucher program. Since 2014, there have been technology-driven declines in the prices of telecommunications equipment and services, which have subtracted 0.1 percentage points on average from year-ended headline inflation.
Administered price inflation has slowed
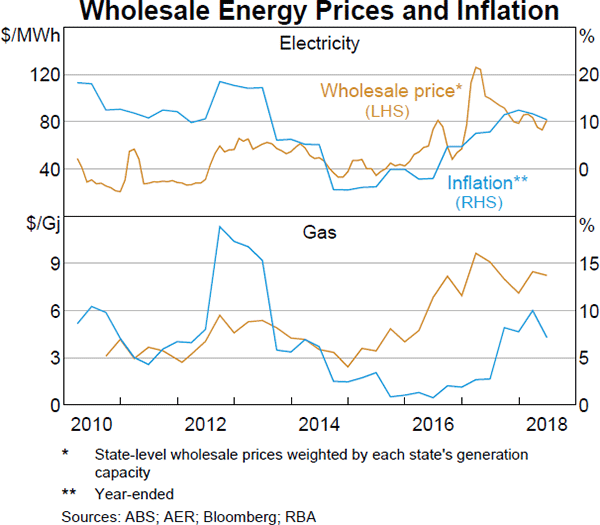
Electricity and gas prices rose sharply over the past year as increases in wholesale prices were passed on to consumer prices (Graph 4.5). However, these prices were relatively little changed in the June quarter; recent declines in wholesale prices and competition for customers have started to put downward pressure on prices. Energy providers in some states have announced reductions to prices that will take effect in the September quarter.
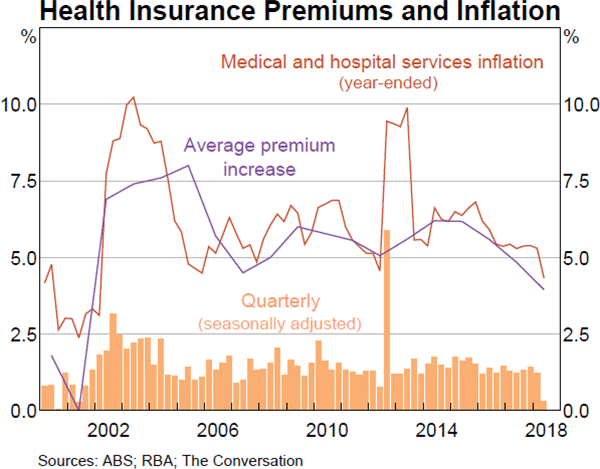
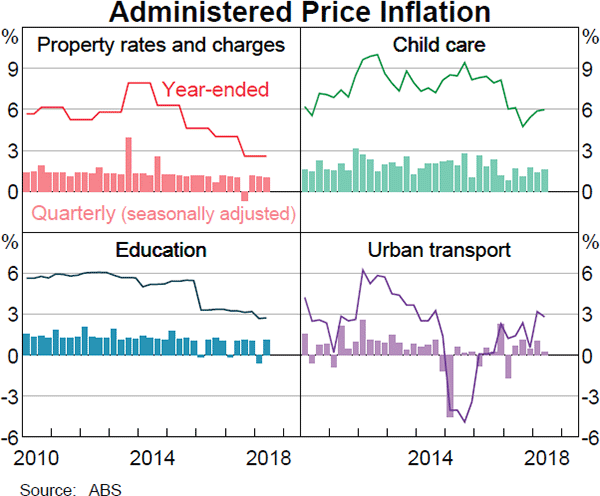
Inflation in the prices of other administered services has declined in recent years to below its inflation-targeting average. Health inflation was unusually low in the June quarter because the annual increase in health insurance premiums was well below average (Graph 4.6). Education cost inflation was also lower over the year, because some school and university fees are indexed to CPI inflation or wages growth, which have been subdued (Graph 4.7). One-off policy changes in some states have also contributed to lower-than-average inflation in education costs in recent years. In contrast, tobacco inflation remained elevated in the June quarter due to ongoing increases in the tobacco excise. After 2020, legislated tobacco excise increases will be smaller in size.
Housing cost inflation varies across the cities
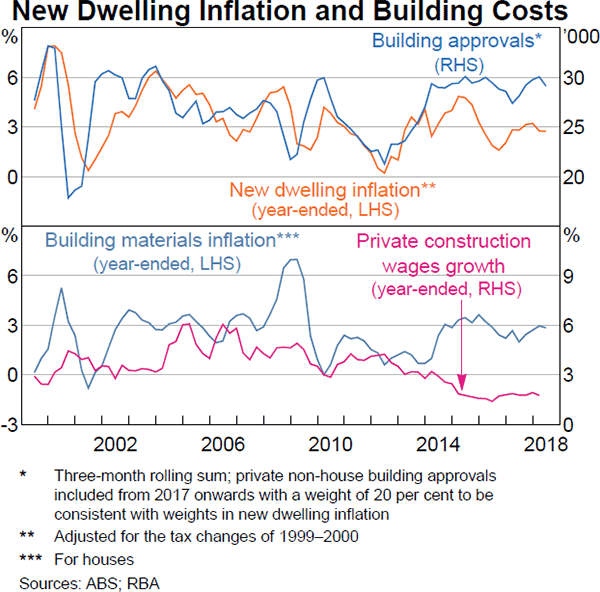
The cost of building a new dwelling has risen by around 3 per cent over the past year (Graph 4.8). Inflationary pressures in the sector have risen a little since 2016, which has been a period of elevated construction activity. Consistent with this, new dwelling cost inflation has been highest in the capital cities in eastern states, which have generally experienced the strongest growth in detached dwelling construction. There are reports that an increase in the domestic production capacity of some construction materials has limited cost inflation and that developers are compensating for higher costs by switching to lower-cost building materials. Despite this, liaison contacts have reported growing cost pressures for selected materials that are also in demand for public infrastructure projects in Sydney and Melbourne. While wages growth appears fairly contained in the construction industry as a whole, liaison contacts suggest that skill shortages for some construction workers have pushed up subcontractor rates and are also contributing to construction cost pressures in Sydney and Melbourne.
Year-ended rent inflation in the Consumer Price Index (CPI) was 0.6 per cent, which remains around the lowest rate since mid 1994. There is considerable variation in rent growth across capital cities (Graph 4.9). Rents increased by around 4 per cent in Hobart but were relatively steady at 2 per cent in Sydney and Melbourne. In contrast, rents declined modestly in Brisbane where there has been a substantial addition to the apartment stock in recent years.
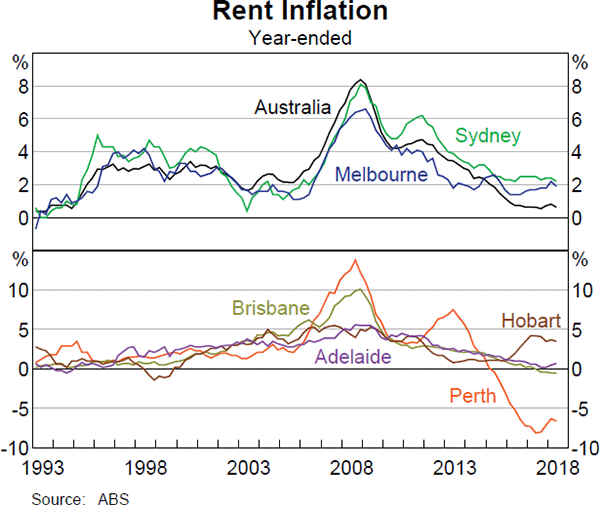
In Perth, rents have been falling for some time. More generally, the weakness of inflation in Perth relative to other capital cities is quite broad based across expenditure categories and predominantly reflects the ongoing effects of the end of the mining boom on the Western Australian economy. New dwelling cost inflation and wages growth have also been somewhat lower in Perth than in the rest of Australia.
Retail prices have continued to decline
Prices of tradable items have declined by around 1 per cent in year-ended terms once particularly volatile items – fruit, vegetables and fuel – are excluded. Grocery food prices were little changed in the June quarter, continuing the trend of very low inflation in food prices of the past couple of years (Graph 4.10). In contrast, non-alcoholic beverage prices have increased noticeably since the introduction of a container deposit scheme in New South Wales in December 2017. Consumer durable prices were around 2 per cent lower over the year.
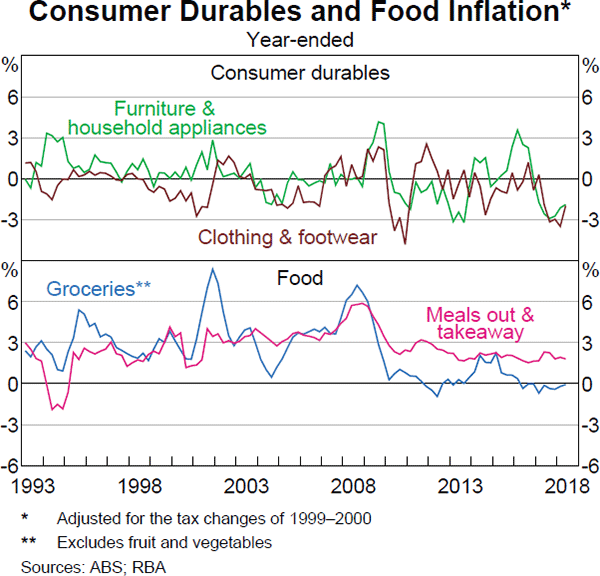
Intense competition in the retail industry is contributing to the ongoing weakness in tradable price inflation. Reports from liaison contacts suggest that the implementation of ‘everyday low price’ strategies has been partly responsible for low supermarket price inflation in recent quarters. Non-food retailers have also been engaging in aggressive discounting strategies, often to clear excess stock.
Another factor that has weighed on retail price inflation is subdued growth in input costs. Retail rents have been little changed for some time and, as noted earlier, growth in labour costs has been slow. Even where costs have risen more noticeably, such as for energy, this does not seem to have been passed on to product prices. In any case, utility price pressures are likely to have eased more recently given that wholesale energy prices have declined in recent months. The import-weighted exchange rate is a little lower over the year, which has put some upward pressure on final retail prices.
Low wages growth is weighing on inflation
Wages growth continues to be low and stable across most industries and states. Several factors have contributed to low wages growth including spare capacity in the labour market, and the process of adjustment to the end of the mining boom. Low wages growth has weighed on inflation because wages are the largest component of business costs. In turn, low inflation and expectations that inflation will remain low in the near term have weighed on wages growth.
Wages growth has also been relatively low across a number of other advanced economies in recent years, suggesting that similar factors are at play. Lower productivity growth is likely to have played a role, as has a decline in labour's relative bargaining power and the effects of technological change and globalisation.
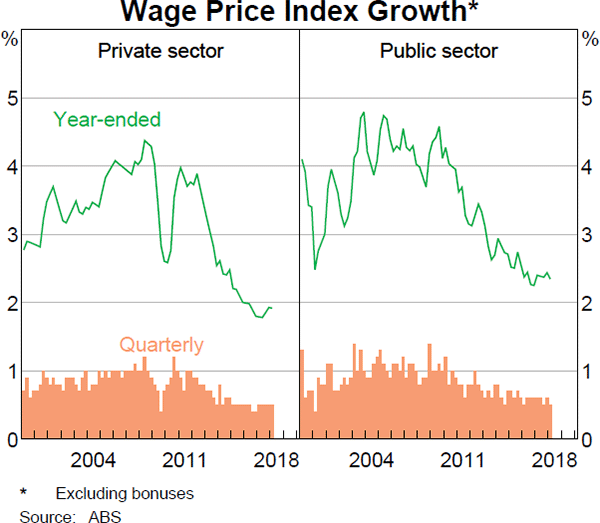
The Wage Price Index (WPI) grew by 0.5 per cent in the March quarter to be 2.1 per cent higher over the year (Graph 4.11). Public sector wages growth remains higher than private sector wages growth, despite being subject to government wage caps in most jurisdictions. Wages growth was strongest in the household services sector, largely driven by health care & social assistance, and education & training. Year-ended wages growth has increased modestly relative to a year ago in these industries. Wages growth remains highest in Victoria, while year-ended wages growth in Western Australia and Queensland has picked up from low levels of a year ago.
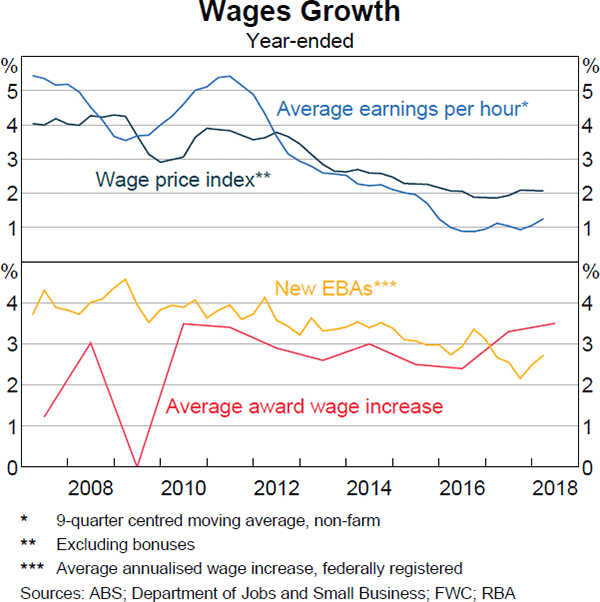
Average earnings per hour in the national accounts (AENA) captures a wider range of payments than the WPI, including allowances, superannuation and redundancy payments, as well as changes in the composition of employment. Growth in AENA per hour has been lower than in the WPI over recent years, though it has risen a little recently in trend terms (Graph 4.12). Given that voluntary turnover (people choosing to change jobs) is typically associated with an increase in income, the decline in turnover over the past decade is likely to have been one compositional factor weighing on average earnings. In addition, some of the turnover over the past couple of years may have been from higher-paid mining-related jobs to lower-paid jobs outside this sector.
Award and minimum wages increased by 3½ per cent
The Fair Work Commission (FWC) determined that there would be a 3.5 per cent increase in the national minimum wage from 1 July 2018 in its annual wage review, as well as for the minimum wages in federal awards covering specific industries and occupations. The national minimum wage is now $18.93 per hour. The increase was a little larger than last year's increase of 3.3 per cent. The main reasons cited by the FWC for its decision were the positive outlook for the economy and its continued belief that there are no significant measureable negative employment effects of ‘modest and regular’ minimum wage increases.
Nearly one-quarter of all employees, accounting for around 15 per cent of the national wage bill, are covered by awards. Other employees are likely to be indirectly affected by the FWC decision because wage increases in some enterprise agreements are linked or otherwise benchmarked to the outcome of the review. This includes employees who are paid at close to the minimum wage. Estimates suggest up to 40 per cent of employees are directly or indirectly affected by the FWC decision, though there remains uncertainty around how recent FWC decisions have influenced wages growth for those not directly linked to the outcome.
Wages growth has increased in new collective agreements
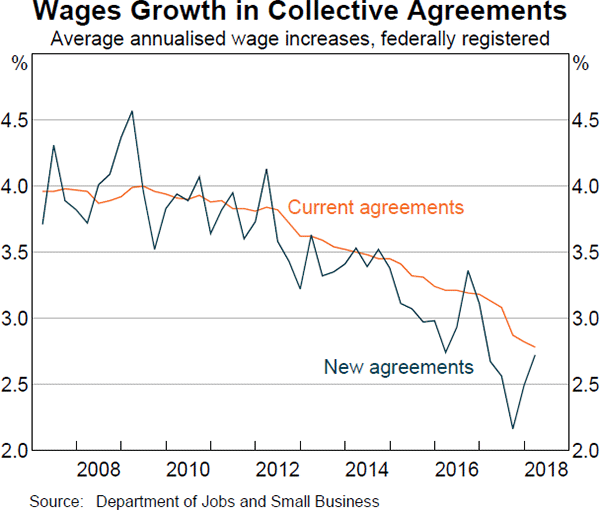
Average wages growth in new federally registered enterprise bargaining agreements (EBAs) increased in the March quarter (Graph 4.13).[1] Despite this, wages growth in new EBAs remains marginally below that in the stock of outstanding EBAs, which implies that average wages growth for employees on EBAs will continue to slow in the near term. The average duration of an EBA is a little over three years.
Expectations of wages growth have picked up, but remain low
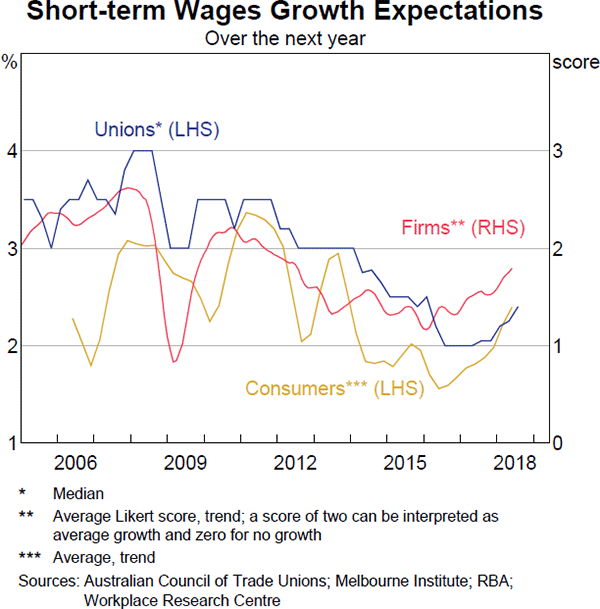
Information from the Bank's business liaison program has for some time pointed to broadening skill shortages and upward pressure on wages growth in some parts of the economy. There is also growing evidence of labour shortages in other business surveys. The proportion of firms reporting wages-growth outcomes above 3 per cent in the liaison program has increased a little this year; the construction industry accounts for most of this change.
The majority of firms surveyed in the liaison program expect private sector wages growth to remain stable over the year ahead, although a growing minority expect wages growth to strengthen (Graph 4.14). Other measures of short-term expectations of wages growth have picked up recently; unions and consumers expect wages to grow by close to 2½ per cent over 2019.
Inflation expectations are unchanged
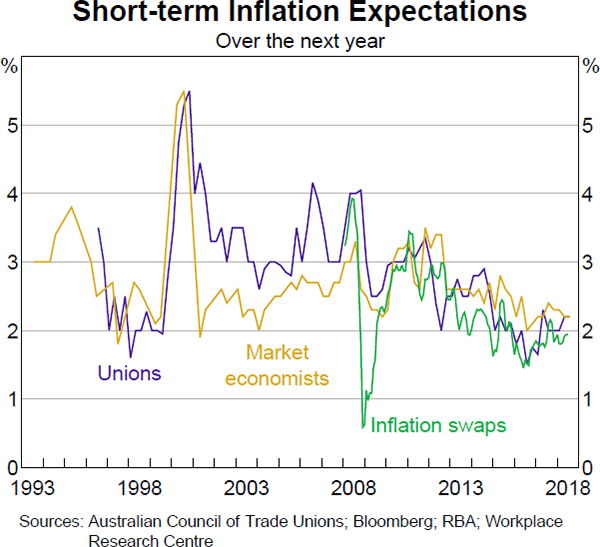
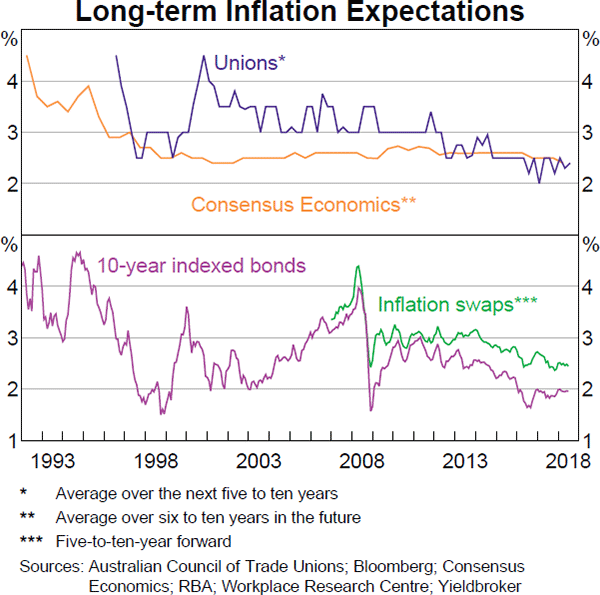
Inflation expectations are generally consistent with the inflation target. Measures of short-term inflation expectations are higher than they were in 2016 but remain low (Graph 4.15). Market economists and unions expect inflation to be around 2¼ per cent over the next year. Survey measures of longer-run inflation expectations remain around 2½ per cent (Graph 4.16).
Footnote
The data on federally registered enterprise bargaining agreements compiled by the Department of Jobs and Small Business do not cover state government agreements (except for Victoria). [1]