Statement on Monetary Policy – August 2018 3. Domestic Financial Conditions
While domestic financial conditions remain expansionary, interest rates in a range of short-term money markets are higher than they were three months ago. The increase in money market rates since the beginning of the year has flowed through to a small increase in funding costs for banks. This has been reflected in higher interest rates on loans to many large businesses, and a number of small- and medium-sized banks have raised their mortgage interest rates. However, the average outstanding rate on housing loans has declined through much of the past year. Overall borrowing rates remain low for both households and businesses. Growth in housing credit has eased, most notably for credit extended to investors. Growth in business debt has picked up a little since the beginning of the year. The Australian dollar remains within its narrow range of the past couple of years. Financial market prices suggest that the cash rate is expected to remain unchanged this year.
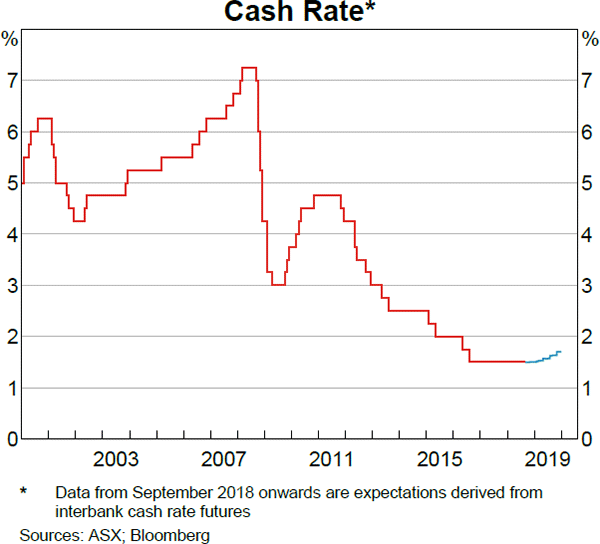
Investors expect the cash rate to remain unchanged over the year ahead
The Reserve Bank has maintained the cash rate target at 1.5 per cent since August 2016. Financial market prices imply that the cash rate is expected to remain unchanged this year and increase to 1.75 per cent around the end of next year (Graph 3.1).
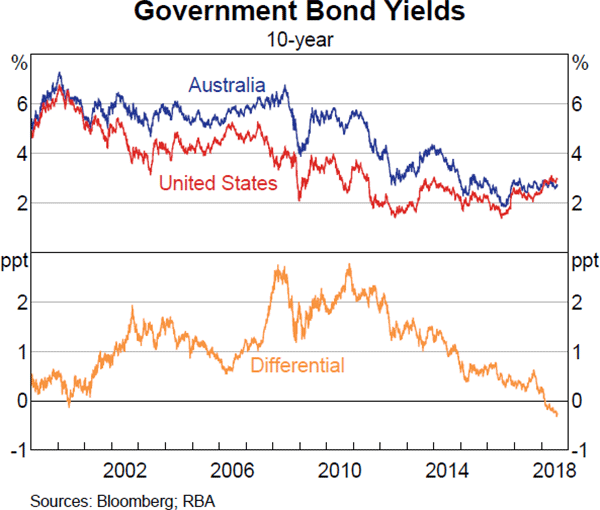
Government bond yields have been little changed
Yields on 10-year Australian Government Securities (AGS) have moved lower to around 2.65 per cent, to be little changed since the start of the year. The yield on 10-year AGS is around 30 basis points below the yield of 10-year US Treasury securities (Graph 3.2). Issuance from the Australian Government and state borrowing authorities has continued to be well received by the markets. The pace of issuance by the Australian Government is expected to decline over 2018/19, reflecting the narrowing in the forecast budget deficit. The stock of bonds issued by the state borrowing authorities is expected to be little changed over 2018/19.
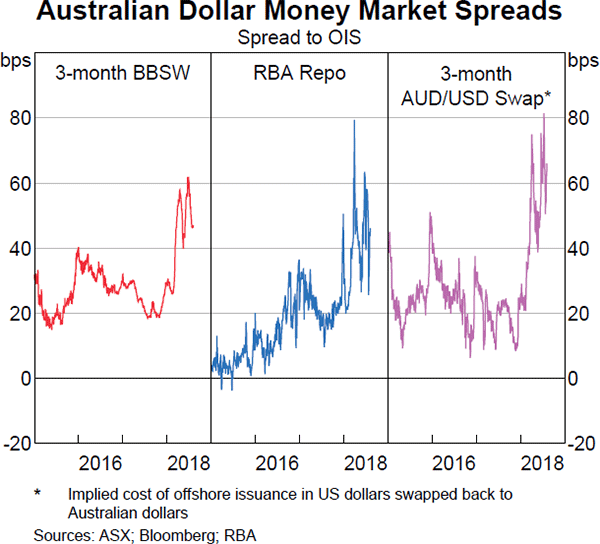
Conditions in short-term money markets have tightened
In recent quarters, interest rates in bank bill, repurchase agreement (repo) and foreign exchange (FX) swap markets have risen noticeably towards the end of the quarter, before easing back (Graph 3.3). For example, in the June quarter, spreads on 3-month bank bill swap (BBSW) rates relative to overnight indexed swaps (OIS) reached a peak of around 60 basis points for a few days, before dropping back to currently be around 45 basis points.
While, after the end of each of the past three quarters money market rates have declined, they have not fully unwound the earlier increase. So overall, money market rates have increased this year despite market expectations for the future path of the cash rate having been little changed. Spreads on 3- and 6-month bank bills relative to OIS are currently around 20 basis points higher than the average over 2017. The cost of raising funding in the United States (in US dollars) and then converting these funds into Australian dollars in the FX swap market also increased, and has at times been well above the cost of raising funds domestically. Repo rates at the Reserve Bank's open market operations have also increased, and are currently around 40–50 basis points above OIS. This continues to reflect strong demand for secured funding from market participants. In contrast, conditions in the overnight interbank markets have remained little changed and the cash rate has continued to trade at the Board's target.
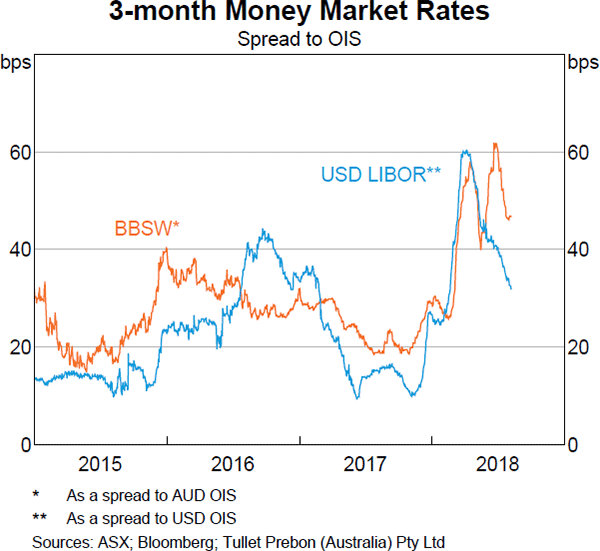
The increase and subsequent (smaller) decline in money market rates through March and early April coincided with similar movements in rates on a range of short-term US dollar instruments relative to US dollar OIS (Graph 3.4). These movements in the US markets had a knock-on effect in other markets including Australia, since Australian (and other) banks fund a share of their domestic balance sheets in US markets; so, in part the increase in BBSW rates relative to 2017 has reflected a spillover from higher US LIBOR spreads. Over the end of the June quarter, Australian dollar money market rates rose and declined again, but unlike the previous quarter, this was not associated with a similar pattern in US dollar money market spreads.
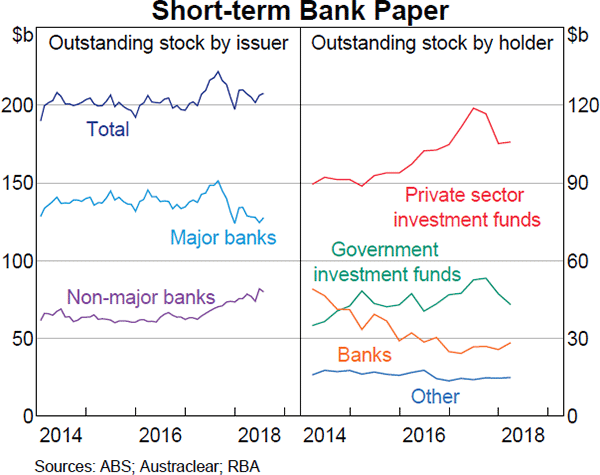
One factor contributing to the dynamics in the domestic bank bill market is an apparent decline in demand for the major banks' bills from investment funds. Over recent years, investment funds have become the dominant holders of bills, as banks have reduced their holdings of other banks' paper (Graph 3.5). Since late last year, some investment funds have shifted their asset allocation away from bills towards global equities. This reduction in demand appears to have contributed to the increase in BBSW rates and has been accompanied by the major banks reducing their issuance since late 2017. Meanwhile, bill issuance by other banks (including by foreign banks operating in Australia) has increased. This would have provided some competition to major banks' bill issuance (which underpins the BBSW rate). However, this increased issuance by other banks has been apparent since early 2017, whereas the behaviour of BBSW rates has changed most noticeably only over recent quarters.
There are some longer-run, structural developments that could help to explain why sharper movements in interest rates in Australian dollar money markets have become more prevalent of late.
First, banks, including in Australia, have become more reluctant to supply liquidity in money markets. In other words, banks appear less inclined to be ‘market makers’, which stand ready to buy and sell in money markets, thereby absorbing movements in demand and supply. This is likely to be partly the consequence of changes in banking regulation following the global financial crisis (which were intended to encourage market participants to price the risk involved in market making appropriately). The greater focus on bank conduct in money markets also appears to have played a role. As a result, liquidity – the capacity to buy or sell at short notice without significantly affecting the price – has declined.
Second, there has been strong demand to borrow Australian dollars in money markets. In net terms, banks operating in Australia have been raising more funds offshore, which they convert into Australian dollars via the FX swap market. In addition, there has been strong demand to borrow Australian dollars from other financial institutions in the repo market as part of their investment strategies.
Banks' funding costs have risen but remain low
The rise in interest rates in short-term money markets has led to an increase in banks' overall funding costs. However, banks' funding costs have increased by less than the increase in money market rates and remain low by historical standards.
Higher BBSW rates affect bank funding costs in a number of ways. First, BBSW rates flow through to the rates banks pay on their new and existing variable-rate wholesale debt.
Second, the higher BBSW rates and an increase in the cost of swapping foreign currencies for Australian dollars has increased the cost of hedging the interest rate and exchange rate risks on banks' balance sheets (this is also true for other companies that raise funds offshore). When banks issue fixed-rate bonds, they tend to swap a sizeable share of these fixed interest rate exposures into floating rate exposures. This aligns the nature of the rates for their funding with those of their assets (which consist largely of variable interest rate loans). In doing this, the banks typically end up paying BBSW rates on their hedged liabilities. Australian banks also raise a significant amount of their funding in foreign currency, which they convert into Australian dollars via cross-currency swaps; the cost of doing this has increased in recent months, which also adds to banks' overall cost of raising funds.
Third, rates on wholesale deposits tend to be closely linked to BBSW rates, so the cost of these deposits is rising. Wholesale deposits include deposits from large corporations, pension funds and the government, and account for around 30 per cent of banks' debt funding.
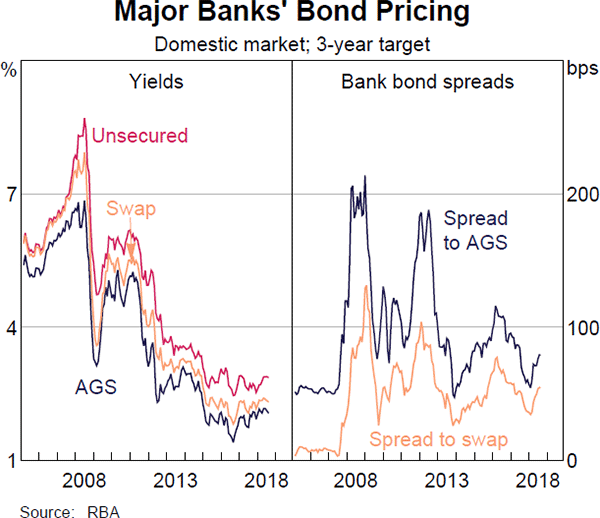
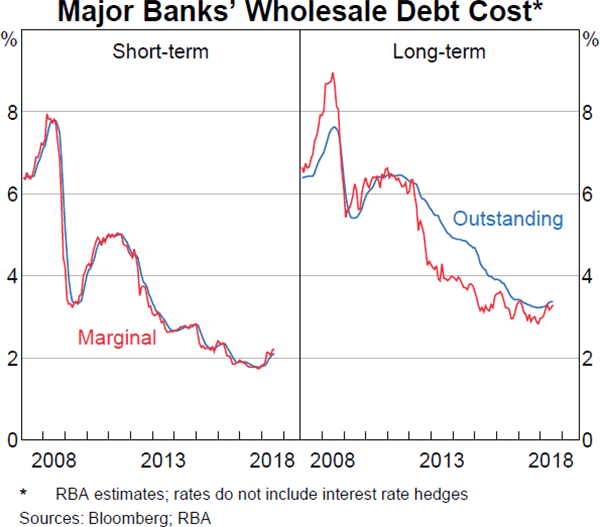
The cost of new long-term debt has also risen due to spreads to benchmark rates for bank bonds having increased since the start of the year, to around the average of the past two years (Graph 3.6). Nevertheless, the cost of short-term and long-term debt for banks generally remains at a low level (Graph 3.7).
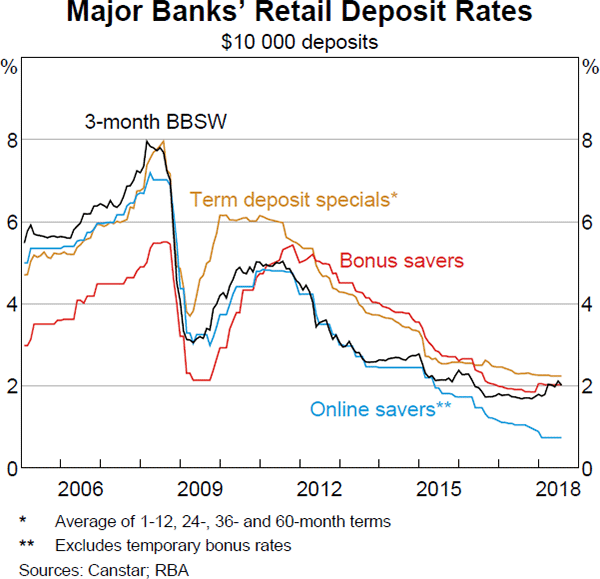
Retail deposit rates have been little changed over the year to date and also remain low by historical standards (Graph 3.8). Retail deposits account for around a third of banks' funding. Given this, the overall increase in funding costs is significantly less than the 20 basis point increase in BBSW rates.
Interest rates on some bank assets are also linked to BBSW rates, limiting the impact that higher funding costs have had on banks' net interest margins (NIM).[1] Some business lending rates are closely linked to BBSW rates and, therefore, have increased in recent months (lending rates are discussed in more detail below). Yields on banks' liquid asset holdings (including on bank bills issued by other financial institutions and other debt securities) have also risen as a result of the higher BBSW rates.
Banks have maintained good access to wholesale funding markets
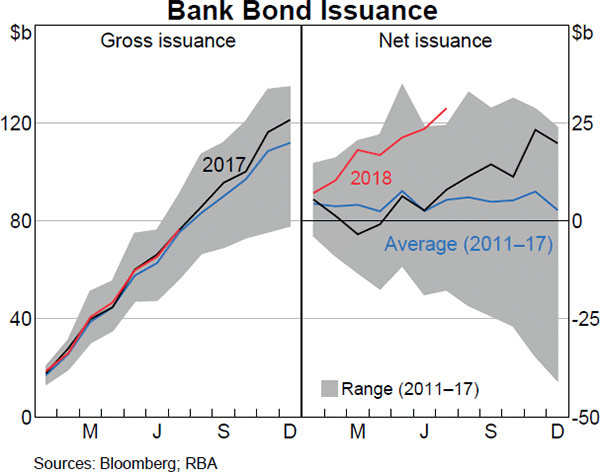
Gross bond issuance by Australian banks has been at a similar pace to previous years, with around $75 billion raised over the first seven months of the year (Graph 3.9). However, net issuance has been above average given that there have been relatively few bond maturities over the year to date. Most of the banks' wholesale funding continues to be raised in offshore markets.
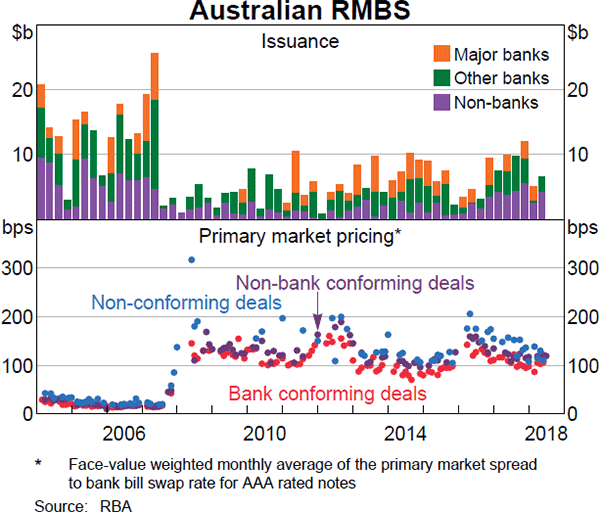
Issuance of residential mortgage-backed securities increased in the June quarter, but remains lower than in 2017 (Graph 3.10). Non-bank deals accounted for most of the issuance, with the major banks largely absent from the market.
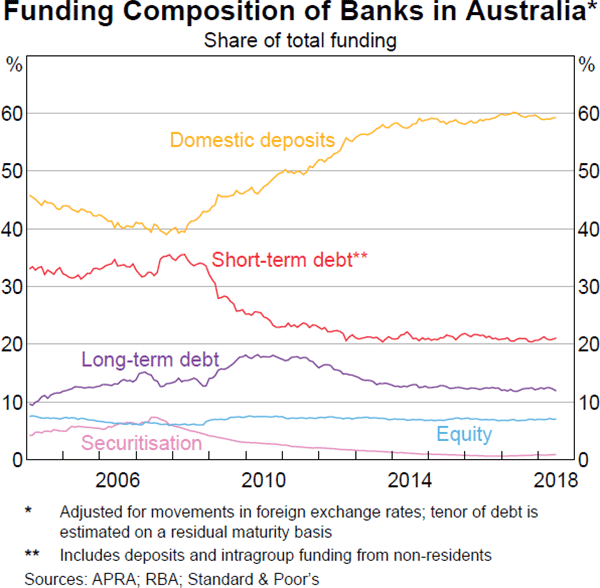
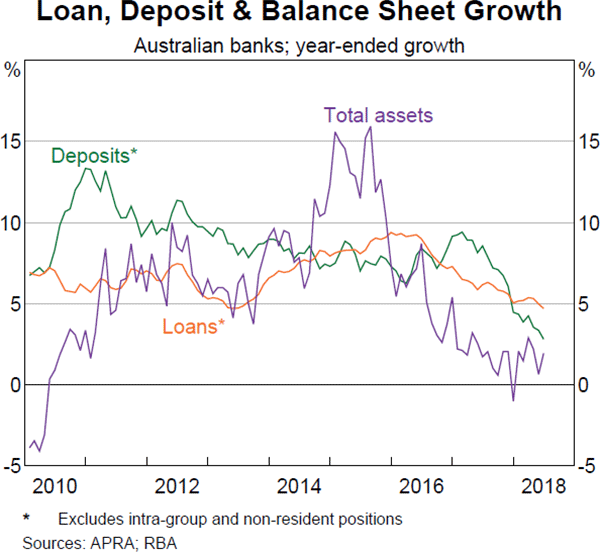
Overall, the composition of banks' funding has been little changed since the beginning of the year (Graph 3.11). Growth in banks' funding liabilities has been subdued, consistent with the moderation in growth in banks' assets. While deposit growth has slowed relative to lending growth, this is unlikely to have been a factor contributing to the increase in money market rates such as BBSW rates (Graph 3.12). In particular, banks' total assets have been growing at a slower rate than both deposits and lending; this reflects the slow growth, and in some cases contraction, of other assets on banks' balance sheets (such as intragroup assets, securities and non-resident assets). Slower growth of assets relative to deposits is consistent with the observation that retail deposit rates have been little changed this year (Graph 3.8). In other words, banks have not sought to attract additional deposits by raising rates.
Housing credit growth has slowed, driven by investors
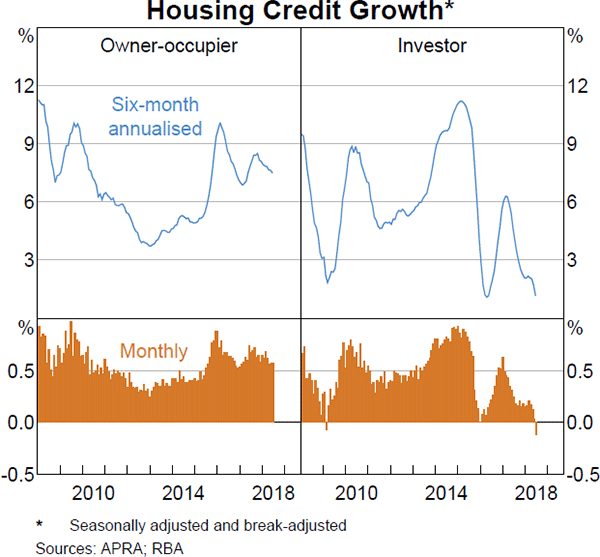
Housing credit growth has eased since mid 2017 to around 5½ per cent in year-ended terms (Table 3.1). This was driven by slower growth in borrowing by investors, which has declined to around 1½ per cent in year-ended terms (Graph 3.13).
The slowing in credit growth reflects a combination of demand and supply factors, with the demand factors likely to have been the more dominant influence of late. In particular, there has been a general decline in the growth of demand for housing credit from investors as housing dynamics have changed. This easing in demand growth has been associated with lower expected capital gains, with housing prices declining in some markets.
| Three-month ended | Year-ended | ||
|---|---|---|---|
| Mar 2018 | Jun 2018 | Jun 2018 | |
| Total credit | 1.1 | 0.9 | 4.5 |
| – Housing | 1.5 | 1.1 | 5.6 |
| – Owner-occupier housing | 1.9 | 1.7 | 7.8 |
| – Investor housing | 0.5 | 0.0 | 1.6 |
| – Personal | −0.3 | −0.5 | −1.3 |
| – Business | 0.7 | 0.7 | 3.2 |
| Broad money | 1.0 | 0.3 | 1.9 |
|
(a) Seasonally adjusted and break-adjusted Sources: ABS; APRA; RBA |
|||
Growth in the supply of credit has also slowed over recent years. The decline in housing credit growth since mid 2017 partly reflected a reduction in interest-only (IO) lending (which is more prevalent among investors than owner-occupiers). Banks raised interest rates and tightened some lending standards on these loans following APRA's measures to reinforce sound residential mortgage lending practices, particularly the requirement that authorised deposit-taking institutions (ADIs, such as banks) limit new IO lending to 30 per cent of total new residential mortgage lending. There may have been some further tightening in lending standards by banks during 2018 due to additional public scrutiny. While growth in the overall supply of credit has slowed, lenders are competing strongly for high-quality borrowers, such as principal-and-interest borrowers that also have low loan-to-value ratios. This has been reflected in lower interest rates for this group (discussed further below). Moreover, growth of owner-occupier housing credit has remained robust, at close to 8 per cent in year-ended terms.
A number of observations are consistent with the decline in the growth of demand for housing credit having been somewhat greater than the decline in the growth of supply. In particular, the average outstanding variable interest rate on housing loans has declined moderately since last year (discussed further below). Also, rates on investor housing credit have tended to decline by more than for owner-occupier credit, which is consistent with a notable decline in the growth of demand for investor credit. In addition, growth in lending by non-major banks and non-ADIs has been well above that of the major banks, providing additional credit supply (Graph 3.14).
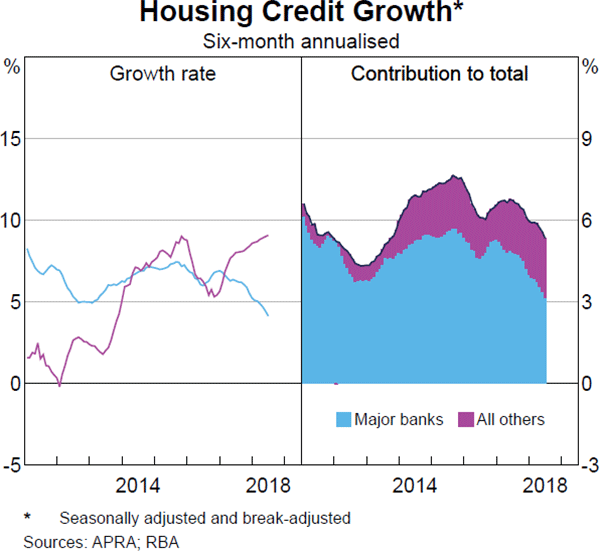
Liaison indicates that non-ADIs have been lending to some borrowers who typically would have borrowed from ADIs in the absence of the regulatory measures. This includes IO borrowers and borrowers who are having difficulty meeting banks' tighter lending criteria (although the available evidence suggests that there has been little sign of widespread financial distress among those who have had their IO periods expire and have started making principal repayments). Nevertheless, lending by these institutions remains small as a share of loan approvals and housing credit, at less than 5 per cent.
Average housing interest rates remain low
The average rates paid on outstanding variable rate housing loans in the RBA's Securitisation Dataset have drifted down by around 10 basis points since August 2017 (Graph 3.15; Table 3.2).[2]
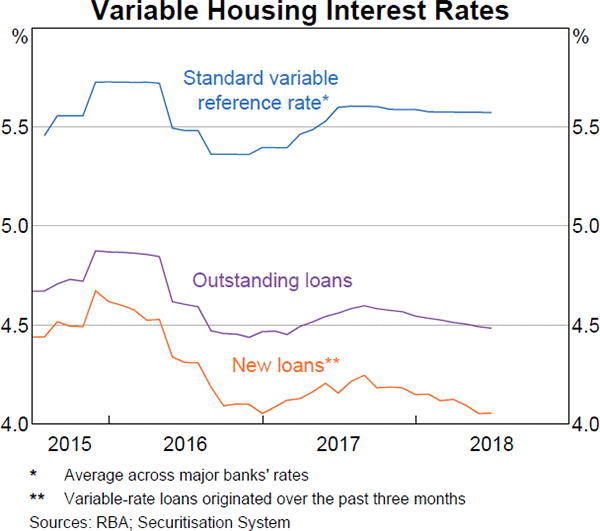
In recent months, a number of small- and midsized lenders raised their standard variable rates (SVRs) by an average of around 10 basis points, with the majority of rate changes taking place since late June. These recent SVR increases tended to be larger for investors than owner-occupiers. The changes were largely attributed to rising funding costs. The lenders that have increased their SVRs account for around 15 per cent of housing credit, so the effect of these changes on average outstanding rates is modest.
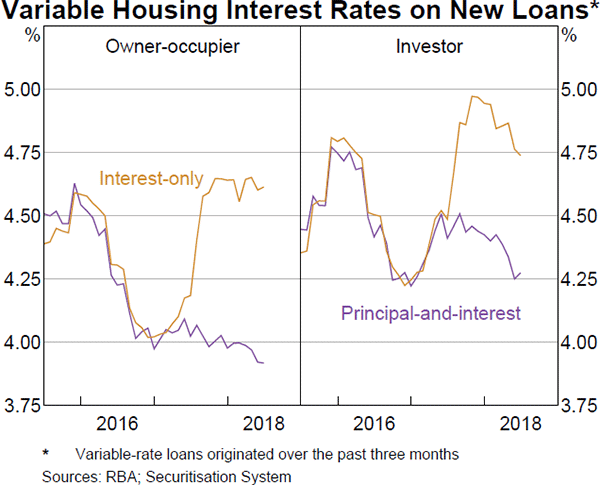
Meanwhile, lenders are actively competing for new loans. The average rates paid on new variable-rate loans in the Securitisation Dataset decreased by around 20 basis points between August 2017 and June 2018. Also, many lenders have cut their fixed interest rates for new borrowers during the past few months. The decline in the rates for new loans has been somewhat more pronounced for investors than for owner-occupiers since the beginning of the year (Graph 3.16). Moreover, advertised rate reductions for new borrowers have targeted investor loans more frequently than owner-occupiers over the past few months. As discussed above, the larger decrease in rates for investors is consistent with the decline in the growth of demand for housing loans from investors being larger than the decline in the growth of the supply of housing loans (which followed the earlier tightening in banks' lending standards towards investors).
| Interest rate | Change since August 2017 | Change since November 2016 | |
|---|---|---|---|
| Per cent | Basis points | Basis points | |
| Housing loans(a) | |||
| – Variable principal-and-interest rate | |||
| – Owner-occupier | 4.25 | −10 | −16 |
| – Investor | 4.70 | −8 | 10 |
| – Variable interest-only rate | |||
| – Owner-occupier | 4.72 | −4 | 40 |
| – Investor | 5.07 | −4 | 58 |
| – Fixed rate | |||
| – Owner-occupier | 4.18 | −14 | −34 |
| – Investor | 4.33 | −9 | −28 |
| – Average outstanding rate | 4.45 | −11 | 0 |
| Personal loans | |||
| – Variable rate(b) | 11.4 2 | −20 | −7 |
| Small business | |||
| – Term loans variable rate(c) | 6.43 | 0 | 4 |
| – Overdraft variable rate(c) | 7.2 6 | −5 | −1 |
| – Fixed rate(c)(d) | 5.33 | 2 | 2 |
| – Average outstanding rate(e) | 5.32 | 4 | −3 |
| Large business | |||
| – Average outstanding rate(e) | 3.67 | 28 | 18 |
|
(a) Average rates from Securitisation Dataset, updated for end June
2018 Sources: ABS; APRA; Securitisation System; RBA |
|||
Funding conditions are generally accommodative for businesses
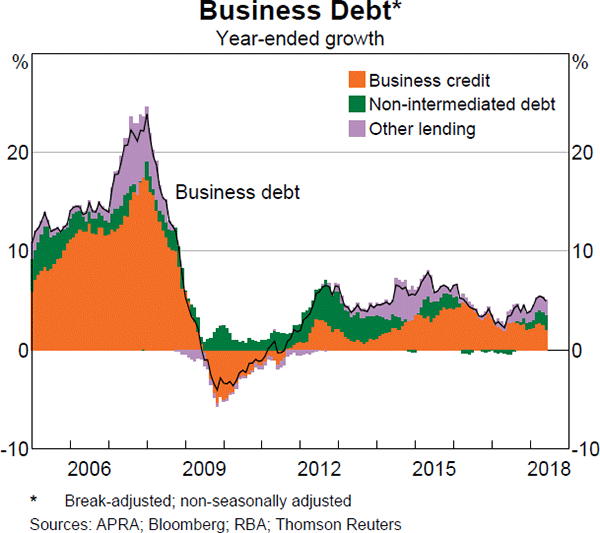
Growth in business debt has risen since the start of the year (Graph 3.17). This has been driven by increased bond issuance and a pick-up in syndicated lending by institutions that do not report their lending to APRA (that is the ‘other lending’ category). At the same time, business credit growth remains low by historical standards. Overall, growth in business debt remains moderate, despite interest rates being at low levels and a pick-up in business investment outside the mining industry. In part, the growth in business debt remains moderate because businesses have tended to finance much of their investment from their retained profits rather than from external sources.
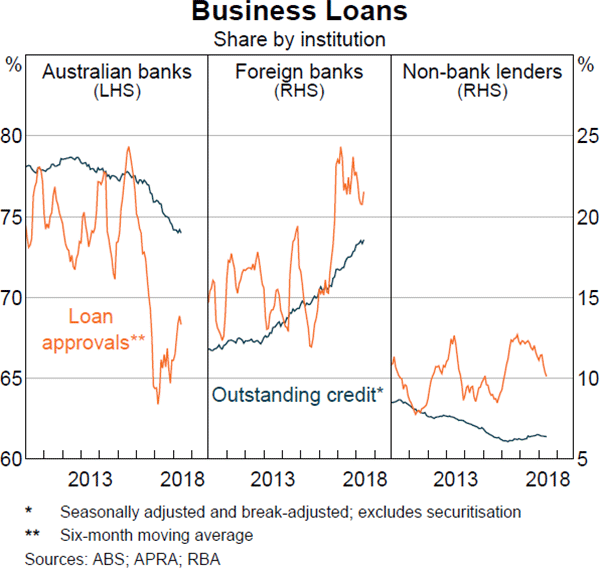
Growth in lending by the Australian banks to businesses has been subdued over the past few years, with foreign banks (primarily European and Asian lenders) driving the growth in aggregate business credit. Reflecting this, the Australian banks' share of business credit is around its lowest level since mid 2007. The major banks' share of business loan approvals has picked up somewhat more recently (Graph 3.18).
During the past few months, the Reserve Bank has hosted a number of roundtable discussions on small business financing with entrepreneurs, government representatives, banks and non-bank lenders. Participants identified a range of challenges that small businesses face when accessing finance, including limited access to funding for start-up businesses and a heavy reliance on lending secured by housing collateral and personal guarantees. A range of ideas for addressing these challenges were also discussed. In particular, the representatives from banks and non-bank lenders agreed that the government's comprehensive credit reporting and open banking policy initiatives could help improve access to finance, in part by providing lenders with more information for making lending decisions. The Reserve Bank will continue to monitor developments in small business financing.
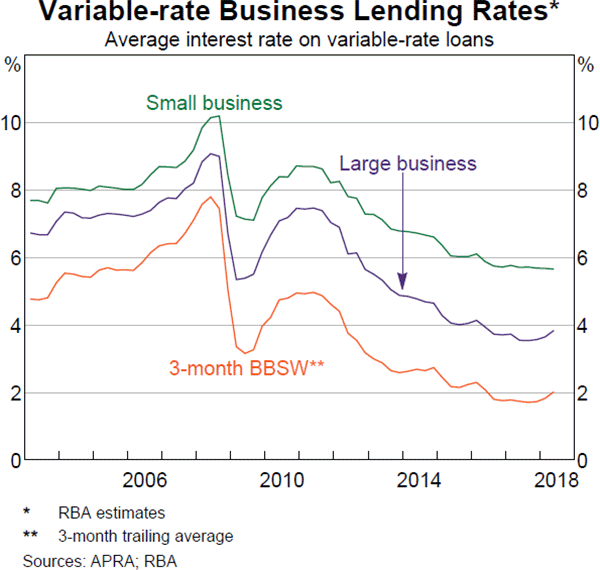
In aggregate, interest rates on business loans remain low by historical standards (Graph 3.19). Interest rates on outstanding loans to large businesses have increased by around 20 basis points since the start of the year. This reflects the fact that many large business loans are closely linked to BBSW rates. The link between variable rates on small business loans and BBSW rates is less direct and the interest rates on outstanding variable-rate loans to small businesses have increased only slightly since mid 2017. However, advertised rates for fixed-rate small business loans have edged a little higher this year.
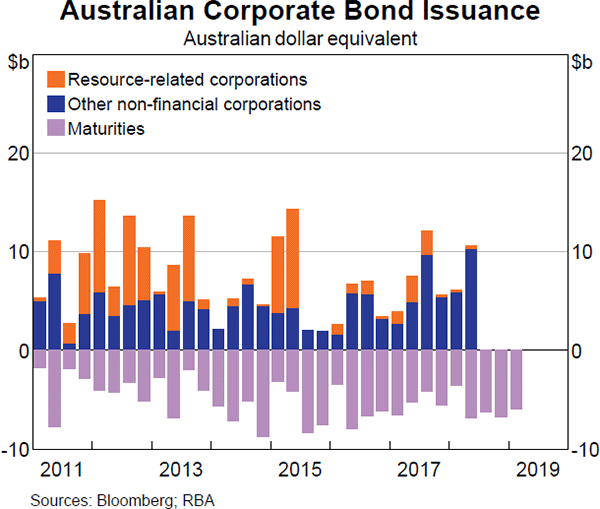
Bond issuance by Australian non-financial corporations was strong in the June quarter (Graph 3.20). Issuance was mainly from utilities and infrastructure companies. In line with global trends, interest rates for issuers have increased since the beginning of this year, but remain at low levels.
Australian equity prices have increased
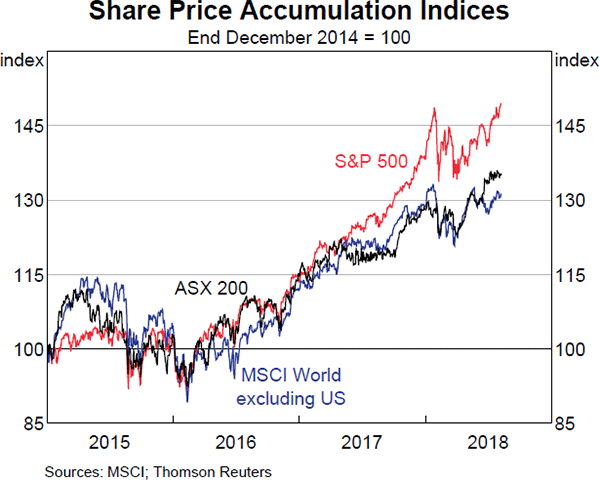
Australian equity prices have largely followed global developments in recent months to be around 3 per cent higher since the end of 2017 (Graph 3.21). Market volatility has remained low.
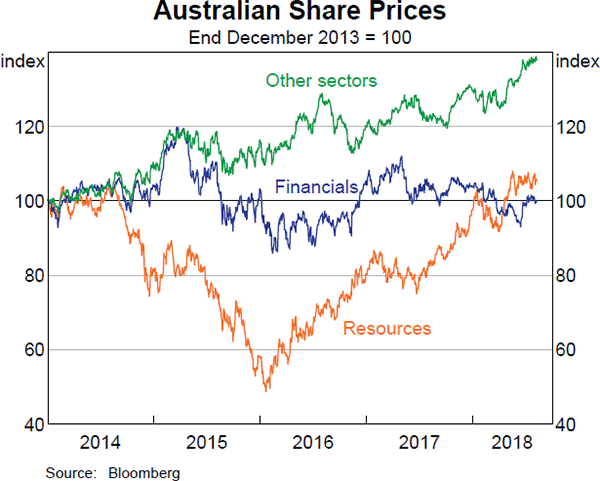
Resources sector share prices are 9 per cent higher since the end of 2017, consistent with an overall increase in commodity prices (Graph 3.22). Analysts' earnings expectations for the sector have continued to increase. Banks' share prices have risen recently, but are still lower than they were at the end of 2017. Meanwhile, healthcare and consumer staples companies' share prices have increased strongly, while the telecommunications sector is down around 20 per cent over the year.
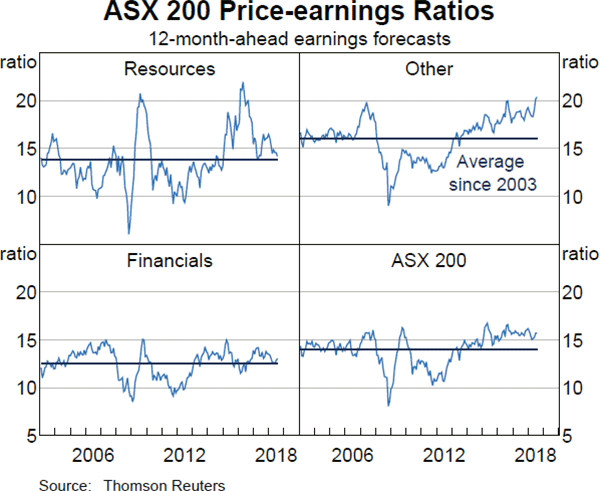
Analysts' earnings expectations for coming years have been revised higher this year, driven by the resources sector. Expectations are that overall earnings will continue to rise, consistent with survey measures of business conditions, which remain elevated. Price-to-earnings ratios for the resources and financials sectors are close to long-run averages, while ratios for other sectors are somewhat above average (Graph 3.23).
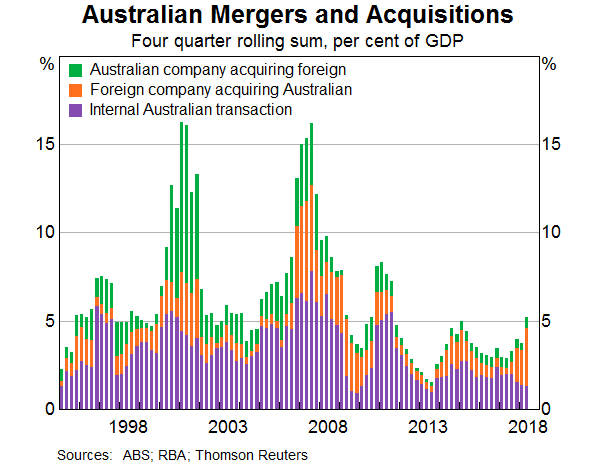
Some large mergers and acquisitions (M&A) have been completed or announced recently, particularly foreign acquisitions of Australian companies (Graph 3.24). Most notably, Unibail-Rodamco's acquisition of Westfield was completed in May, and gas pipeline company APA received a $13 billion takeover offer from CKI earlier this year, although the deal is yet to receive regulatory approval. In addition, Amcor announced the acquisition of US company Bemis in a US$6.8 billion deal.
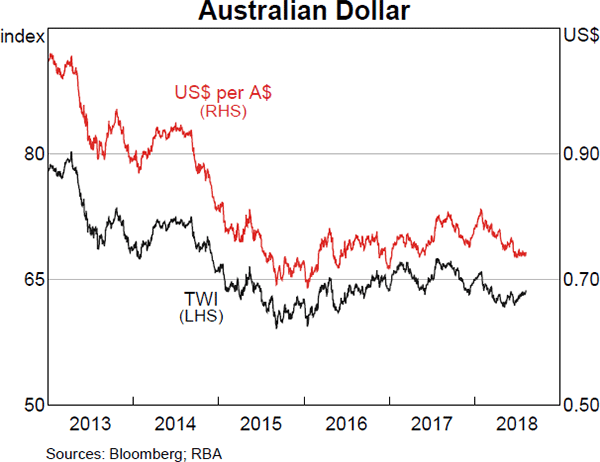
The Australian dollar remains within its narrow range of the past couple of years
The Australian dollar has appreciated a little since the previous Statement on a trade-weighted basis, though remains within its narrow range of the past couple of years (Graph 3.25). The RBA Index of Commodity Prices is little changed since the previous Statement, while Australian bond yields declined slightly relative to those in other advanced economies. The modest appreciation of the Australian dollar has mostly occurred against the exchange rates of Asian economies, in particular the Chinese renminbi, which has depreciated amid moderating growth and rising trade tensions (see ‘The International Environment’ chapter). The Australian dollar is little changed against the US dollar over the period, which has experienced a broad-based appreciation.
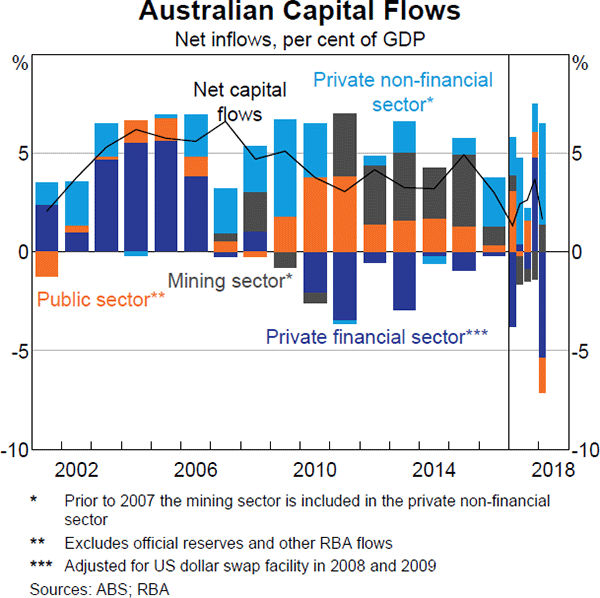
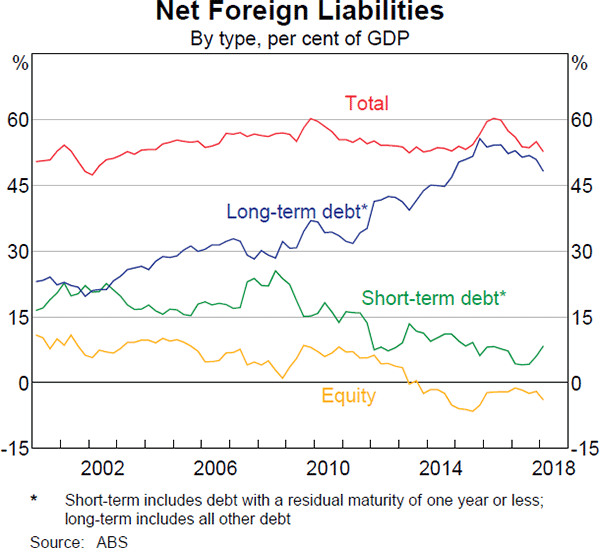
Net capital inflows to Australia remain modest, consistent with the low level of the current account deficit (Graph 3.26). Inflows into the private non-mining, non-financial sector have increased in the past couple of years, partly offsetting a reduction in flows to the mining sector. Australia's net foreign liability position has declined over the same period, largely reflecting a decrease in net long-term debt liabilities (Graph 3.27). Net foreign short-term debt liabilities and net foreign equity assets have been little changed. The net foreign liability position declined modestly in the March quarter to 53 per cent of GDP, and is around its average level of the past two decades.
Footnotes
The NIM is a measure of the difference between the interest income earned by banks, for example on loans and other assets, and the amount of interest they pay out on their liabilities, for example on deposits and other sources of funding. [1]
The Securitisation Dataset covers around one-third of the market for housing loans and includes information on the loans underlying both marketed securitisations and banks' self-securitisations. These data provide useful indicators of developments in home lending, although loans in the dataset may have different characteristics from those not covered by the dataset. See Kent C (2017), ‘Some Innovative Mortgage Data’, Speech at Moody's Analytics Australia Conference 2017, Sydney, 14 August. See also Kohler M (2017), ‘Mortgage Insights from Securitisation Data’, Speech at Australian Securitisation Forum, Sydney, 20 November. [2]