Bulletin – August 2002 Statement on Monetary Policy
Download the complete Statement 1MB
There has been a marked deterioration in sentiment in global financial markets over the past couple of months, with a considerable increase in uncertainty about the short-term course of the global economy. During the first half of the year, despite a generally downward trend in share prices, there was a mood of cautious optimism about prospects for the US economy, where recovery had commenced after an apparently very mild and brief recession during the second half of 2001. Signs of a turning point in Europe and Japan had also emerged, and most forecasters expected global growth to gradually strengthen through the remainder of the year. The US dollar had begun to decline, and the Australian dollar to rise both against the US dollar and other currencies.
In the second half of June, however, market sentiment turned decidedly more bearish. At that stage, US share prices were still high relative to longer-run norms and there was a recognition that businesses would struggle to achieve the profit growth required to validate them. In addition, renewed doubts emerged about the strength of the economic recovery itself, as economic data for the middle of the year proved to be softer than expected. Revisions to earlier national accounts data, moreover, showed a noticeably lower level of economic activity through the past couple of years, and a somewhat deeper recession in the US than had earlier been thought, even if still a relatively mild one by historical standards. While all this was taking place, there was growing concern over the quality of corporate governance and accounting in the US. Earlier confidence that these problems were confined to a few isolated cases gave way to perceptions that there were systemic deficiencies.
In these circumstances, US share prices fell very sharply, particularly in the first three weeks of July. Even after a brief recovery late in the month, by early August the broad US share price indexes had declined by around 45 per cent from their peaks in March 2000. Similar declines since the peak have been recorded in a number of European markets. The Australian share market has been more resilient, but has fallen nevertheless. Bond yields around the world have declined, and risk spreads have widened noticeably, over the past couple of months. Market expectations of monetary tightening in a number of countries, including Australia, have been scaled back. The exchange rate of the Australian dollar was particularly affected. It seems that once market participants started to feel that US share market developments could potentially have a dampening effect on US and world economic growth, they unwound long positions in the Australian dollar that they had built up in earlier months in anticipation of global economic recovery. Other currencies, such as the Canadian and New Zealand dollars, were similarly affected. In trade-weighted terms, the Australian dollar unwound all the rise that had taken place earlier in the year.
At the current juncture, then, confidence about US economic prospects is a good deal weaker than it was a few months ago, mainly because of financial developments, but not exclusively so; recent ‘real economy’ data have also been on the disappointing side. To this it must be added that the pick-up in growth in the Euro area has not, as yet, built much momentum, and while Japan is experiencing better growth, much of that is externally sourced. In contrast, in much of the east Asian region, increases in domestic demand have bolstered the impetus to growth from the export sector. Production has recovered to be around its peaks in late 2000, and the associated improvement in the labour market in a number of countries has helped support household spending.
In assessing global economic prospects the key issue is the extent to which the general weakness in equity markets will exert a dampening effect on activity in the major economies. The size of such an effect will depend, among other things, on the extent to which business and consumer confidence in the major economies are affected, on the way businesses respond to a higher cost of equity capital, and also on whether markets stabilise near their recent levels or decline further. All of these things are inherently difficult to predict. One important factor in assessing the overall impact is that economic behaviour may not have fully adjusted to the run-up in share prices in the late 1990s and so, to that extent, the impact of the subsequent decline could be somewhat limited. It should also be noted that the equity market declines have occurred against a background of expansionary policy settings that will help to offset at least some of their impact, and that the asset price declines have not apparently seriously undermined the asset quality of the global banking system. At this stage, while acknowledging the uncertainties, the most likely outcome in the major economies still appears to be one of moderate growth, though at a slower pace than earlier thought.
The Australian economy is continuing to grow more strongly than the major economies. Quarterly growth has been close to 1 per cent for some time and appears to have maintained a good pace in the June quarter. While the slowdown in the global economy in 2001 has been reflected in lower Australian exports, this has been compensated by the strength of domestic demand. Household spending has been an important driver of domestic demand, and conditions are generally supportive of further good growth. Household incomes are being supported by rising employment and real wages, and consumer confidence remains at a high level. While the pace of employment growth has slowed in recent months from the rapid growth experienced earlier in the year, forward indicators of the labour market suggest reasonably firm labour demand in coming months.
Housing construction has contributed to growth over the past year and, on the latest indications, is likely to remain at a high level in the second half of this year. Demand for investment housing remains strong, and lending to investors for housing has continued to rise at a fast pace in recent months. This looks to be in part a result of expectations by investors that the strong increases in housing prices over recent years will continue into the future. However, the attractiveness of this form of investment now appears to be waning, with the potential for further capital gains in the housing market likely to be countered by increased supply of rental properties, rising vacancy rates and falling rents in some areas.
The Australian business environment should contribute to a pick-up in investment spending, as already signalled in the business surveys. Business confidence is generally at levels consistent with good economic growth and corporate profits have risen at a healthy pace over the past year. The cost of external financing remains low (although the recent turbulence may have reduced the attractiveness of equity finance) and this has been reflected in a marked pick-up in intermediated business borrowing. Notwithstanding this, the overall level of corporate debt remains low. While it is not yet clear whether the general equity market weakness over recent months will have any significant impact on business confidence and investment intentions, it is noteworthy that the corporate sector is in much sounder condition than it was on the previous occasion of sharp equity market declines, in the late 1980s.
The notable exception to the overall positive outlook for the Australian economy is the farm sector. A number of areas of the country – particularly New South Wales, southern Queensland and parts of the wheat belt in Western Australia – have experienced acute rainfall shortages, which are likely to have a detrimental effect on farm production and incomes. Conditions in South Australia, Tasmania and parts of Victoria, however, have been closer to normal.
The CPI outcome in the June quarter was consistent with the inflation forecasts presented in previous Statements. In year-ended terms, the statistical measures of underlying inflation have declined from a little over 3 per cent in the December quarter 2001 to around 2½ per cent. The CPI measure of inflation is running at a slightly faster pace on a year-ended basis, and this may persist for another quarter or two yet. The divergence has predominantly reflected the large increases in the cost of overseas travel, insurance and meat in recent quarters.
The effect on inflation of the exchange rate depreciation of recent years appears to have broadly run its course, and the exchange rate appreciation in the earlier part of this year contributed to the low outcomes for producer price inflation in the June quarter. Combined with the moderate growth in wages, this means that there are few sources of pressure on business margins, with the continuing exception of rising insurance and utility costs. Consequently, as set out in previous Statements, the Bank's assessment is that underlying inflation is likely to remain around the middle of the target band in the second half of 2002. However, a continuation of the current pace of growth in the domestic economy would most likely see increased pressures on wages and prices over the course of 2003. This outlook is predicated on a modest global recovery, albeit at a slower pace than seemed likely a few months ago. As discussed earlier, this appears the most plausible scenario for the world economy at present, although the downside risks have clearly increased in light of financial market developments over recent months.
In the environment of the stronger world economy in the first half of the year, the Board took the view at its May and June meetings that the expansionary stance of monetary policy which had been in place during late 2001 and early this year was no longer warranted, and that a process of returning rates to levels more consistent with the economy's more favourable circumstances should commence. At both meetings, it increased the cash rate by 25 basis points. Even after these adjustments, however, the cash rate remained on the expansionary side of neutral. With the weight of domestic economic indicators pointing to continued strong growth, and inflation remaining in line with earlier forecasts, there was a general case to be considered at both the July and August meetings for further rises.
The Board also had to take account, however, of the sharp decline, and the considerably increased volatility, of global equity markets, and the possible impact of those changes on the economic outlook. As discussed above, those impacts are difficult to predict, not least because it is not yet known at what level markets will stabilise. If the effects on growth of the global economy, and consequently on Australia, turn out to be quite small, the case for further rises in interest rates would remain intact. While this appears the most plausible scenario, the possibility of a significant dampening impact of the financial turmoil on the global economy must be taken into account. Given these uncertainties, the Board judged at both its July and August meetings that it was prudent to leave the cash rate unchanged.
International and Foreign Exchange Markets
Equity markets
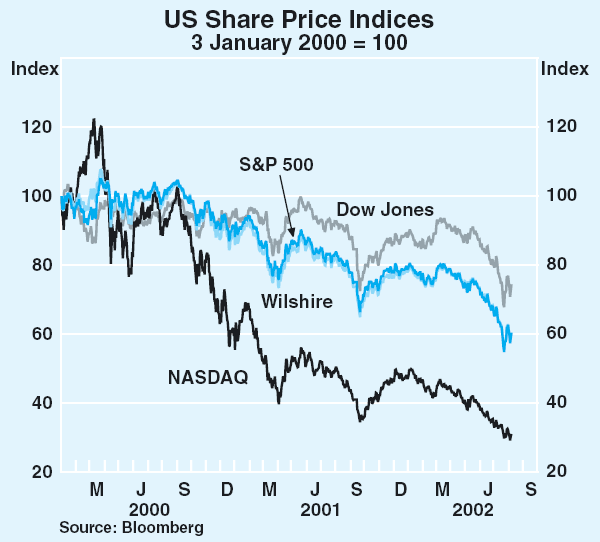
Equity markets have been at centre stage in recent months because of the high volatility and large net falls in all major countries. In the US, broad measures of stock prices, such as the Wilshire 5000 and S&P 500 indices, have fallen by around 20 per cent over the past three months (though mostly in the first part of July) while the Nasdaq composite index has fallen around 25 per cent (Graph 1).
There are a number of aspects to the recent falls in US share prices that are worthy of note:
- First, this is the third year in a row that broad indices of share prices have fallen. Such long drawn-out falls are rare, having occurred only twice before over the past century.
- Second, the cumulative falls are large. At one stage in mid July the S&P 500 was down by 48 per cent from its peak, the largest such fall since the 1930s.
- Third, the falls have continued despite the very substantial easing of monetary policy by the Fed and signs of economic recovery.
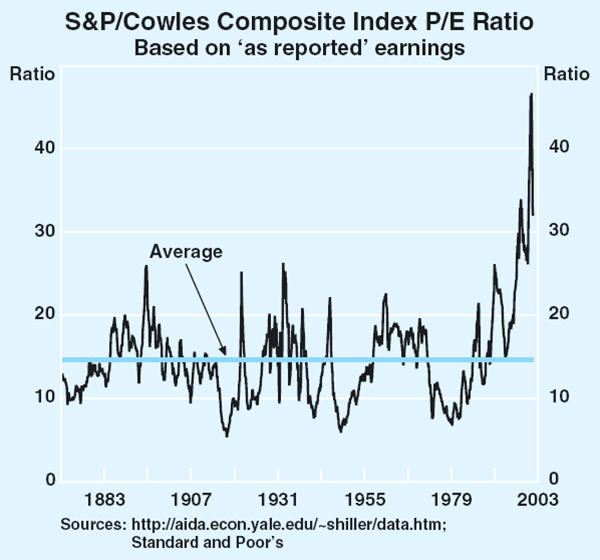
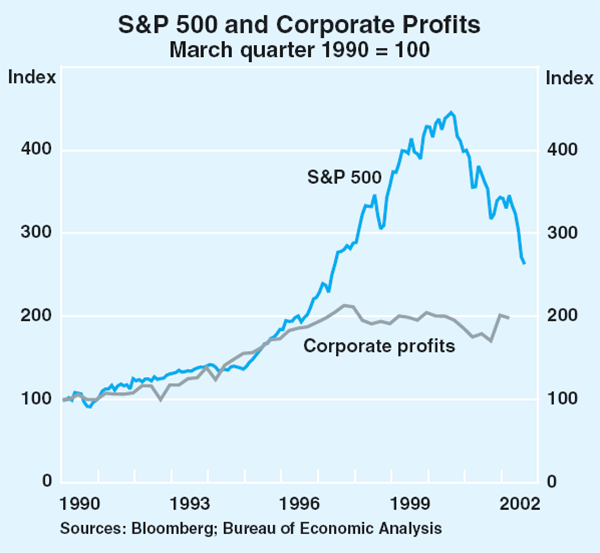
The unusual nature of recent events is to a large extent a consequence of the scale of the earlier rises in share prices. On various measures, the rise in share prices from 1995 stands out: the absolute size of the rise was extremely large; the ratio of share market capitalisation to GDP unprecedented; and P/E ratios rose to unusually high levels (Graph 2). It is interesting to note that the most rapid growth in share prices, from 1997 to early 2000, occurred during a period in which corporate profits (as measured by the National Accounts) were essentially flat (Graph 3).
Because of the growing perception that share market valuations had reached unusually high levels, share prices have become very sensitive to any signs of bad news on economic growth or corporate profits. Recent events casting doubt about the accuracy of corporate accounts in the US have had a particularly strong effect. In his recent Congressional testimony, Federal Reserve Chairman Greenspan drew attention to ‘the influence of growing concerns about corporate governance and business transparency problems that evidently accumulated during the earlier rapid run-up in these markets.’
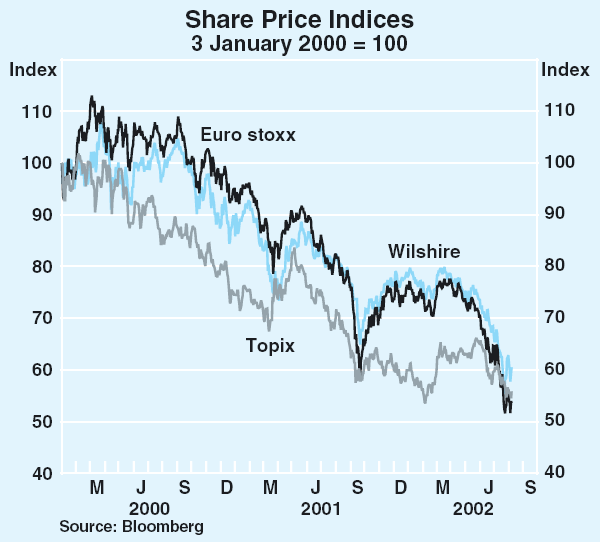
Equity markets have also weakened considerably across Europe (Graph 4). The Euro STOXX index fell by 27 per cent over the past three months, with the UK's FTSE index down by 21 per cent over the same period; these falls were larger than those seen in US markets. The STOXX index is now at its lowest level since October 1998, while the FTSE has fallen to its lowest level since January 1997 (Table 1). European equities have been affected by similar factors to those at work in the US.
| Change since 2000 peak |
Change over 2001 |
Change in 2002 |
|
|---|---|---|---|
| United States | |||
| – Wilshire | −44 | −12 | −23 |
| – Dow Jones | −28 | −7 | −16 |
| – S&P 500 | −43 | −13 | −24 |
| – NASDAQ | −75 | −21 | −34 |
| Euro Area | |||
| – STOXX | −53 | −20 | −30 |
| United Kingdom | |||
| – FTSE | −41 | −16 | −22 |
| Japan | |||
| – TOPIX | −45 | −20 | −7 |
| Canada | |||
| – TSE 300 | −43 | −14 | −16 |
The Japanese stock market also succumbed to the broader weakness, although the recent falls have not been as large as seen in the US and Europe. The Topix has fallen around 11 per cent over the past three months, but remains 4 per cent above the 17-year low reached in February.
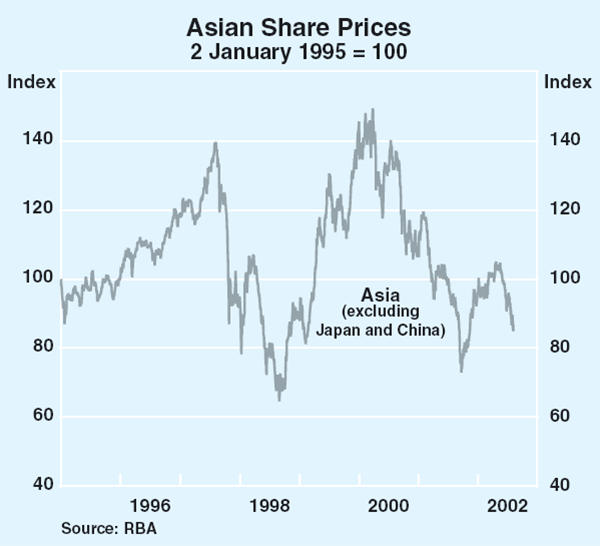
Asian emerging equity markets have also declined by less than in the US and Europe over the past three months. Asian stocks fell around 15 per cent on average, with equity markets in the region appearing less overvalued than elsewhere and earnings growth expected to be stronger due to relatively healthy domestic economies (Graph 5). The declines in Latin America, however, were somewhat larger, at around 22 per cent.
Short-term interest rates
The outlook for policy interest rates in the major economies has changed significantly over the past few months, as the recent sharp falls in equity prices have created uncertainty about the pace of global economic recovery in the major countries.
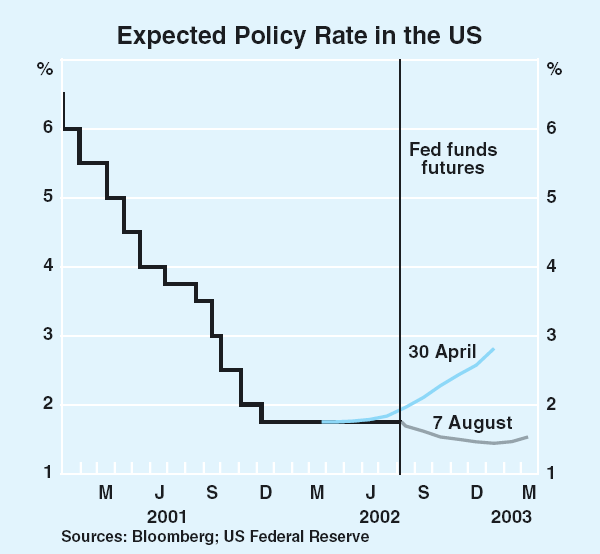
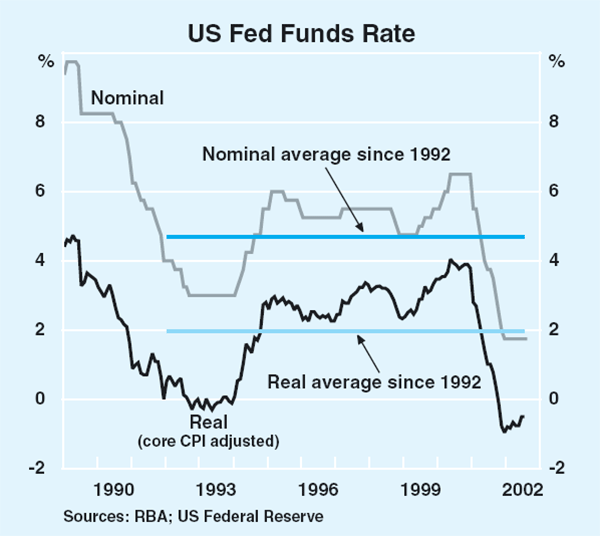
In the US, strong economic growth in the March quarter had prompted financial markets to expect a relatively quick tightening path over 2002 from the current low levels (Graph 6). By the end of March, the Federal Funds futures market was implying that the first 25 basis point increase would occur in May 2002, with a cumulative increase of 175 basis points, to 3.50 per cent, expected by the end of the year. However, growing uncertainty about the strength of the economic outlook in the face of lower equity prices and weaker-than-expected US growth in the June quarter has since seen expectations for the first increase pushed well into 2003 (Graph 7). Indeed, the talk of a possible ‘double dip’ in US economic activity has led the Federal Funds market to price-in a significant probability of a cut in US policy rates before the end of 2002.
Expectations for interest rate increases in Europe have also been pushed back significantly, with the European Central Bank and the Bank of England now not expected to begin the process of monetary tightening until early 2003. A few months ago market expectations had been that the first increases would have occurred by now.
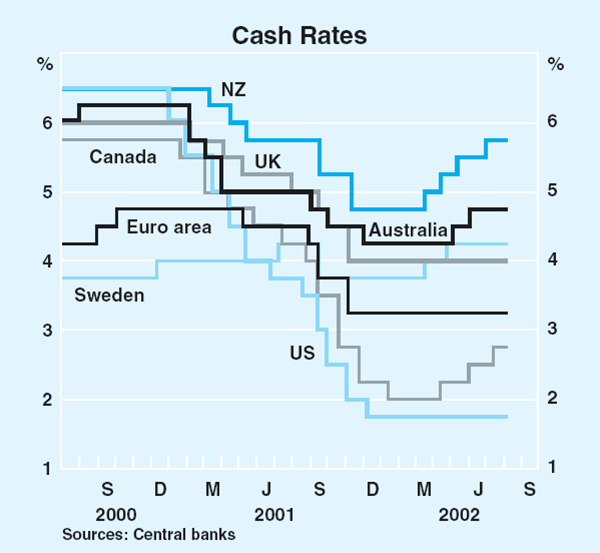
While the major central banks are now not expected to tighten policy this year, central banks in several of the smaller industrial economies (where demand is stronger and the outlook for inflation is regarded as less benign) have tightened policy over the past three months (Graph 8). In addition to Australia (see chapter on ‘Domestic Financial Markets’), the Bank of Canada has increased rates by a cumulative 75 basis points to 2.75 per cent this year, the Reserve Bank of New Zealand by a cumulative 100 basis points to 5.75 per cent, and Norway's central bank increased rates in July by 50 basis points to 7 per cent (Table 2). The Swiss National Bank, on the other hand, cut policy rates in July because of concerns that the strong Swiss franc would hinder prospects for the recovery in economic growth.
| Changes in policy rates in 2002 |
Current level Per cent |
|
|---|---|---|
| US | – | 1.75 |
| Canada | 75 | 2.75 |
| UK | – | 4.00 |
| Australia | 50 | 4.75 |
| NZ | 100 | 5.75 |
| Euro area | – | 3.25 |
| Sweden | 50 | 4.25 |
| Norway | 50 | 7.00 |
| Japan | – | 0.00 |
| Switzerland | −100 | 0.75 |
The Bank of Japan has maintained its current policy stance over the past three months, with the reserves target remaining at ¥10–15 trillion, consistent with the BoJ's commitment to continue quantitative easing until prices are no longer declining in annual terms.
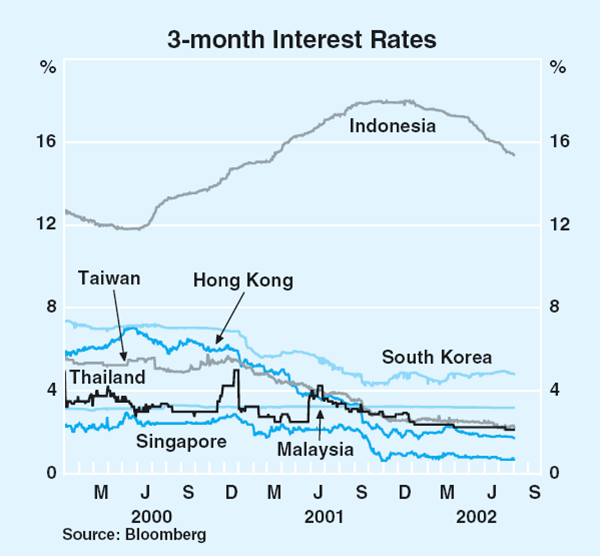
In general, short-term interest rates in Asian emerging markets have drifted lower over the past three months (Graph 9). The Bank of Indonesia cut official rates by a total of 150 basis points to 13.6 per cent, reflecting slowing inflation and continued strength in the rupiah, while the Bank of Taiwan eased by 25 basis points to 1.9 per cent. In contrast, the Bank of Korea increased rates by 25 basis points to 4.25 per cent in May, citing increased concerns about inflation.
In Latin America, short-term rates have risen in several countries, with ongoing turmoil in Argentina, and increasing exchange rate pressures in Brazil and Uruguay.
Long-term interest rates
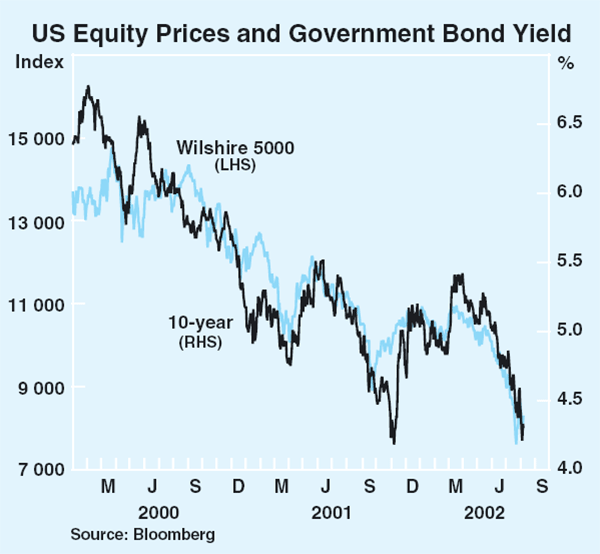
Long-term government bond yields in the major economies have fallen significantly over recent months (Graph 10). Yields on US 10-year government debt have declined by around 80 basis points since the end of April to 4.3 per cent, close to levels seen only twice since the 1960s (at the time of the Long-Term Capital Management crisis in 1998 and in the weeks following September 11 last year). The falls were driven by concerns about the economic outlook in the face of the sharp decline in share prices, as well as safe-haven demand in the wake of governance issues in US companies. There has been a very strong correlation between US share prices and US bond yields over the past few years (Graph 11).
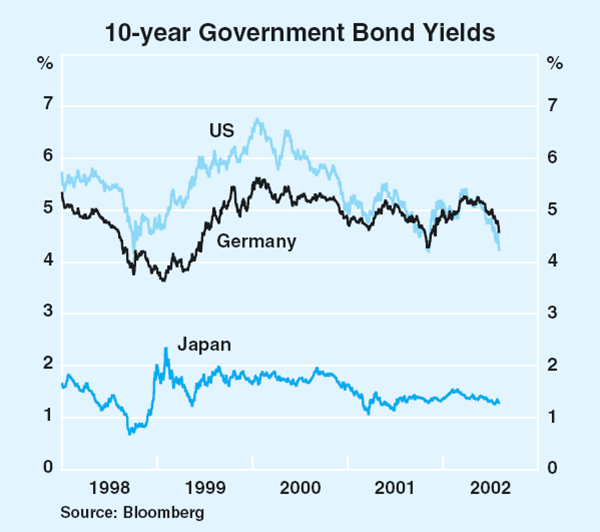
Stock market weakness and concerns over the economic outlook have also contributed to falls in European bond yields over the past three months. Yields on 10-year government bonds fell by around 60 basis points in Germany, France and the UK, to levels around 4.6 per cent.
Yields on Japanese government bonds also fell, declining by around 10 basis points to below 1.3 per cent. The decline in yields appeared to mainly reflect concerns about the outlook for the global economy, with little impact from expectations of further bond issuance beyond the government's self-imposed ¥30 trillion cap. The long-expected downgrade of Japan's credit rating by Moody's (by two notches to A2) had little impact on yields.
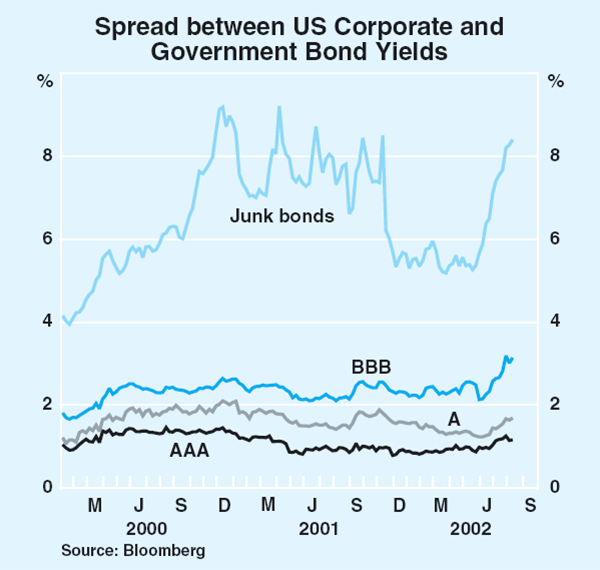
The increasing risk aversion that has been reflected in declines in global equity markets has also contributed to significant increases in the yield spreads on lower-rated bonds. The spread between low-rated US corporate ‘junk’ bonds and 10-year Treasuries increased by around 300 basis points, which took it back to the high levels seen during the recession last year. The spread between BBB-rated corporate bonds and Treasuries increased by 60 basis points to its highest level since the early 1980s (Graph 12).
Emerging market yield spreads have also widened over the past three months (Graph 13). Yield spreads on Asian emerging market sovereigns were the least affected, with average spreads widening by less than 100 basis points, in part reflecting perceptions of improving creditworthiness in the region. Indeed, both Standard & Poor's and Fitch have upgraded Korea's credit rating in recent months, following Moody's earlier upgrade. In contrast, European emerging market spreads have widened on average by around 150 basis points in recent months.
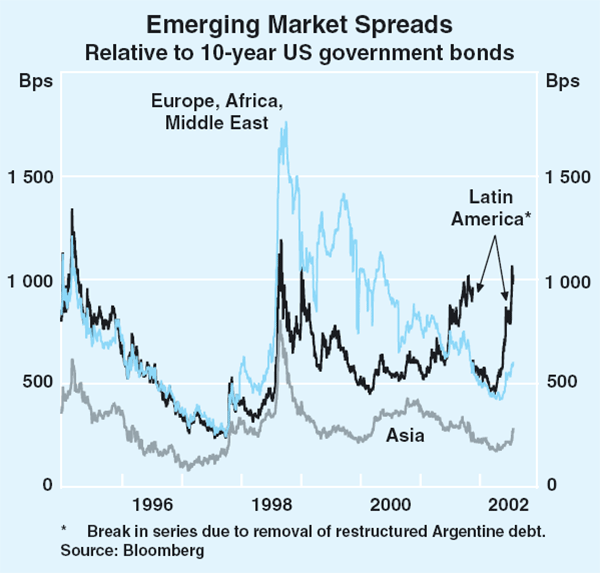
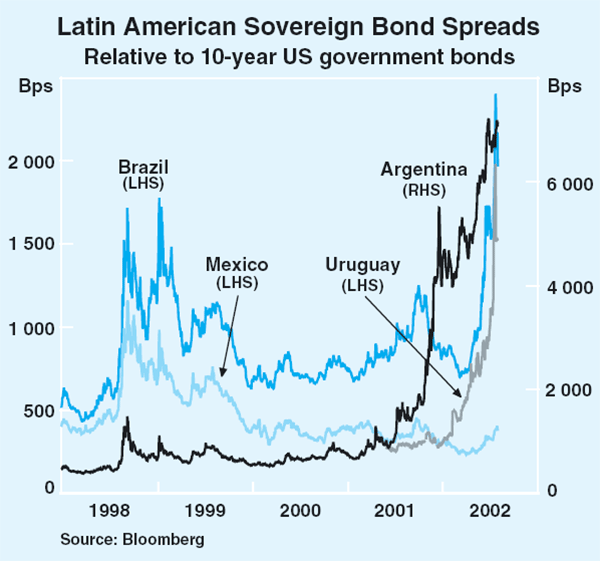
The largest increases in emerging market spreads were seen in Latin America, where the average spread widened by a further 500 basis points (Graph 14). Argentina, Brazil and Uruguay were most affected, with increases in spreads of about 2,100 basis points, 1,100 basis points, and 800 basis points, respectively. In Argentina, there are still no signs of a package of measures to stabilise the economy following the abandonment of the currency board in January and the subsequent sharp depreciation of the peso. In Brazil, the increase in spreads has largely reflected uncertainty over the upcoming presidential elections and the related possibility of changes to the strong economic policies seen in recent years. The problems in Uruguay are largely the result of contagion from the crisis in Argentina, which has weakened the Uruguayan economy and financial system, forcing the authorities to freeze some bank deposits following the sharp depreciation of the Uruguayan currency. Uruguay was previously one of the few Latin American countries to carry an investment-grade credit rating but has been downgraded by all three major agencies in recent months. Spreads on both Brazilian and Uruguayan debt narrowed, however, in early August following the announcement of fresh financial support packages from the IMF.
Exchange rates
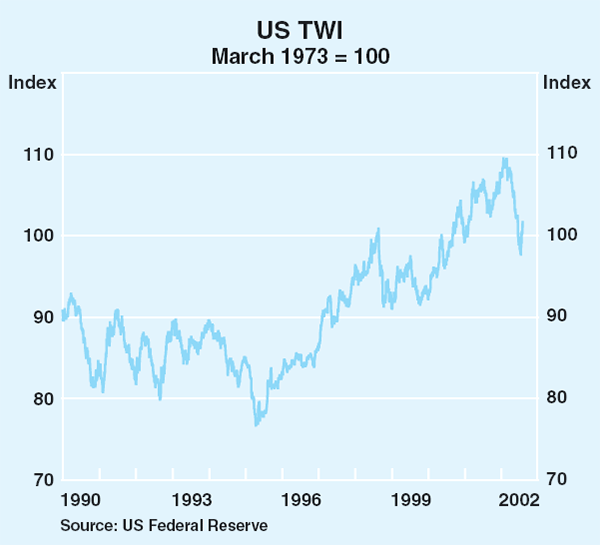
Sentiment towards the US dollar deteriorated further over the past three months, with the trade-weighted value of the currency falling to levels that are about 8 per cent below the peak in January earlier this year (Graph 15). Equity market weakness, the reassessment of the strength of the US economy, fears of terrorism, and concerns over corporate profitability and accounting irregularities all contributed to the weakness in the US dollar. The recent fall is significant, but it reverses only part of the very strong rise that had taken place in earlier years. In trade-weighted terms, the US currency still remains nearly 20 per cent above its average level in the first half of the 1990s.
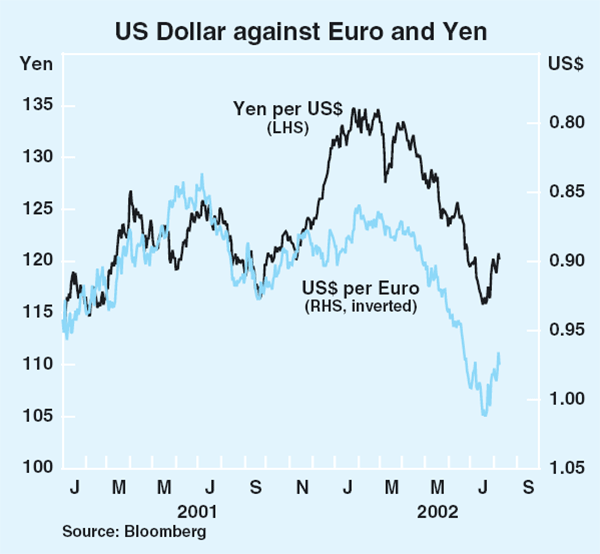
The decline in the US dollar over the past three months was relatively broad-based, with the currency falling by 8 per cent against the euro and Swiss franc, 7 per cent against the yen, and 5 per cent against the pound sterling (Graph 16). The euro returned to parity against the US dollar for the first time since February 2000, although it has subsequently slipped back below. The fall against the yen prompted significant intervention by the Japanese authorities during the past three months in an effort to slow the currency's rise against the US dollar.
Most Asian currencies also strengthened against the US dollar over the past three months. In contrast, Latin American currencies were mostly down on economic and political uncertainty in the region. The Argentinean peso continued to depreciate, and has lost three-quarters of its value since the peg with the US dollar was abandoned in January 2002 (Graph 17), while the Brazilian real fell by more than 30 per cent against the US dollar on uncertainty about the forthcoming election, before recovering somewhat on news of IMF assistance. In Uruguay, the effects of the Argentine crisis on domestic financial stability forced the authorities to float the Uruguayan peso on 20 June, and the currency has fallen 25 per cent from its earlier level.
Australian dollar
Weakness in the Australian dollar in June and July saw a reversal of most of the appreciation that had taken place in the first five months of 2002 (Graph 18). For the year to date, the currency is broadly unchanged in trade-weighted terms, though it is up around 5 per cent against a weakening US dollar.
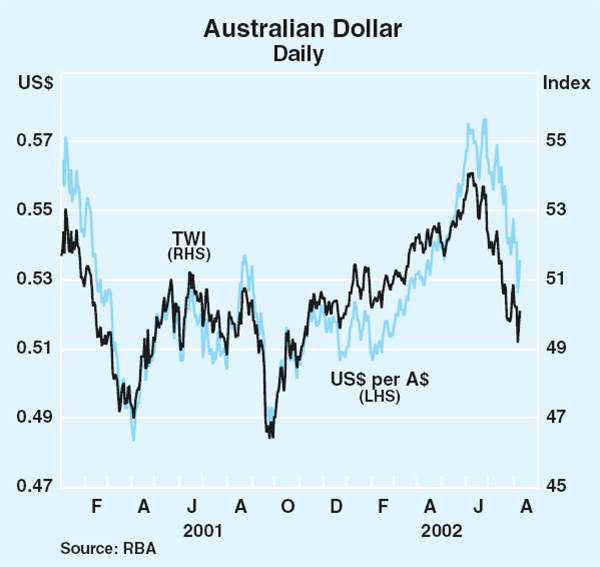
The fortunes of the Australian dollar in 2002 have apparently been very closely tied to market expectations for the global economy. Through the first five months of the year, many investors bought Australian dollars in anticipation of global economic recovery. Other currencies seen by markets as sensitive to the state of the world economy also strengthened during this period. The Australian dollar was one of the most favoured, however, because the domestic economy was already doing well, the share market had remained robust, and interest rates were both higher and expected to increase more than those in the major countries.
Buying of Australian dollars during this period was widespread. As the rise progressed, some of the more speculative short-term traders joined what they perceived to be an upward trend. Substantial long positions in Australian dollar futures contracts on the International Money Market in Chicago were built up during this period. There were also reports that Australian funds managers were hedging some of their offshore investments in bonds and equities.
In the event, the Australian dollar appreciated to about US57.5 cents in early June, about 13 per cent higher than its level at the start of 2002. The rise in trade-weighted terms was less, as part of this rise against the US dollar was a reflection of US dollar weakness, and so the Australian dollar was rising less against other major currencies (Graph 19). Nonetheless, the trade-weighted index rose to 54.1, or around 8 per cent above its level at the start of the year.
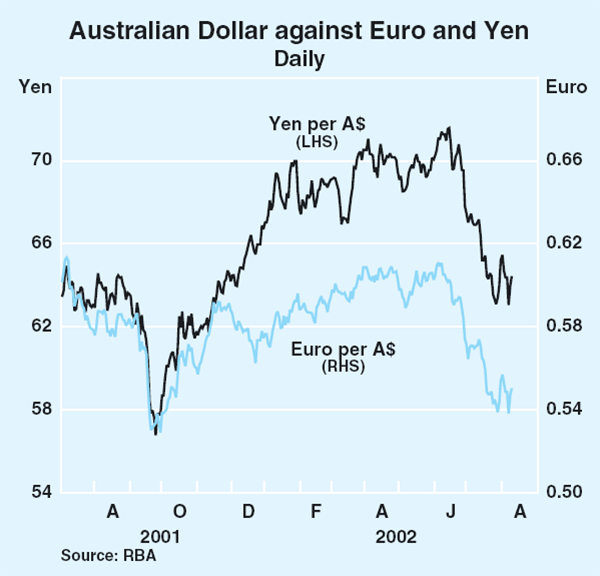
The questioning of the global growth outlook that has followed the recent falls in share prices has resulted in a substantial part of these long positions in Australian dollars being reversed. The currency has fallen to around US53.6 cents and 50.1 in trade-weighted terms. The Canadian and New Zealand dollars also experienced substantial corrections during this period. Domestic events in Australia seemed to have had little bearing on the recent falls; data on the Australian economy have remained robust and the share market has continued to outperform those overseas.
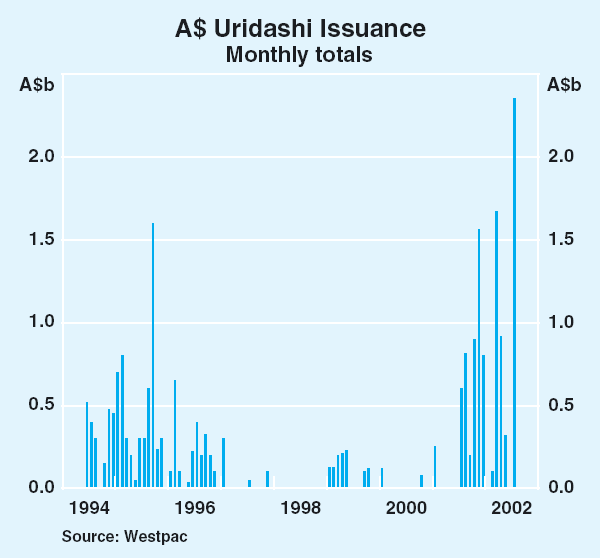
One source of overseas demand for the Australian dollar that has remained strong through this period was the Japanese household sector. Issuance of A$ Uridashi bonds (bonds sold directly to Japanese retail investors) was a record $2.4 billion in July (Graph 20). This followed issues of $3.1 billion in the first half of 2002.
The Bank's purchases of foreign reserves and earnings on reserves over the past three months have more than covered its sales of foreign currency to the Government. At the end of July, net reserves stood at $10.4 billion, compared with $7.7 billion at the end of April. Swaps outstanding are currently $28 billion, compared with $27 billion at the end of April.
International Economic Developments
In contrast to developments in financial markets, the global economy expanded moderately during the first half of 2002. In the US and much of non-Japan Asia this has been largely driven by gains in domestic demand, whereas in the euro area and Japan, a pick-up in exports has been the main source of growth. Consensus forecasts from early July suggest that growth in most of the G7 and other Asian countries was expected to be around trend over the remainder of 2002. The risks to the global recovery, however, have increased, as the large falls in stock markets across the world have raised uncertainty about the strength and durability of the recovery. Against this background and in the context of low inflation, policy settings in most countries have generally remained highly expansionary.
North America
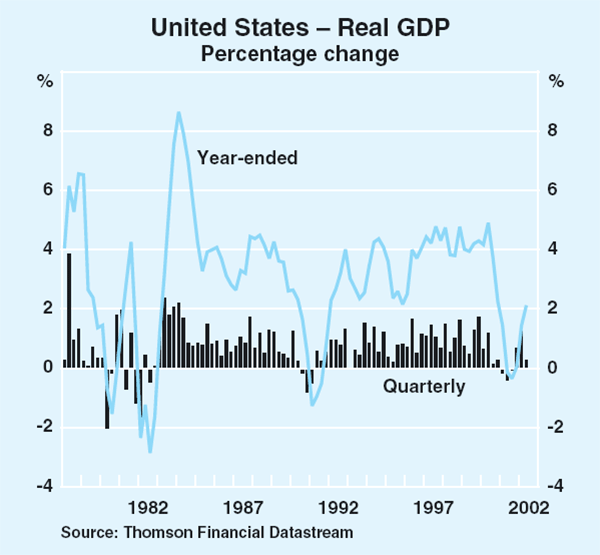
US GDP increased by 0.3 per cent in the June quarter, to be 2.1 per cent higher over the year (Graph 21). Revisions to the national accounts data indicate that GDP growth last year was significantly weaker than previously reported, with declines in GDP in the first three quarters of 2001, before recovering in the December quarter. As a result, the recession is now deeper than previously thought, though it remains shallower than that in the early 1990s. The recovery in output has been largely concentrated in higher consumption and investment spending by households and the public sector (Table 3). In contrast, business investment has fallen for seven quarters to be 12 per cent below its peak in the September quarter 2000. Inventories contributed to growth in the June quarter, with the level of stocks increasing for the first time in 18 months and the stock-to-sales ratio was at an historic low. While exports increased in the first half of 2002, import growth was considerably stronger over this period.
| March quarter 2002 |
June quarter 2002 |
Year to June 2002 |
|
|---|---|---|---|
| Private consumption | 0.8 | 0.5 | 3.1 |
| Residential investment | 3.4 | 1.2 | 3.8 |
| Business investment | −1.5 | −0.4 | −6.1 |
| Public demand | 1.4 | 0.4 | 4.1 |
| Inventories(a) | 0.8 | 0.3 | 0.6 |
| Net exports(a) | −0.2 | −0.5 | −0.9 |
| – Exports | 0.9 | 2.8 | −3.6 |
| – Imports | 2.1 | 5.4 | 2.9 |
| GDP | 1.2 | 0.3 | 2.1 |
|
(a) Contribution to GDP growth Source: Thomson Financial Datastream |
|||
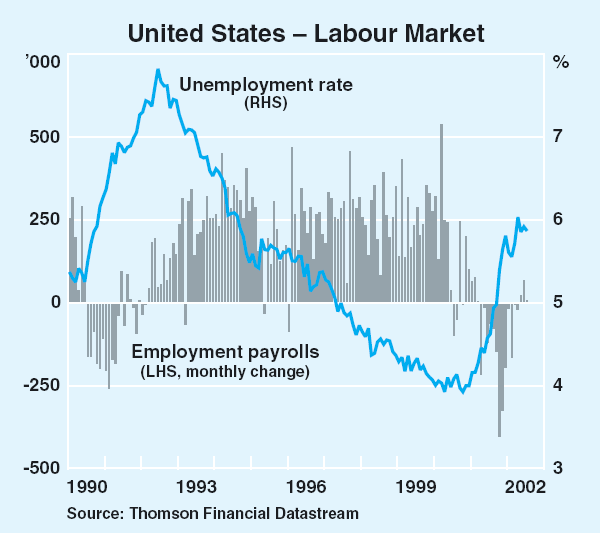
The softening in aggregate consumption growth in the June quarter reflected continued weakness in the labour market and the associated low growth in household incomes (Graph 22). The unemployment rate has been hovering at just under 6 per cent in recent months, 2 percentage points higher than its most recent trough in late 2000 (Graph 23). While there were small increases in employment in the past three months, employment is still 1.3 per cent below its peak in March 2001. The increase in employment so far has been concentrated in certain parts of the service sector (such as temporary help supply, health, education and local government), while reductions in employment have continued in the manufacturing sector, and employment in the retail sector has also declined more recently.
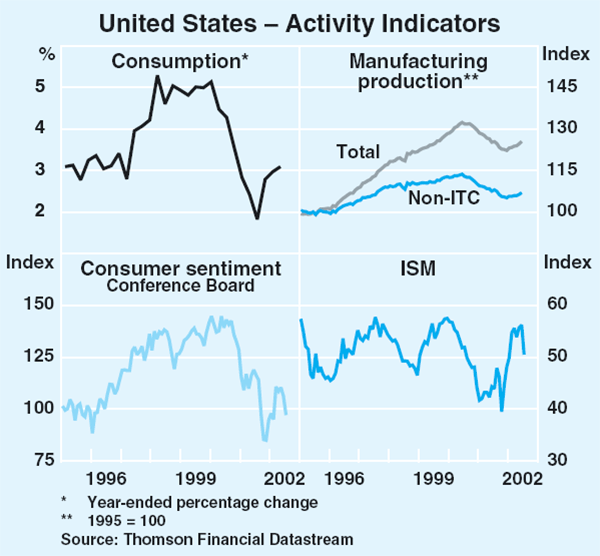
Despite the uncertainty from the falling stock market and corporate accounting issues that have dominated financial markets in the US, activity in the business sector has continued to improve in recent months; manufacturing production and capital imports are both well above levels reached at the end of 2001, and despite falling sharply in July, the ISM measure of manufacturers' sentiment is higher than levels at the beginning of the year. In line with these more positive indicators of business activity, there was a slight rise in the equipment component of business investment in the June quarter – the first rise in 18 months. However, overall business investment declined, driven by another large fall in investment in structures.
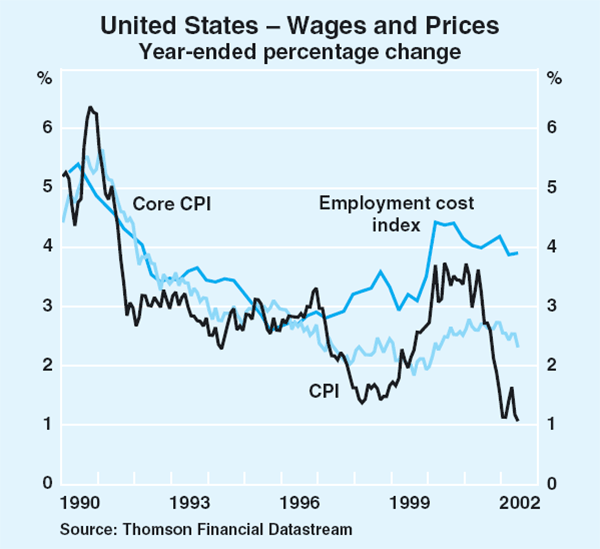
Consumer price inflation was 1.1 per cent over the year to June and, excluding food and energy, the core measure of inflation slowed to 2.3 per cent (Graph 24). The divergence between goods and services inflation remains marked, with core goods prices falling by around 1 per cent over the year and services prices increasing by 3.7 per cent. The national accounts measure of core inflation was 1.6 per cent over the year to the June quarter. Consistent with the weaker labour market, wage outcomes have continued to drift lower over the past twelve months, with the wages component of the employment cost index around 3½ per cent higher over the year to June. Producer price inflation has remained low, and unit labour cost growth has remained subdued as productivity has risen rapidly.
Policy settings in the US remain expansionary. Interest rates are at historically low levels while tax cuts and discretionary increases in government outlays introduced over the past year have also been stimulatory. These fiscal measures, combined with the effects of slower growth, have led to a projected change in this year's budget balance of around 2¾ per cent of GDP.
Conditions in Canada have strengthened since the beginning of the year, as growth in employment has increased, and robust activity has continued in the manufacturing and housing sectors. In response to the stronger-than-anticipated recovery and inflationary pressures, the Bank of Canada raised official interest rates by 50 basis points, to 2.75 per cent, in recent months.
Asia
Japan
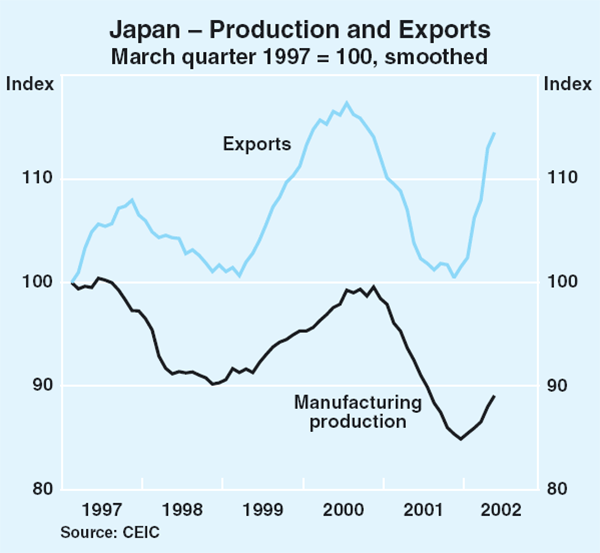
For the first time in nearly a year, the Japanese economy recorded strong GDP growth, increasing by 1.4 per cent in the March quarter, but output remains 1.6 per cent lower over the year (Table 4). Much of the pick-up in the March quarter was externally driven, with a sharp rise in exports providing half the growth in the quarter. The increase in output recorded in the March quarter probably overstates the turnaround in the economy, but there are a few signs that things may be improving.
| December quarter 2001 |
March quarter 2002 |
Year to March 2002 |
|
|---|---|---|---|
| Private consumption | 1.9 | 1.6 | 0.7 |
| Residential investment | −0.2 | −2.3 | −7.8 |
| Business investment | −12.0 | −3.2 | −11.2 |
| Public demand | −0.4 | 2.0 | −0.1 |
| Change in inventories(a) | 0.0 | 0.0 | −0.1 |
| Net exports(a) | −0.1 | 0.7 | 0.3 |
| – Exports | −2.6 | 6.4 | −4.3 |
| – Imports | −2.0 | 0.0 | −8.6 |
| GDP | −1.2 | 1.4 | −1.6 |
|
(a) Contribution to GDP growth Source: Thomson Financial Datastream |
|||
These signs are most evident in the business sector. The Tankan survey suggests that business conditions, especially in manufacturing, improved substantially in the June quarter. The growth in exports has supported the manufacturing sector (Graph 25), and while ITC production has grown most rapidly, production of other goods has also risen in recent months. Nonetheless, business investment fell again in the March quarter, and investment intentions as measured by the Tankan survey remain soft.
While the national accounts measure of private consumption rose strongly in the March quarter, prospects for consumption are less promising, as conditions in the labour market have continued to deteriorate. Total employment fell by just over 1 per cent over the first half of 2002, and the unemployment rate has remained at around its historical high at 5½ per cent. Deflation appears to have moderated, as a pick-up in goods prices has reduced the annual deflation rate to 0.7 per cent over the year to June.
Non-Japan Asia
Economic growth in the region continued to improve, with output rising robustly for a second consecutive quarter in the March quarter (Table 5). Growth was bolstered in many countries by a recovery in domestic demand, reflecting stronger household consumption and a revival in investment spending. External demand also continued to pick up, in particular for ITC products. Overall, exports from non-Japan Asia rose by 10 per cent in the March quarter, though they remained 4¼ per cent lower than a year ago. The pick-up in output was particularly pronounced in Korea, which along with China, continues to exhibit stronger economic outcomes than elsewhere.
| GDP growth | Inflation | |||
|---|---|---|---|---|
| Year to September 2001 | Year to latest | Year to latest | ||
| China | 7.0 | 8.0 | −0.8 | |
| Hong Kong | −0.2 | −0.4 | −3.4 | |
| Indonesia | 3.1 | 2.5 | 10.0 | |
| Korea | 1.5 | 5.0 | 2.1 | |
| Malaysia | −0.9 | 1.0 | 2.1 | |
| Philippines | 3.0 | 3.7 | 2.6 | |
| Singapore | −5.4 | 3.2 | 0.1 | |
| Taiwan | −4.2 | 0.9 | 0.4 | |
| Thailand | 1.6 | 3.8 | 0.1 | |
| Total(a) | −0.4 | 2.4 | – | |
| (a) GDP-weighted, excluding China | ||||
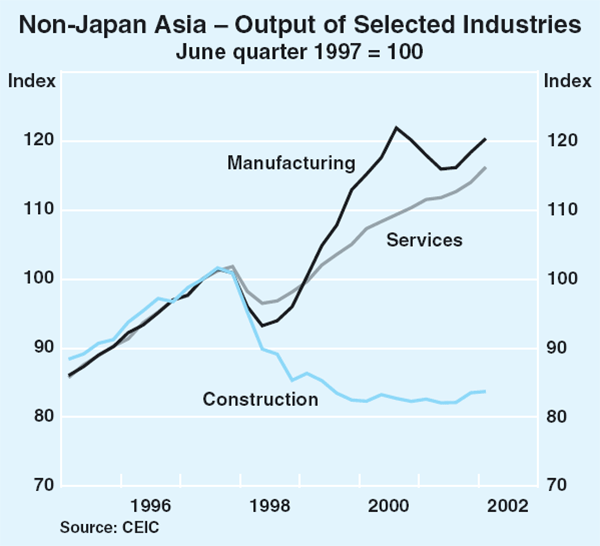
In line with the more balanced mix of external and domestic growth, aggregate output from the manufacturing and services industries recorded strong growth into 2002, but the construction industry continues to languish (Graph 26). In recent months industrial production has continued to rise in most countries to a level around the peak in the second half of 2000.
Labour markets have improved across the region in recent months, especially for the major ITC producing countries. The Korean labour market continues to outperform the rest of the region, with employment growing rapidly and the unemployment rate currently at 3 per cent, but in Hong Kong the unemployment rate has risen during the past 1½ years and is now 1¼ percentage points higher than its previous peak experienced in early 1999. Consumer price inflation has fallen in most countries as local currencies have appreciated against the US dollar and oil prices have moderated in recent months. China and Hong Kong continue to experience deflation in year-ended terms.
New Zealand
The New Zealand economy grew by 1.1 per cent in the March quarter, and by 4.0 per cent over the past year. Exports continued to make a contribution to growth, though less so than in previous quarters. With inflation remaining towards the top of the target range, the Reserve Bank of New Zealand increased the official cash rate a further 50 basis points in recent months to 5.75 per cent.
Europe
Conditions in the euro area improved in the first half of 2002, with output in the March quarter returning to positive growth, although at a tepid pace. A strong contribution from the external sector more than offset continued weakness in domestic demand. After increasing in the early part of the year, the improvement in euro area industrial production has paused in recent months (Graph 27), with particularly weak outcomes in Germany and Italy, though this was due partly to industrial disruptions. Similarly, there has also been a pause in the upward trend in business sentiment.
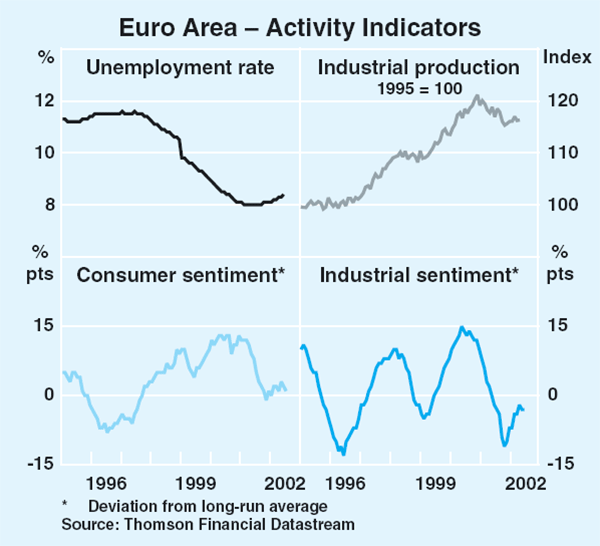
Despite the earlier economic slowdown and the soft-paced recovery, the labour market has remained relatively resilient, with the unemployment rate in the June quarter only 0.3 percentage points above its recent trough. Growth in household consumption, however, has been weak, particularly in Germany where employment has declined since the June quarter last year. Consumer sentiment has picked up from its cyclical trough, but remains well below levels reached in recent years.
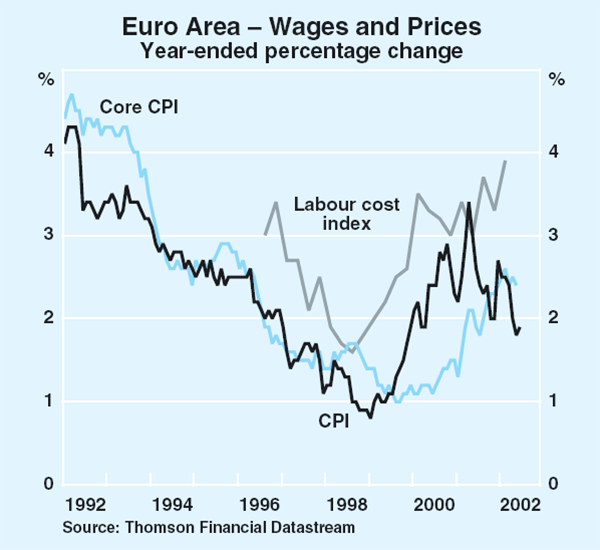
Euro area inflation has slowed in recent months to a year-ended rate of 1.9 per cent in July (Graph 28), partly reflecting the unwinding of past increases in food and oil prices. Year-ended core inflation (which excludes food and energy) remains around 2½ per cent, having crept up over the last two years. While services inflation has picked up to around 3¼ per cent, core goods inflation is currently 1½ per cent. The pick-up in core inflation over recent years has coincided with an acceleration in labour costs, and the outcomes in German wage negotiations this year suggest further upward pressure. However, the recent appreciation of the euro is likely to provide some offsetting disinflationary effect through lower import prices. Fiscal policy in some countries has limited room for manoeuvre, as current budget positions are close to, or above the constraints set by the Stability and Growth Pact. The overall impact of fiscal policy across the region in 2002 is broadly neutral.
In the United Kingdom, GDP picked up strongly in the June quarter, increasing by 0.9 per cent after barely rising in the two previous quarters. The manufacturing sector has weakened further in the June quarter, but the services sector continued to pick up, consistent with continued strength in household spending. Retail sales remain nearly 6 per cent higher over the year, buoyed by rapid growth in house prices and a low interest rate environment which has encouraged consumers to withdraw equity from their homes. While the unemployment rate has remained at historically low levels, inflation (excluding mortgage payments) has slowed to around 1½ per cent in year-ended terms. The fiscal stance this year is expansionary, with the change in the budget position equivalent to around 1 percentage point of GDP, and a further, albeit milder, expansion is projected for next year.
Domestic Economic Activity
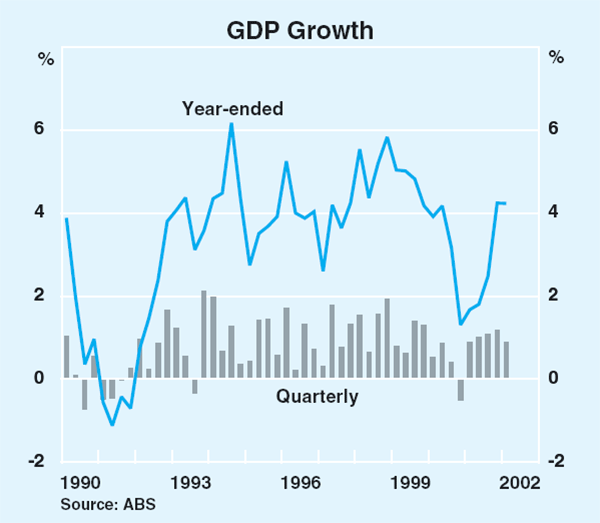
The Australian economy has continued to grow at a healthy pace over the past year. According to the latest national accounts, real GDP expanded by 4.2 per cent over the year to the March quarter, the fifth consecutive quarterly advance of around 1 per cent (Graph 29). Domestic demand has accounted for all of the growth over this period, whereas the external sector has been adversely affected by the downturn in the global economy in 2001 (Table 6).
| March quarter 2002 |
Year-ended March quarter 2002 |
|
|---|---|---|
| Private final demand(a) | 1.4 | 5.7 |
| Consumption | 1.4 | 4.0 |
| Dwelling investment | 4.3 | 27.8 |
| Business investment(a) | −0.8 | 3.5 |
| Public final demand(a) | −2.6 | 0.6 |
| Domestic final demand | 0.4 | 4.5 |
| Change in inventories(b) | 0.5 | 0.8 |
| Exports | 4.0 | 0.1 |
| Imports | 2.2 | 3.8 |
| Net exports(b) | 0.3 | −0.8 |
| Gross domestic product | 0.9 | 4.2 |
|
(a) Excluding the effect of transfers between the public and private sectors
Source: ABS |
||
The outlook for the domestic economy continues to be positive, although the composition of growth is likely to alter with a decline in dwelling investment in prospect later in the year. Growth in consumption spending should remain firm, buoyed by ongoing employment growth and associated increases in household incomes, as well as a high level of consumer confidence. While the recent volatility in equity markets may cause some businesses to reconsider their investment plans, conditions generally remain conducive to the pick-up in investment projected by the business surveys. Business confidence is at levels normally associated with a strongly growing economy, additions to the capital stock have been relatively small over the past few years, corporate profitability remains high and the cost of business finance is relatively low.
Household consumption
Household consumption spending has grown strongly over the past year, with retail sales volumes increasing by 2½ per cent in the June quarter and by 6¼ per cent over the year (Table 7). The pick-up in growth over the year was particularly noticeable in spending on goods. In part, this has reflected the upward phase of the housing cycle, which has increased demand for household furnishings and other goods. Sales of motor vehicles to households, which are not included in the retail trade survey, have also increased strongly in the first half of 2002, to be 7 per cent higher than in the corresponding period last year. Growth in spending on services, which has tended to grow faster than expenditure on goods over the past decade, has slowed, owing mainly to ongoing weakness in travel-related spending.
| June quarter 2001 | June quarter 2002 | |
|---|---|---|
| Food | 1.1 | 3.4 |
| Department stores | −9.1 | 7.0 |
| Clothing and soft goods | −6.0 | 5.9 |
| Household goods | 0.5 | 17.3 |
| Recreational goods | −4.5 | 6.6 |
| Hospitality and services | 4.1 | 4.0 |
| Other | 8.8 | 7.5 |
| Total | 0.6 | 6.3 |
|
Source: ABS |
||
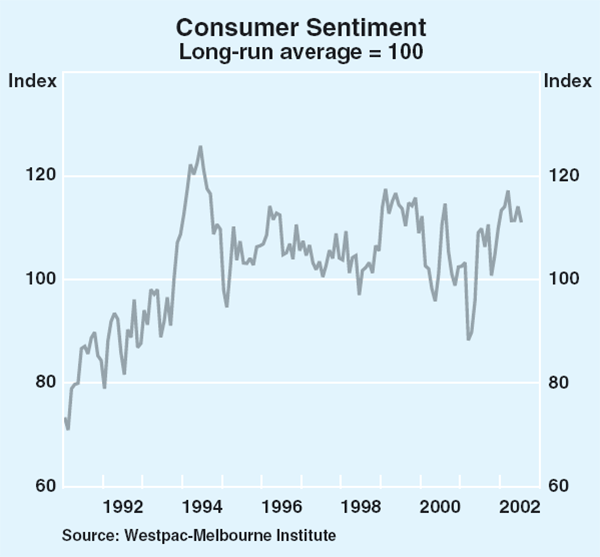
A number of factors remain broadly supportive of growth in consumption. Consumer sentiment, as reported by the Westpac-Melbourne Institute, remains at a high level (Graph 30). There should be only a modest drag on household spending power from increases in petrol prices – after rising earlier in the year, petrol prices have been fairly steady over the past few months. Household disposable income is likely to be supported in the period ahead by ongoing growth in employment and wages.
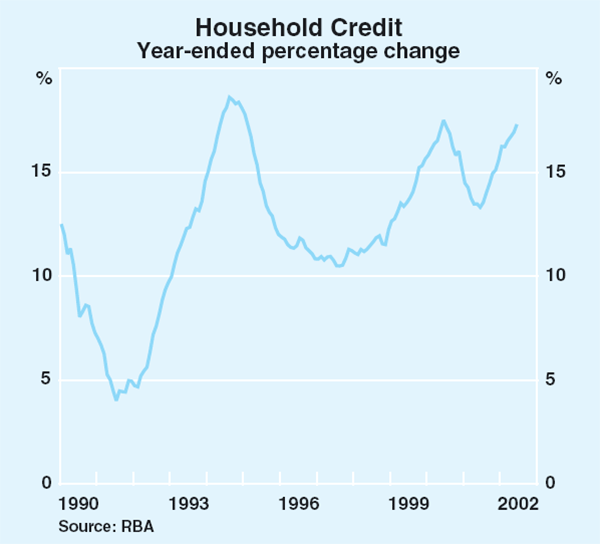
Growth in consumption has continued to be supported by borrowing by the household sector (Graph 31). Over the year to June, credit extended to the household sector rose by around 17 per cent, compared with a rise of 13 per cent over the previous year. While much of this borrowing relates to the recovery in dwelling investment, it seems likely that some of the funds borrowed against housing are being used to fund consumption. An ABS housing survey reported that in 1999, more than 30 per cent of home owners with a mortgage used some of the funds for purposes other than housing.
Rising house prices have also facilitated equity withdrawal through products such as home-equity loans. In addition, borrowers can access equity through redraw facilities, by borrowing more than is required to cover the cost of a new dwelling, or by refinancing existing loans and increasing the principal outstanding. The value of approvals for refinancing home loans to owner-occupiers with another lender has increased at an annual rate of 29 per cent over the past two years. Much of the refinancing activity is likely to reflect the desire to obtain preferable loan conditions or to consolidate loans, but obtaining some funding for consumption is also common. According to the ABS housing survey, around 20 per cent of borrowers refinancing home loans over the period 1997–99 used some of the proceeds to fund purchases such as cars and holidays. (For a discussion of related issues see Box A: Developments in Household Balance Sheets.)
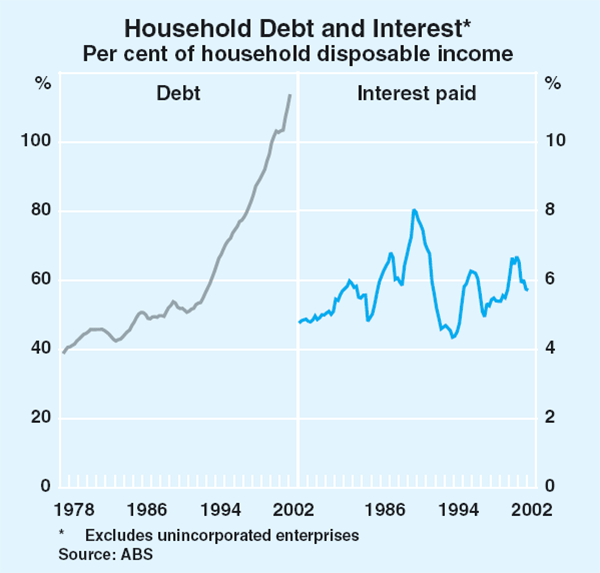
With growth in household debt outpacing that of disposable income, the debt-to-income ratio has continued to rise, but debt servicing was little changed in the March quarter at around 5¾ per cent of disposable income (Graph 32). The cumulative 50 basis point tightening in monetary policy in the June quarter will affect cash flows of a number of households in the months ahead. The main direct effect will be via higher interest charges for households with variable-rate home loans (around one-quarter of households) and those paying off other types of variable-rate consumer debt. The effect of higher home loan interest rates will be absorbed to some extent by a number of households reducing the excess principal repayments they had been making over the past year or so by keeping their monthly payments constant as interest rates declined through 2001.
It is difficult to determine how the recent fall in global equity markets will affect consumer spending in Australia. At this stage the fall in equity wealth seems likely to be less of a drag on the household sector in Australia than in the United States or Europe, since the fall in Australian equity markets has been much smaller. The total gains in wealth in recent years have been very large and the ratio of wealth to income is at an historically high level, as the increase in house prices over the past year has more than offset the fall in share prices. Nonetheless, it is possible that increased volatility in share prices could adversely affect consumer sentiment and this could weaken consumer spending.
Housing
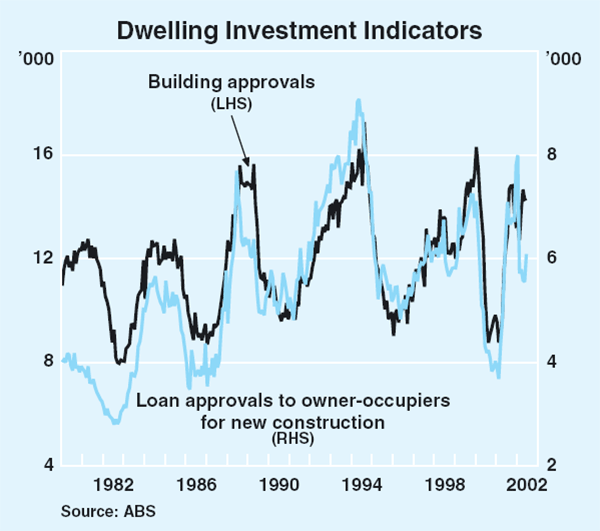
Conditions in the housing sector remain buoyant, though some leading indicators of dwelling activity presage a weakening in dwelling investment later in the year. Dwelling commencements declined in the March quarter, following sharp increases in the previous two quarters, while the number of loan approvals to owner-occupiers for new construction has fallen by 24 per cent from its January peak (Graph 33). Building approvals data, however, remain at a high level, suggesting that the downturn in the dwelling sector could occur later than previously expected. The number of building approvals for houses, after declining gradually over the early part of this year, rose again in June and was back around levels recorded in the second half of 2001, although approvals in May and June may have been boosted by first-home buyers obtaining approvals before the expiration of the Commonwealth Additional Grant (CAG) (Graph 34). Since a number of first-home buyers have brought forward decisions to build new dwellings as a result of the grant, their absence from the market in the future will amplify the expected downturn in the housing cycle; the cessation of the CAG, however, should have a much smaller effect on the dwelling cycle than the introduction of the GST, since the CAG affects only first-home buyers purchasing new homes. Furthermore, given extensions to both the required commencement and completion dates for recipients of the grant, there can be a significant lag between the approval of a grant and its effect on building activity.
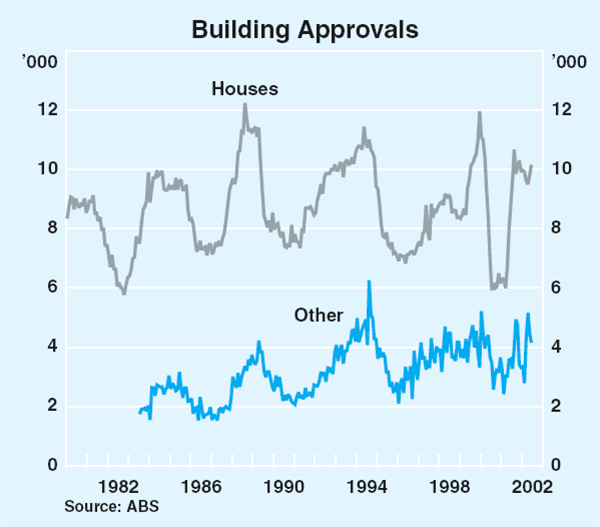
Building approvals for medium-density housing have been particularly strong, reaching a record high for this cycle in April. This accords with the strong rise in the value of investor loan approvals in recent months, particularly for new construction. (For a further discussion of housing see ‘Recent Developments in Housing: Prices, Finance and Investor Attitudes’ in the July 2002 Bulletin.)
The strong growth in house prices in recent years continued in the March quarter. According to both the Real Estate Institute of Australia (REIA) and the ABS, capital city house prices rose by around 4 per cent in the March quarter and by 17 per cent over the year to March (Table 8). The increases across capital cities over the past year have been relatively uniform, according to the REIA data, with all state capitals experiencing double-digit growth. Nonetheless, there is some evidence of excess supply in the housing market, particularly in the medium-density area. Residential property vacancy rates have moved higher in a number of capital cities over the past year.
| House prices (REIA) |
Rents(b) (ABS) |
|
|---|---|---|
| March quarter 2002 | ||
| Sydney | 16.3 | 2.7 |
| Melbourne | 18.5 | 3.0 |
| Brisbane | 22.9 | 2.3 |
| Adelaide | 18.5 | 2.9 |
| Perth | 10.5 | 2.0 |
| Hobart | 17.2 | 3.0 |
| Canberra | 15.4 | 6.1 |
| All capitals | 17.1(a) | 2.7 |
|
(a) Calculated by the RBA using the number of capital city households as
weights Sources: REIA; ABS |
||
The business sector
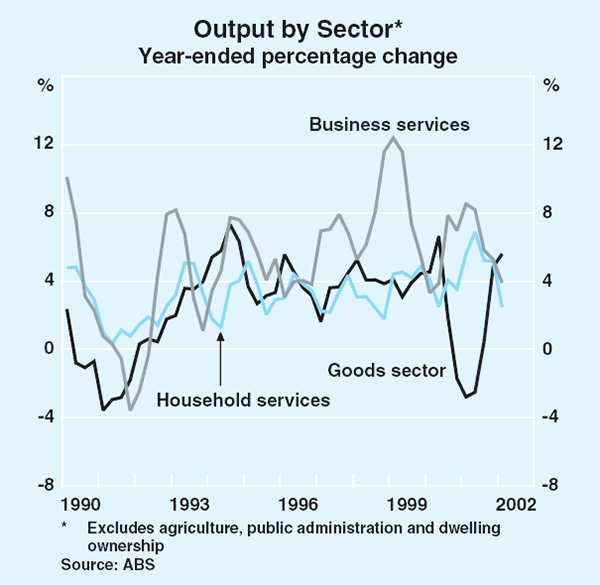
Businesses have, on average, experienced quite favourable conditions over the past year or so, although outcomes have varied across sectors (Graph 35). Growth in the goods production and distribution sectors has picked up, as evidenced by robust growth in the construction, manufacturing, wholesale and retail trade, and transport and storage industries. In contrast, growth in the services sectors has slowed markedly from its very high rate in 2000. Reduced discretionary spending by firms has affected demand for a range of business services, such as consulting, marketing and computing services. Growth in services supplied to households has also eased, largely reflecting subdued demand for tourism services and slower growth in the provision of health services, as the number of private health fund members has levelled out.
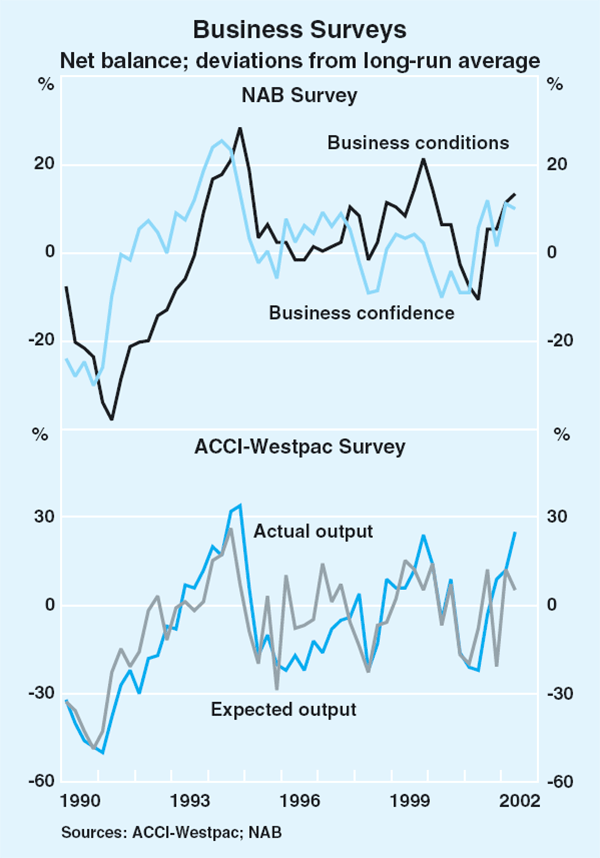
Indicators of business conditions generally improved in the June quarter, continuing the upward trend in evidence since the beginning of last year (Graph 36). According to the broad-based NAB quarterly business survey, business conditions were strongest in domestically oriented sectors, such as the retail, wholesale and construction sectors, while conditions in the sectors exposed to the international economy were somewhat weaker. The ACCI-Westpac survey also reported an improvement in business conditions for the manufacturing sector in the June quarter, consistent with the strength in housing investment and the pick-up in goods consumption; the new orders component of the survey also improved further, with the share of respondents nominating ‘insufficient new orders’ as a constraint on production falling to its lowest level in two years. Measures of business confidence in most business surveys remain at quite high levels, notwithstanding some decline in the June quarter.
The outlook for the farm sector, which is not covered by any of the major business surveys, has deteriorated in recent months, with a number of regions currently experiencing drier conditions than normal and some chance that these conditions will persist until at least the end of this year. The rainfall shortages in the past three months have been particularly acute in northern New South Wales, central and southern Queensland and in parts of the wheat belt in Western Australia. Rainfall in South Australia, Tasmania and parts of Victoria in this period has been closer to average levels. While the agriculture industry accounts for about 3 per cent of total output, the large swing in rural incomes that is normally associated with dry conditions can have a noticeable effect on economic growth, largely through lower rural exports, and also indirectly via the flow-on effects of weaker farm incomes to other sectors of the economy (for further details on rural exports see the chapter on ‘Balance of Payments’).
Corporate profits, as measured by gross operating surplus (GOS), rose by just over 4½ per cent in the March quarter to be nearly 9 per cent higher over the year (Graph 37). The increase over the past year reflects improvements in the profitability of domestically oriented industries. In contrast, mining profits edged a little lower over the period, reflecting falls in some metals prices, moderating export volumes and the appreciation of the Australian dollar, although the level of mining profits remains high by historical standards. The small-business sector has also benefited from strong domestic activity, particularly in retail sales and residential construction, with profits increasing by around 12 per cent over the year to the March quarter. More recently, business surveys have reported a generally favourable outlook for profits.
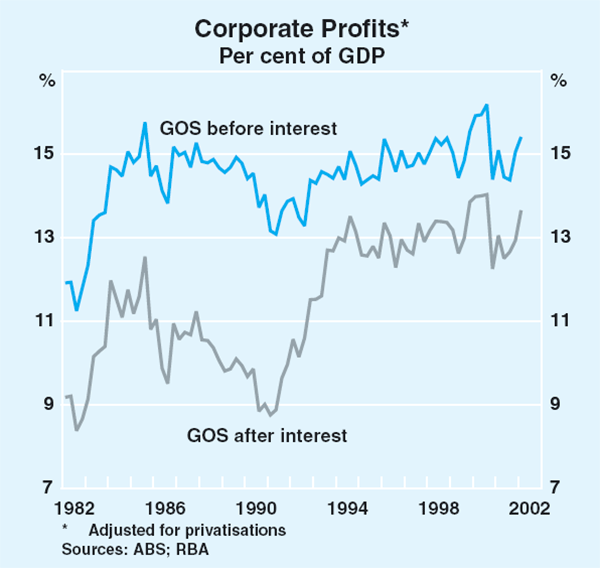
Firms also have ready access to funds, with external fundraising by businesses picking up in the first half of 2002 compared with the second half of 2001. The largest turnaround in external financing has been in business credit, which grew at an annualised rate of 6½ per cent over the six months to June, compared with an annualised decline of nearly 3 per cent over the previous six months. Growth in non-intermediated debt raisings has also been firm, mainly reflecting long-term bond issuance by a number of larger corporates. With share prices near historical highs in the early part of the year, equity raisings continued at a rapid pace, predominantly through institutional placements rather than new floats. These raisings may have slowed more recently, however, in line with weakness in the equity market.
The aggregate financial health of the corporate sector remains sound. Debt levels are quite low by historical standards. As a result of the very subdued growth in business credit towards the end of last year, and the low level of interest rates, the interest burden as a share of profits fell to around its lowest level in 30 years in the March quarter (Graph 38).
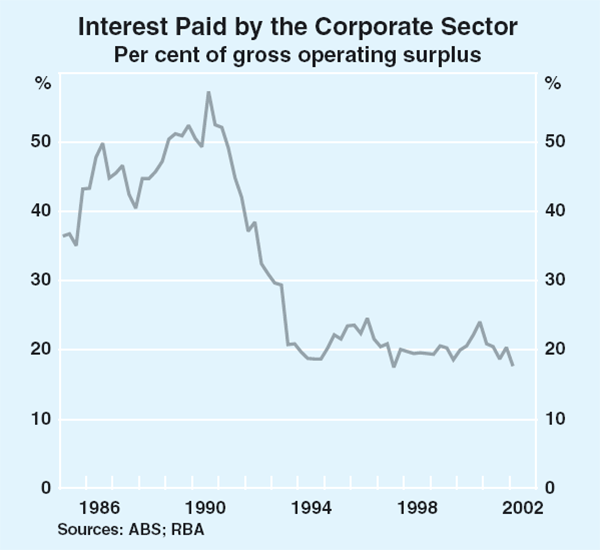
The high level of business confidence, continued strength in corporate profitability in the non-farm sector and easy access to low-cost funding are all contributing to a generally favourable investment climate. After reaching a trough around the middle of 2001, business investment has increased, with investment 7 per cent higher over the six months to the March quarter. However, levels of investment as a share of GDP remain historically low (Graph 39). In contrast to the pick-up in spending on machinery and equipment and buildings and structures, expenditure on mineral and petroleum exploration and computer software has declined recently.
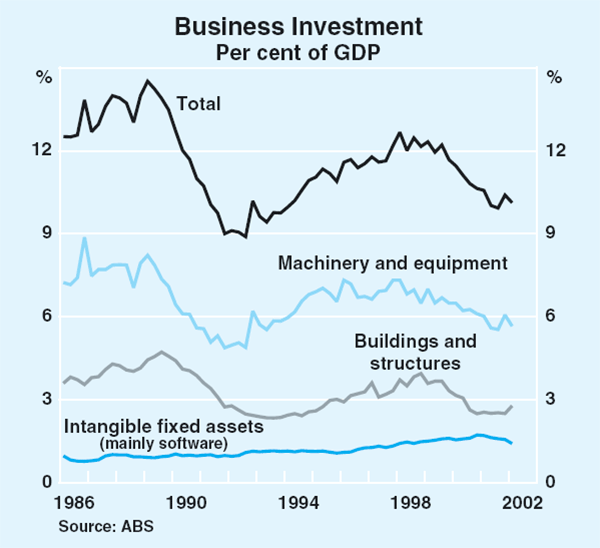
The recent indicators of investment intentions for 2002/03 remain positive. According to the March quarter ABS capital expenditure (Capex) survey, investment in machinery and equipment is expected to grow by around 15 per cent in nominal terms in 2002/03, assuming a five-year average realisation ratio. The mining and transport sectors continue to underpin the expected growth in investment, with a sizable increase also anticipated in the property and business services sector. Spending on machinery and equipment by the manufacturing sector is expected to remain weak in 2002/03, according to the Capex survey, despite manufacturers reporting optimistic investment plans in some private-sector business surveys.
The Capex survey also points to rapid growth in investment spending on buildings and structures in 2002/03. This is supported by information from the Access Economics Investment Monitor, which reported a sharp increase over the past year in the value of projects under construction and projects in the pipeline. The ABS building activity and engineering surveys also reported significant amounts of non-residential construction work in the pipeline, though non-residential building approvals have eased in recent months. Office and business-park construction account for a sizable share of the expected growth in building activity. While office vacancy rates have drifted higher in most capital cities over the past year or so, they remain only slightly above their historical lows. Investment will also be boosted by infrastructure spending, with a significant number of public projects earmarked for private-sector involvement by various state governments.
Commonwealth budget
The Commonwealth Government announced its 2002/03 budget in May. The estimated underlying cash balance is a surplus of $2.1 billion, compared with a deficit of $1.2 billion in 2001/02 (Table 9). In accrual terms, the budget is expected to be roughly in balance in 2002/03, compared with a deficit of $3.0 billion last year. New policy decisions included increased spending on defence operations, upgrading domestic security, reform of the Pharmaceutical Benefits Scheme and further welfare reform. Using the change in the underlying cash balance between financial years as an approximation of the fiscal stance, the Commonwealth budget had an expansionary impact on growth in expenditure in 2001/02 of around 1 per cent of GDP. In contrast, fiscal policy is expected to have a contractionary effect on expenditure growth this financial year of around ½ per cent of GDP. On the same basis, the combined fiscal impact from the states is likely to have been broadly neutral in 2001/02, but is expected to be slightly expansionary in 2002/03.
| 2000/01 | 2001/02 | 2002/03 | 2003/04 | |
|---|---|---|---|---|
| MYEFO (October 2001) | 5,625 | 502 | 991 | 1,776 |
| (0.8) | (0.1) | (0.1) | (0.2) | |
| Budget (May 2002) | 5,625 | −1,193 | 2,094 | 3,665 |
| (0.8) | (−0.2) | (0.3) | (0.5) |
The labour market
Labour market conditions remain favourable, supported by robust growth in economic activity. Employment growth has slowed, after a surge in the first part of the year, but employment is 1¾ per cent higher in the three months to July than in the corresponding period a year earlier. Full-time employment was flat in the past three months but part-time employment rose, continuing the strong upward trend of recent years (Graph 40). Consistent with the gains in employment over the first half of the year, the unemployment rate has fallen from its recent peak of 7.0 per cent in January to 6.2 per cent in July. Average weekly hours worked rose slightly in the June quarter, following a sizable increase in the March quarter.
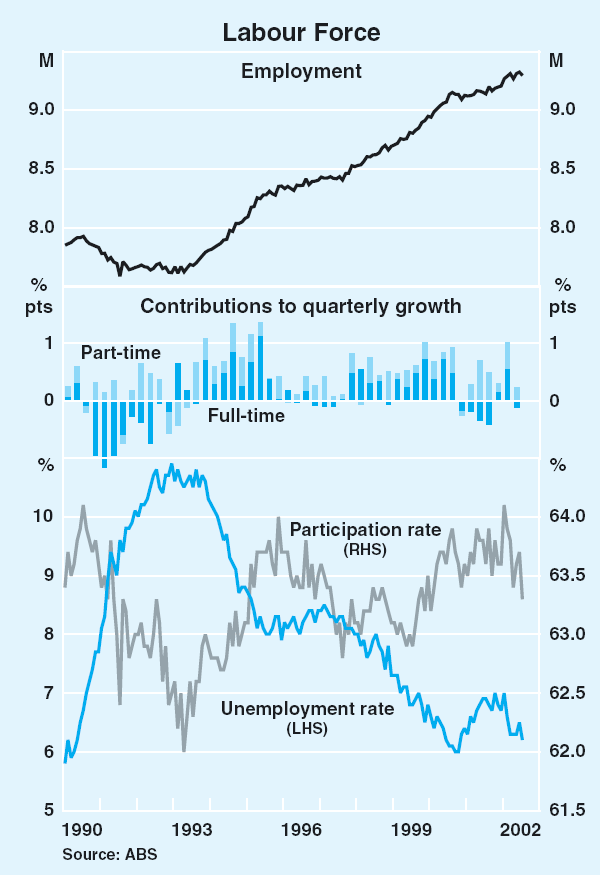
Queensland and South Australia have experienced the fastest employment growth over the year to the three months to July, of 2.7 and 2.5 per cent respectively (Table 10). In contrast, employment growth has eased in Victoria after a two-year period in which job generation had tended to outpace that in the rest of Australia. The unemployment rate has risen slightly in New South Wales and Tasmania in the past year, consistent with the slower employment growth in those states.
| Employment growth | Unemployment rate | ||||
|---|---|---|---|---|---|
| Three months to July | Year to three months to July | Three months to July | Year to three months to July(a) | ||
| NSW | 0.3 | 1.1 | 6.2 | 0.2 | |
| Victoria | 0.3 | 1.5 | 5.8 | −0.5 | |
| Queensland | 0.3 | 2.7 | 7.4 | −1.1 | |
| WA | 0.3 | 2.1 | 6.0 | −1.4 | |
| SA | 0.3 | 2.5 | 6.7 | −0.9 | |
| Tasmania | 0.1 | −0.4 | 8.8 | 0.1 | |
| Australia | 0.2 | 1.7 | 6.3 | −0.6 | |
|
(a) Percentage point change Source: ABS |
|||||
In line with the pattern of growth of the domestic economy, strong increases in employment have been recorded in the construction and retail and wholesale trade industries over the past year (Table 11). Employment in the manufacturing and property and business services industries also rose in the first half of 2002, though employment in both these industries is still below levels of a year ago. Industries that had been most exposed to the downturn in tourism, such as accommodation, cafes and restaurants, and cultural and recreational services, experienced robust growth in the first half of this year, though employment in the transport and storage industry, which includes airline travel, remained weak.
| Industry | Share of total | Percentage change | |
|---|---|---|---|
| 2001 | Second half 2001 | First half 2002 | |
| Retail and wholesale trade | 20 | 2.8 | 1.2 |
| Manufacturing | 12 | −2.7 | 0.7 |
| Property and business services | 12 | −6.2 | 3.8 |
| Health and community services | 10 | 1.0 | 1.1 |
| Construction | 7 | 3.0 | 4.9 |
| Education | 7 | 3.7 | 0.2 |
| Accommodation, cafes and restaurants | 5 | −2.5 | 3.1 |
| Agriculture | 5 | 6.2 | −3.8 |
| Transport and storage | 5 | 1.6 | −5.7 |
| Finance and insurance services | 4 | 2.6 | −1.7 |
| Cultural and recreational services | 2 | −0.1 | 8.2 |
| Communication services | 2 | −10.4 | 2.5 |
| Total(a) | 100 | 0.6 | 1.1 |
|
(a) Includes public administration and defence, personal and other services, mining and utilities Source: ABS |
|||
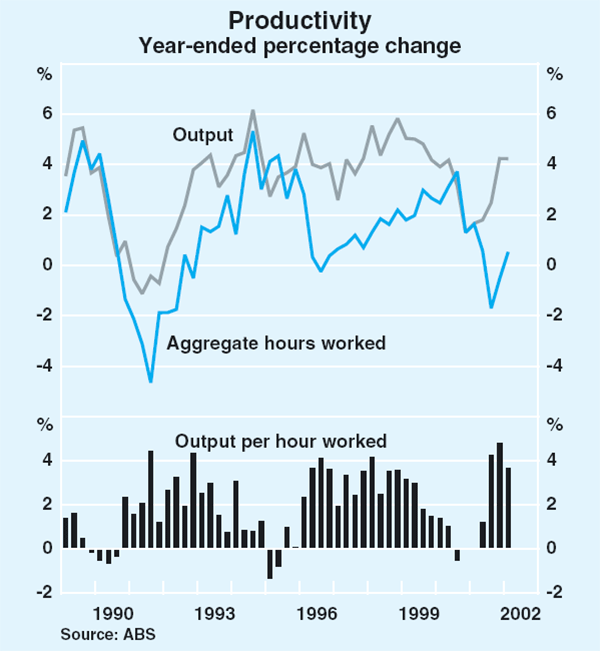
With output growth maintaining its robust pace in the year to the March quarter and the labour market strengthening, growth in output per person employed increased by 2½ per cent over the year. On an hours-worked basis, the increase over the year was somewhat stronger at 3¾ per cent. This is well above the average growth in this series over the past decade of about 2¼ per cent (Graph 41).
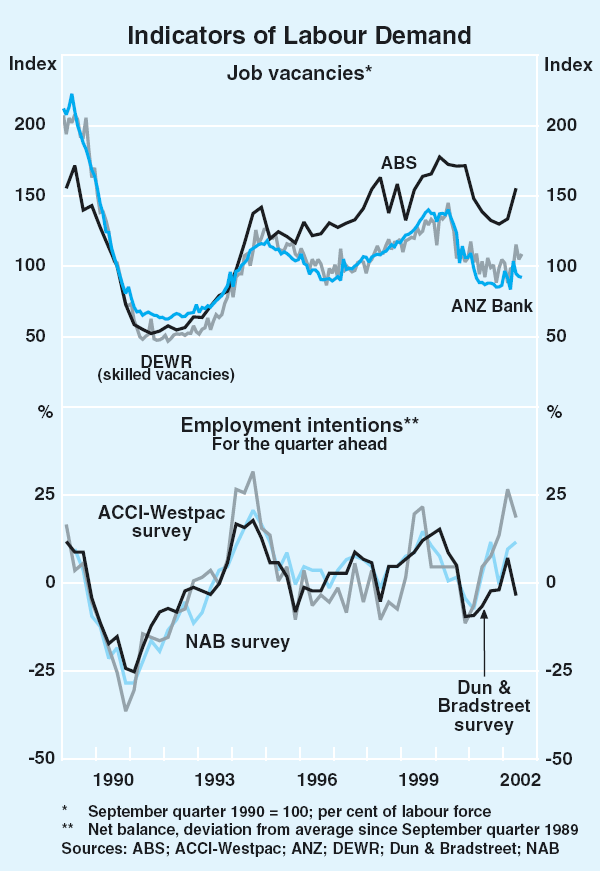
Forward-looking indicators of labour demand point towards further employment gains. While slowing recently, vacancies data are well above their troughs in late 2001 (Graph 42). The ANZ newspaper-based measure of job advertisements has increased by 1 per cent in the three months to July and is now 8 per cent higher over the year. The level of skilled vacancies, as measured by the Department of Employment and Workplace Relations (DEWR), has also risen in recent months, and is 4 per cent higher over the year to July. The ABS employer-based measure of vacancies rose by 9 per cent in the June quarter, and has recovered more than half the 23 per cent fall experienced during 2001. While most survey data report a slight easing in hiring intentions for the September quarter, they remain around or above long-run levels.
Box A: Developments in Household Balance Sheets
Over the past decade household debt levels in Australia have risen from relatively low levels by international standards to be comparable to those in other advanced countries. At the same time there has been strong growth in the value of assets owned by households, although at a somewhat slower pace, such that the ratio of household debt to assets has risen.
The bulk of the increase in household debt over the past decade has been related to housing. Currently, around 84 per cent of household debt is classified as lending for housing (Table A1),[1] comprising lending to owner-occupiers and investors. While owner-occupier mortgages remain the largest single component of household debt, loans for investor housing have grown significantly faster over the past decade than those for owner-occupied housing.[2]
| Purpose | Share of total Mar 2002 |
Annual average growth 1990–2002 |
|---|---|---|
| Housing | 84 | 14.9 |
| – Owner-occupied | 59 | 13.2 |
| – Investor | 26 | 21.7 |
| Personal | 16 | 8.2 |
| – Credit card | 5 | 13.2 |
| – Other | 11 | 7.0 |
| Total | 100 | 12.3 |
|
Source: RBA, based on bank lending data |
||
Consequently, the share of investor loans in the total stock of household debt has risen from 9 per cent in 1990 to 26 per cent currently.
The growth in borrowing for owner-occupied housing has reflected an increased number of mortgages (as a result of the increase in the number of households in Australia) but primarily increased loan sizes. The average size of a new loan has risen from around $74,000 in 1991 to around $150,000 in 2001. Consequently, over the same period, the average size of all outstanding owner-occupier loans has risen from around $46,000 to $128,000.
The growth in borrowing for housing may be somewhat overstated – and lending for other purposes correspondingly understated – as some part of the increase in housing debt is likely to reflect an increasing share of borrowing classified as ‘housing’ being used for other purposes. When reporting lending data, financial institutions are required to classify lending by purpose, rather than by type of security, but this can be difficult to track through time. For example, a borrower redrawing a housing loan to purchase a car does not need to notify the lender of the purpose of the redraw, and hence the funds accessed will generally be classified as lending for housing. With the increased availability of financial products that allow borrowing secured by housing, and the rise in the underlying value of housing assets available to be used as collateral, it seems likely that an increased proportion of the lending classified as housing-related is actually used to finance consumption or to purchase other assets.
Despite the rapid rise in borrowing for housing, home ownership rates have been relatively stable over the past decade (Table A2). Around 70 per cent of the housing stock is owner-occupied, with around 40 per cent being owned outright and 30 per cent owned with a mortgage. The remainder of the housing stock is rented, and hence is predominantly owned by investors. This pattern of home ownership is broadly the same across the capital cities. In non-metropolitan areas, the proportion of households owning their home outright is slightly higher, and the proportion owning their home with a mortgage slightly lower, than in the capital cities. Around 9 per cent of households own investment property as judged by those who reported rental income in the ABS 1998/99 Household Expenditure Survey.
| Home Owners | Renters | |||
|---|---|---|---|---|
| Owned outright | Mortgage | Total | ||
| 1981 | 35.7 | 35.5 | 73.2(b) | 26.8 |
| 1991 | 43.1 | 28.5 | 71.5 | 28.5 |
| 1996 | 43.7 | 27.2 | 70.9 | 29.1 |
| 2001 | 43.0 | 28.6 | 71.6 | 28.4 |
|
(a) Excludes other forms of occupancy Source: Census of Population and Housing, ABS Cat No 2015.0 |
||||
Primarily reflecting the rise in house prices, the value of housing assets has risen at an annual rate of 8¾ per cent since 1990 with the rate of increase accelerating in recent years (Table A3). The value of assets held in superannuation and direct equity has risen at a faster pace since 1990 but housing assets still comprise the bulk of household assets.
| Growth (per cent) | ||||
|---|---|---|---|---|
| Level $ billion | Share of total Per cent |
Year to March | Annual average 1990–2002 | |
| Housing | 2,056 | 60.9 | 20.3 | 8.7 |
| Consumer durables | 182 | 5.4 | 10.5 | 5.2 |
| Financial assets | 1,136 | 33.7 | 9.5 | 8.7 |
| – Superannuation and life offices | 535 | 15.9 | 5.9 | 10.9 |
| – Equities and unit trusts | 260 | 7.7 | 18.3 | 11.2 |
| – Currency and deposits | 302 | 8.9 | 13.4 | 5.8 |
| – Other | 39 | 1.2 | −14.8 | 1.0 |
| Total | 3,375 | 100.0 | 15.9 | 8.5 |
|
(a) Includes unincorporated sector, but excludes unfunded superannuation and prepayment of insurance Sources: ABS, RBA |
||||
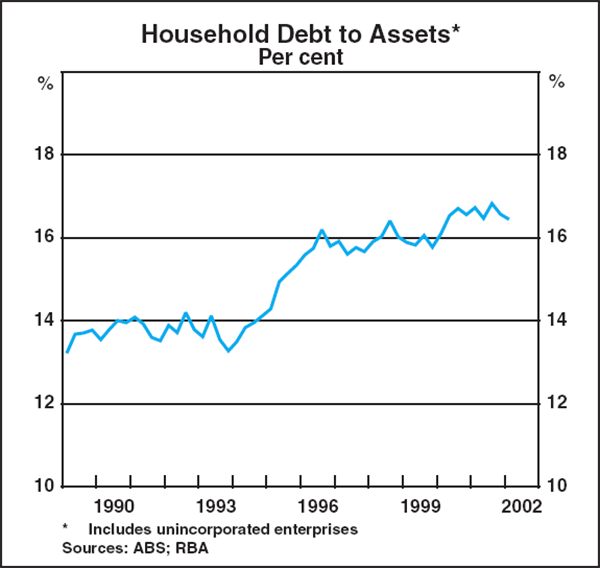
The value of household assets has grown at a slightly slower pace than household debt over the past decade or so, such that the ratio of household debt to assets has risen from around 14 per cent in 1990 to 16½ per cent in March 2002 (Graph A1).
Balance of Payments
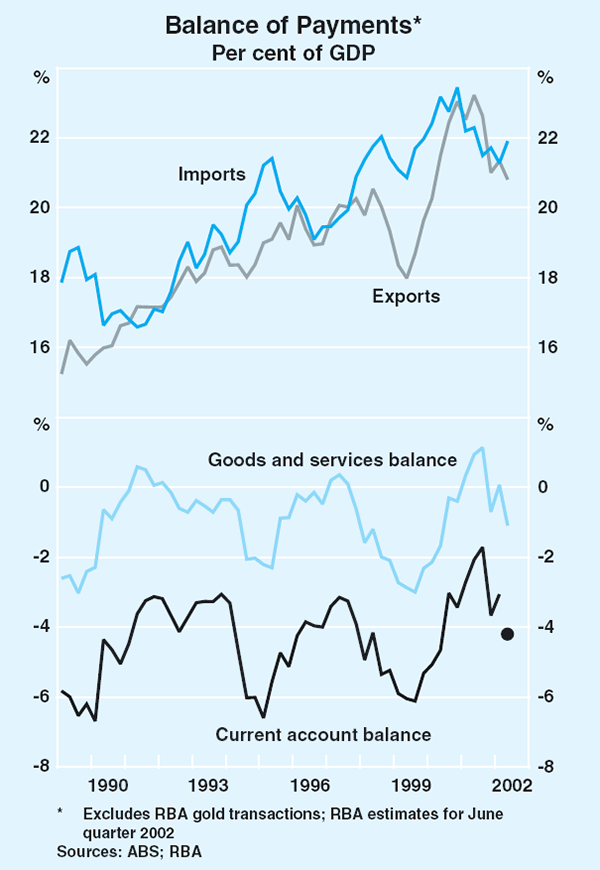
Reflecting Australia's faster pace of growth relative to its trading partners, the balance of trade recorded a deficit of around 1 per cent of GDP in the June quarter. On the assumption that the net income deficit as a share of GDP remained constant, the current account deficit is likely to have widened from 3.1 per cent of GDP in the March quarter to close to 4¼ per cent in the June quarter (Graph 43).
Exports to most markets have declined over the past year, in line with the global slowdown, with the weakness concentrated at the end of 2001. Particularly large falls were recorded in exports to Japan and the European Union (Table 12). Exports to the Middle East, which increased rapidly through most of 2001, have contracted over the past six months, as the earlier buoyant trade in exports of live animals and road vehicles eased. There have, however, been some notable exceptions. Exports to Korea and New Zealand, our third and fifth largest trading partners respectively, have both risen by more than 10 per cent over the past year, reflecting the strong economic growth in these countries.
| Share of total 2001 |
Growth | ||
|---|---|---|---|
| Year to June quarter 2001 |
Year to June quarter 2002 |
||
| East Asia (excluding Japan and China) | 26.6 | 10.3 | −6.5 |
| – of which Korea | 7.5 | −1.8 | 13.8 |
| Japan | 20.0 | 20.5 | −16.3 |
| EU | 11.8 | 21.2 | −17.1 |
| US | 10.2 | 12.7 | −4.7 |
| China | 6.5 | 33.6 | 1.4 |
| New Zealand | 6.1 | 13.6 | 12.4 |
| Middle East | 4.9 | 60.5 | −3.4 |
| India | 1.9 | 18.8 | −1.2 |
| Rest of world | 12.0 | 26.4 | 1.7 |
| World | 100.0 | 19.3 | −6.8 |
|
(a) Excludes gold Source: ABS |
|||
After rebounding in the March quarter, the value of exports fell by almost 2 per cent in the June quarter, as price falls offset a small rise in export volumes. Resource export values eased by 1¼ per cent in the June quarter (Graph 44). The fall was more than accounted for by lower world commodity prices, especially spot prices for thermal coal, and the valuation effects of the appreciation of the Australian dollar over the first half of this year. Lower base metals prices also contributed to a fall in the value of metals exported in the quarter. Exports of mineral fuels, however, grew strongly. The Australian Bureau of Agricultural and Resource Economics (ABARE) forecasts that the value of energy exports will fall in 2002/03, partly because some of Australia's mature oil fields are approaching the end of their productive lives and because of lower contract thermal coal prices (see ‘Commodity prices’ section). However, exports of metals are expected to grow strongly in 2002/03, as the large increases in mining investment over the past year and a half expand the production capacity of mines.
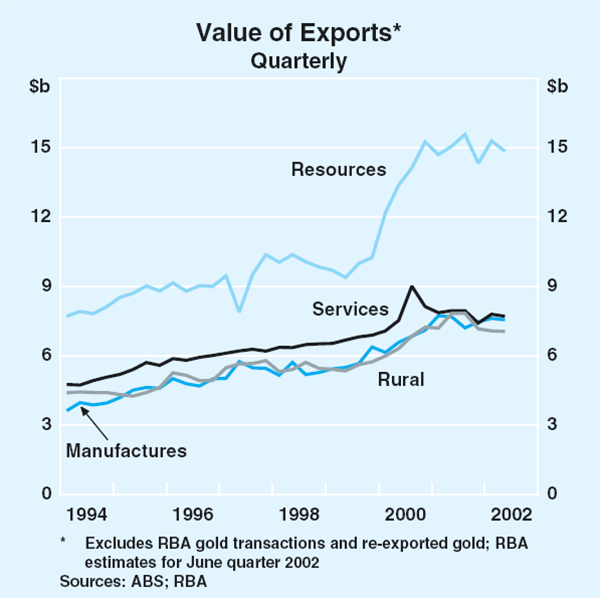
The value of rural exports fell slightly in the June quarter, to be almost 10 per cent lower than a year earlier. As with resource exports, falling prices in Australian dollars for rural commodities offset a substantial rise in rural export volumes in the June quarter. In the June quarter there was a sharp increase in grain exports, as the large winter crop harvested over the Christmas period began to be exported, and a 2.3 per cent rise in the value of wool exports, boosted by higher prices. Beef exports were steady in the first half of the year, with lower prices more than offset by strong growth in export volumes to most of our major markets.
A number of factors are likely to curtail growth in Australia's rural exports in the period ahead. Drier conditions, particularly in NSW, which accounts for about one-third of Australia's grain production, southern Queensland and parts of Western Australia, will limit the size of the grain crop and bring forward livestock slaughtering. Wheat exports may also be affected if Iraq reduces its Australian wheat shipments. The recent signing of the US Farm Security and Rural Investment Act of 2002 (the 2002 US farm bill) will significantly increase the level of support to US farmers. This is expected to result in an increase in US production – especially of grains, oilseeds, cotton and dairy products – and lower world prices for these products.
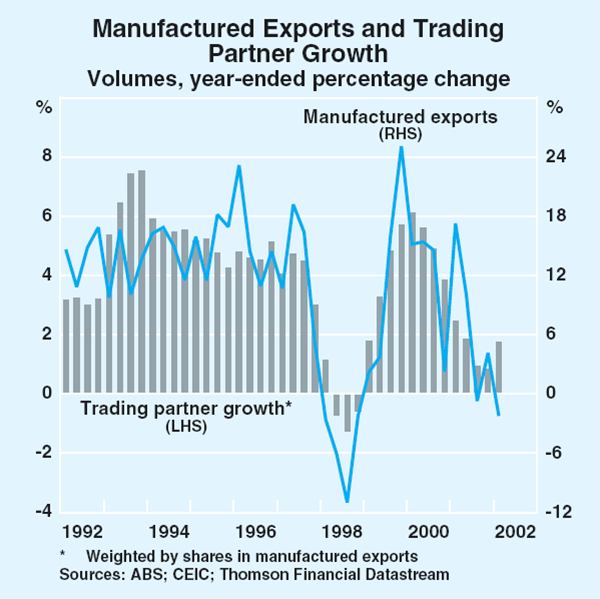
The steepest falls in the value of exports in the June quarter were in manufactured goods, which contracted by about 3¼ per cent, partly reflecting weak trading-partner growth – a key driver of manufactured exports – and valuation effects from the rise in the Australian dollar exchange rate (Graph 45). The fall was broad-based, though the decline in the June quarter was particularly sharp for exports of machinery. Service exports have also been adversely affected by slow growth in world output and international trade. This is most evident in the lower export earnings from tourism and transportation services. Overall, the value of service exports in the June quarter fell by just over 1 per cent, to be more than 2 per cent lower over the year.
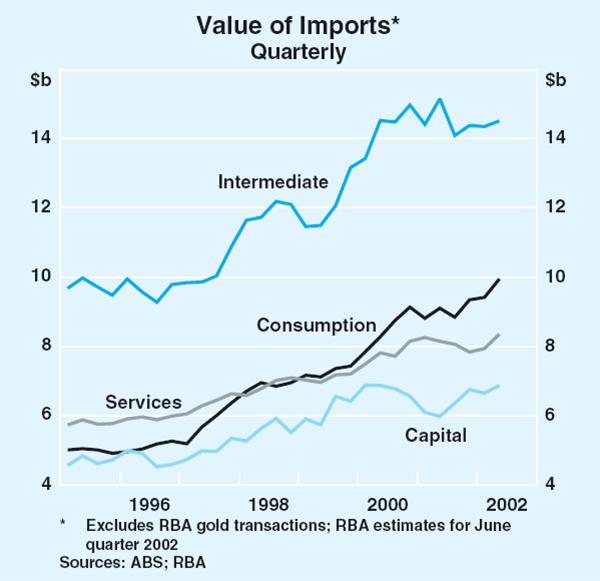
Robust growth in domestic demand has continued to spur demand for imports. The volume of imports is estimated to have risen by over 5 per cent in the June quarter, to be about 10 per cent higher than a year ago. Over the same period, the value of imports has risen at a slower pace, because of lower import prices and the appreciation of the exchange rate. The biggest increases in the quarter were in a range of consumption goods, notably cars and household electrical items, reflecting the strength in domestic sales of motor vehicles and household goods. In total, the value of consumption imports rose by around 5¾ per cent in the June quarter (Graph 46). Capital imports rose by 3½ per cent over the same period, predominantly due to increased imports of telecommunication equipment, and are 15 per cent higher than a year earlier. Consistent with the appreciation of the exchange rate over the first half of the year, a recovery in imports of travel services is estimated to have contributed to a significant rise in the volume of service imports in the June quarter.
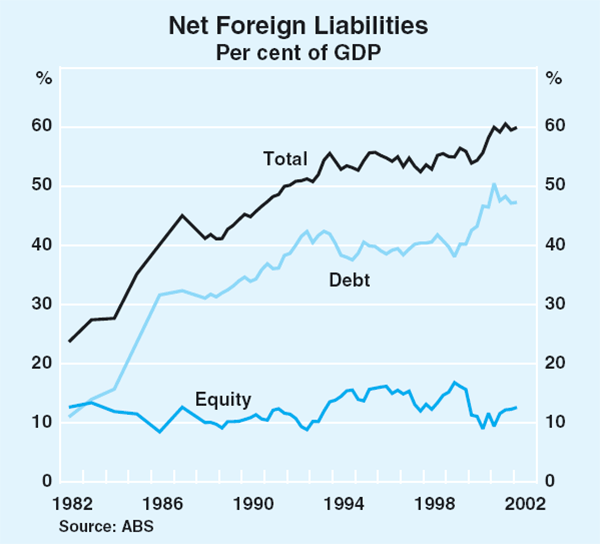
The net income deficit in the March quarter widened slightly, to be just above 3 per cent of GDP. Relative to GDP, the deficit has remained broadly stable over the past four years, as lower global interest rates have offset the higher level of net foreign liabilities. Australia's net foreign liabilities increased slightly in the March quarter to $421 billion, or 60 per cent of GDP (Graph 47). This primarily reflected a rise in net foreign debt to 47½ per cent of GDP, as net inflows of debt again significantly outpaced those of equity, consistent with the trend of subdued net equity outflows over the past few years.
Commodity prices
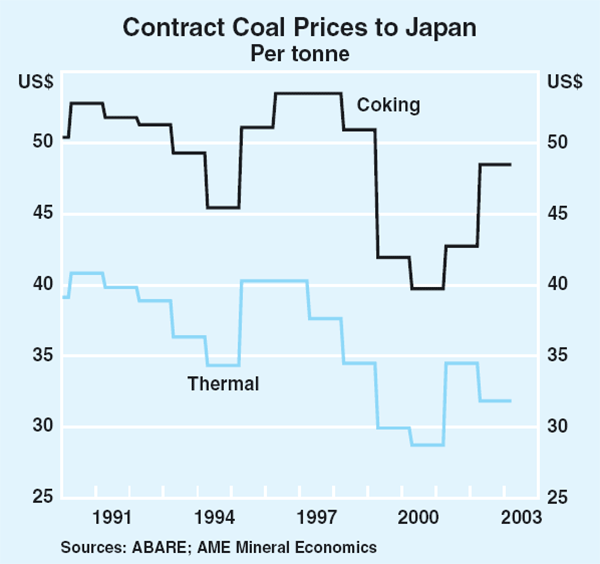
Around the middle of the year, most major Australian resource contract price negotiations were concluded. This year coking coal contract prices to Japan increased by around 13 per cent, the second successive annual increase. However, contract thermal coal and iron ore prices fell. The thermal coal reference price was cut by 7.7 per cent, in part reflecting increased competition from China and Indonesia (Graph 48). Contract prices for iron ore were also cut, with iron ore fines prices reduced by 2.4 per cent and iron ore lump prices by 5 per cent.
Prices for most other commodities produced in Australia have fallen in recent months, to reverse most of the gains recorded in the March quarter. The RBA Commodity Price Index declined by 2.7 per cent in SDR terms and by around 4.8 per cent in Australian dollar terms in the past three months (Table 13 and Graph 49). Most rural commodities have recorded price falls, albeit from high levels. Beef and veal prices have been under downward pressure as dry conditions have led to increased slaughtering of cattle, and as demand for beef in Japan has slumped following a further case of ‘mad-cow’ disease in the Japanese herd. Despite rising recently, sugar prices remain at low levels because of heavy international selling and an expected record high in Brazilian production, the world's largest sugar producer and trader.
| July | Latest 3 months | Year to latest 3 months | |
|---|---|---|---|
| Rural | 1.5 | −3.1 | 2.1 |
| – Beef and veal | 1.1 | −5.4 | 7.4 |
| – Wool | −4.3 | −2.6 | 17.1 |
| – Wheat | 5.0 | −0.6 | −0.3 |
| – Sugar | 11.1 | 1.5 | −26.2 |
| Base metals | −3.4 | −5.1 | −9.3 |
| – Aluminium | −3.9 | −6.4 | −12.1 |
| – Copper | −6.1 | −2.5 | −3.4 |
| – Nickel | −2.2 | 3.4 | 2.9 |
| – Lead | −1.1 | −10.4 | −6.0 |
| Other resources | −1.8 | −1.8 | 1.3 |
| – Gold | −4.8 | 2.0 | 12.9 |
| RBA Index | −1.0 | −2.7 | 0.1 |
| Memo items: | |||
| Oil in US$(a) | 5.5 | 11.1 | −3.8 |
| Coal in US$(b) | −7.6 | −5.9 | −20.8 |
| (a) Oil prices are not included in the RBA Index (b) Spot price for steaming coal from the Australian Coal Report; latest observation is for June |
|||
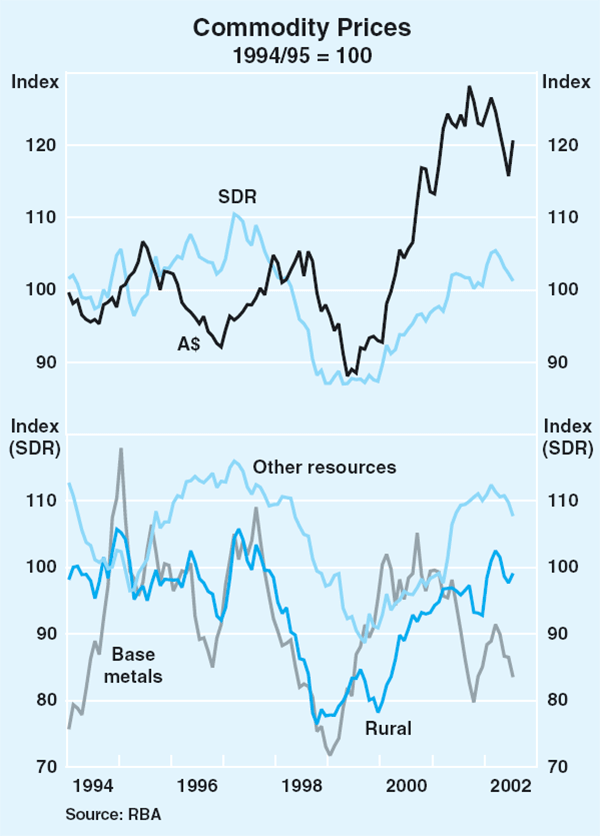
Wheat prices continued to rise in July, because of lower-than-expected yields from crops planted in the US, Canada and Russia. Tight supply conditions have also contributed to higher wool prices, which are 17 per cent higher than a year ago.
Base metals prices fell by 5.1 per cent in the three months to July, after rising earlier in the year and were more than 9 per cent lower than a year earlier. The general weakness in base metals prices over the past year reflects the lacklustre growth in world industrial production. Prices of other resources have generally also fallen since the beginning of the year. A combination of geopolitical tensions and financial market instability, particularly in the US, drove the gold price to a four-year, intra-day peak above US$330 per ounce in early June. Since then, the gold price has fallen, but still remains above US$300 per ounce. Oil prices have been volatile in recent months, but have generally remained around the middle of the OPEC target band (Graph 50).
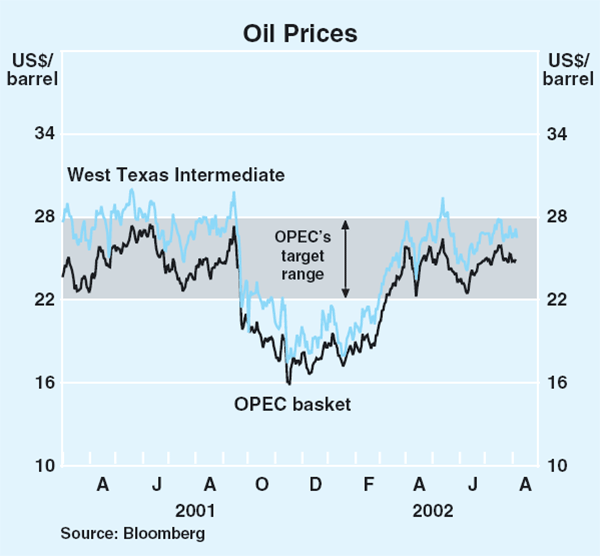
Despite recent falls, over the past couple of years commodity prices have risen significantly, along with other non-commodity export prices. Over the same period, import prices have risen at a slower pace, and have declined since the second half of last year, partly reflecting the steep and steady falls in the prices of ICT equipment. As a consequence of these trends, Australia's terms of trade have steadily improved to be around their highest level since the early 1990s.
Domestic Financial Markets
Interest rates in money and bond markets
At the time of the increase in the target cash rate from 4.25 to 4.50 per cent in early May, the money market had priced-in several further increases, totalling 75 basis points, by the end of the year. Market expectations for increases in the cash rate rose further in the weeks leading up to the June tightening of policy. Not only was the June tightening fully expected, but a further 100 basis points were factored in for the balance of the year. This was consistent with an end-year target cash rate of 5.75 per cent (Graph 51). This change in outlook was underpinned by ongoing strong domestic economic news and improving sentiment about the global recovery.
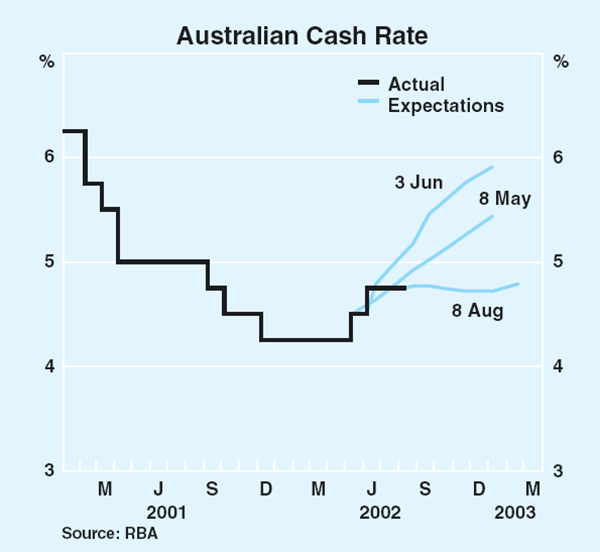
Over the following two months, however, expectations for the target cash rate were revised progressively lower. By early August, the money market was expecting no change until well into 2003. This reassessment was driven predominately by developments offshore and in particular by weakness in foreign equity markets. Market participants became increasingly concerned that the weakness in global equity markets, if protracted, could threaten recovery in the US economy and ultimately constrain the domestic economic outlook.
The turnaround in money market interest rates has been mirrored further out the yield curve. Yields on medium- and long-term Australian government bonds rose early in the quarter. The 3-year bond yield rose by 50 basis points to over 6.00 per cent and the 10-year bond yield by 20 basis points to 6.30 per cent between end April and early June (Graph 52). Bond yields then fell sharply. By early August, 3-year bond yields had declined around 100 basis points to 5.05 per cent. The yield on 10-year bonds had fallen 70 basis points to 5.60 per cent. These falls took bond yields back to their levels at the start of the year.
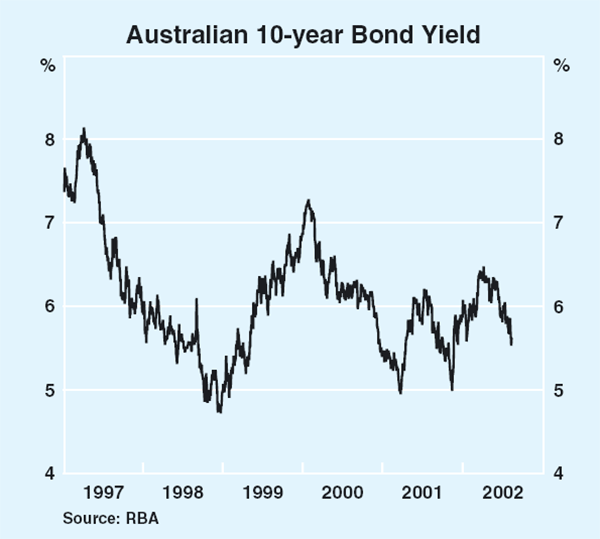
While the rise in bond yields in May was more a reflection of the domestic economic news and revisions to policy expectations, the decline over the past two months has been predominantly and increasingly a response to the sharp falls in US equity valuations and the associated fall in US bond yields. The fall in Australian yields was more muted than that in the US, reflecting the greater resilience of the Australian share market and economy.
The spread between 10-year Australian and US bond yields has widened noticeably in recent months; in early August, it was close to 130 basis points compared with 100 basis points at the time of the previous Statement (Graph 53).
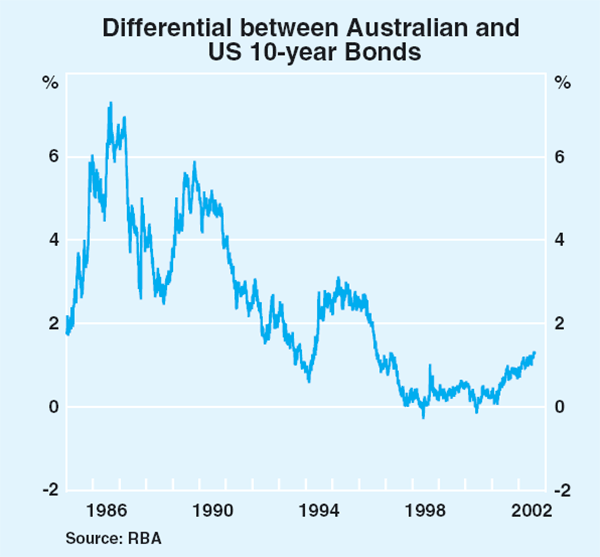
Since end April, yields on corporate bonds have not fallen as far as yields on government bonds, reflecting increased risk aversion in fixed-interest markets. Spreads on bonds rated BBB widened the most, following a profit warning from one domestic retailer (Graph 54). Spreads on bonds rated A and AA have also risen sharply. These categories of bonds include a number of US financial institutions which have Australian bond issues, and the rise in spreads reflected concerns about their credit quality and their relationship with Enron. In addition, the financial strength of AA-rated foreign insurers who have issued in the Australian market has been weakened by investment losses in equity markets. Nonetheless, Australian corporate bond spreads have risen by less than spreads in the US. There, concerns about the financial health of the corporate sector have caused bond spreads to increase sharply (Graph 55).
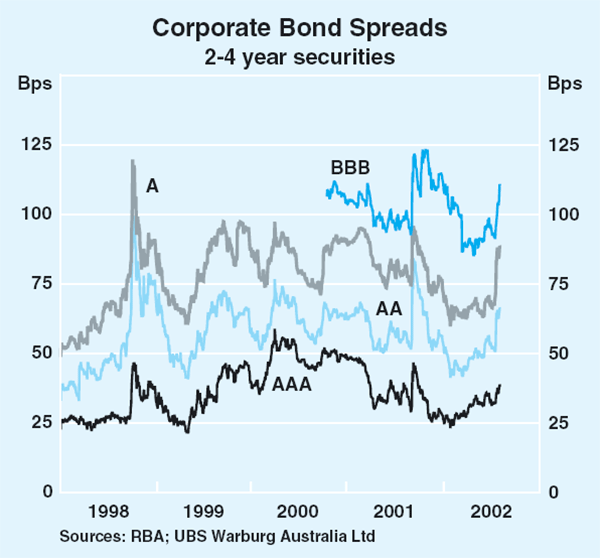
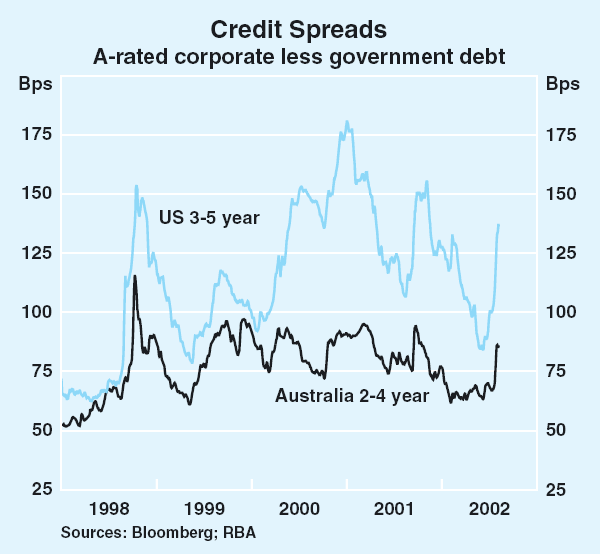
Intermediaries' interest rates
The 25 basis point increases in the cash rate in May and June were passed on by banks in full to their indicator lending rates.
Many of these rates are now higher than in 1999 when the cash rate was also 4.75 per cent (Table 14). This reflects increases in banks' margins during the tightening in 2000 and the easing in 2001.
| Current level |
Change since end April |
Cyclical low in 1999 |
Change since cyclical low in 1999 |
|
|---|---|---|---|---|
| Cash rate | 4.75 | 0.50 | 4.75 | 0.00 |
| Households | ||||
| Standard variable mortgages | ||||
| – Banks | 6.55 | 0.50 | 6.50 | 0.05 |
| – Mortgage managers | 6.30 | 0.50 | 6.10 | 0.20 |
| Banks' basic | 6.00 | 0.50 | 5.90 | 0.10 |
| Personal lending | ||||
| – Residential secured | 6.70 | 0.50 | 6.60 | 0.10 |
| – Credit cards | 16.00 | 0.50 | 15.25 | 0.75 |
| Small business | ||||
| Residential security: | ||||
| – Overdraft | 7.30 | 0.50 | 6.95 | 0.35 |
| – Term loans | 6.75 | 0.50 | 6.65 | 0.10 |
| Other security: | ||||
| – Overdraft | 8.00 | 0.50 | 7.45 | 0.55 |
| – Term loans | 7.35 | 0.50 | 7.05 | 0.30 |
| Large business | ||||
| – Overdraft | 8.35 | 0.50 | 7.95 | 0.40 |
| – Term loans | 8.20 | 0.50 | 7.90 | 0.30 |
|
Source: RBA |
||||
The smallest increases in margins have been for loans secured by residential property (Graph 56). Margins on mortgages have increased between 5 and 20 basis points since the beginning of 1999. Margins on personal loans secured by residential property (commonly called home equity loans) and small business term loans secured by residential property have also increased by only a small amount.
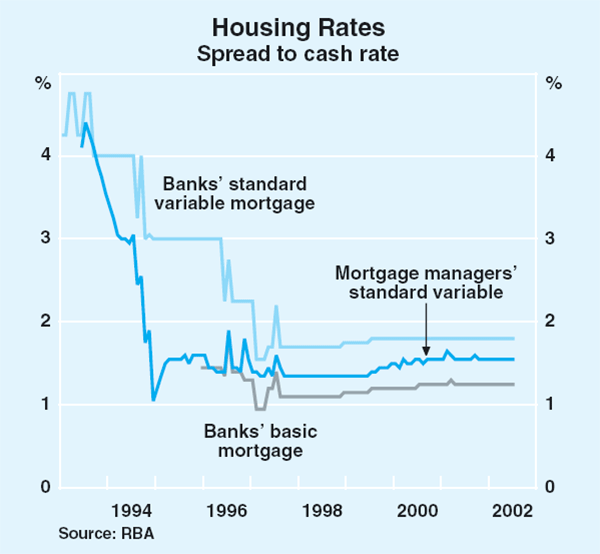
Other rates have shown greater increases. Credit card margins have increased by 75 basis points. Margins on small business overdrafts and loans secured by assets other than residential property have risen by between 30 and 55 basis points. Small businesses have, however, kept their average borrowing costs down by switching to lower-cost products (Graph 57). Margins on variable interest rate loans to large businesses – albeit applicable to only around a quarter of large businesses' total bank borrowings – have also risen by around 30–50 basis points.
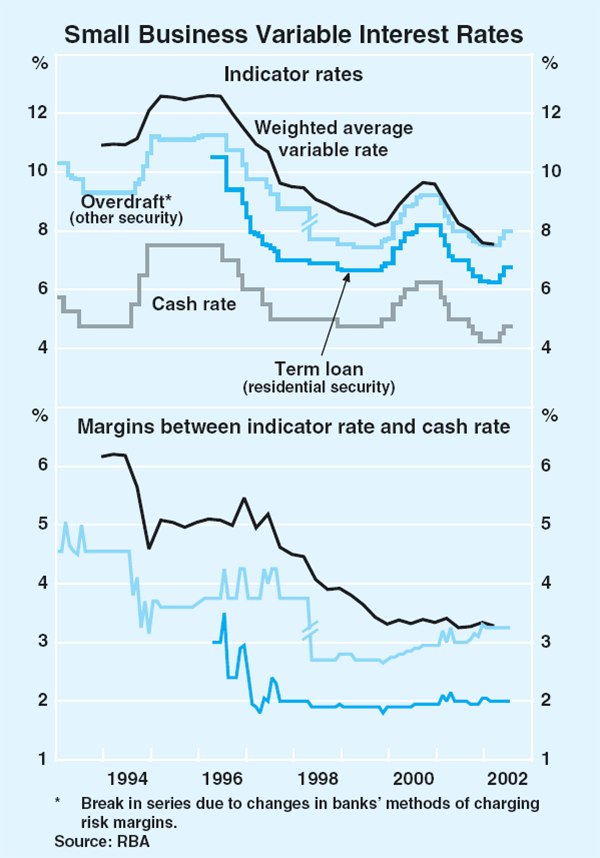
Banks' fixed rates for housing and small business have fallen slightly in recent months, reflecting moves in the market yields from which these loans are priced (Graph 58). With borrowers seeking to lock-in fixed rates ahead of expected interest rate rises, the proportion of fixed-rate loans amongst new loans has risen over the past six months to over 9 per cent. This proportion is still relatively low by historical standards, however, perhaps indicating that households are relatively comfortable about the risks of rises in variable rates. Also, at present, interest rates on variable-rate mortgages are still a little below those on fixed-rate mortgages (Graph 59).
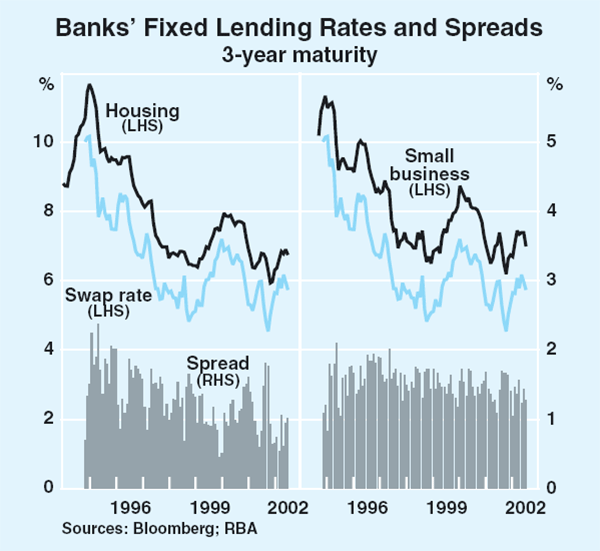
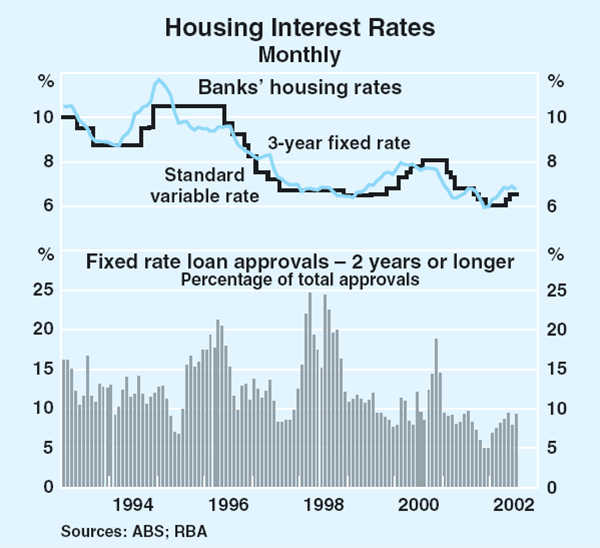
Non-intermediated financing
Debt markets
The domestic non-government bond market saw $8.5 billion of issuance in the second quarter of 2002. This was somewhat less than the $10.5 billion issued in the previous quarter, but well in excess of maturing bonds. As such, non-government bonds outstanding in Australia rose by 6 per cent over the quarter to $116 billion. In contrast to the pattern seen in recent quarters, issuance came mostly in the form of direct, rather than asset-backed, bonds (Graph 60). Direct bond issuance was up 19 per cent on the previous quarter.
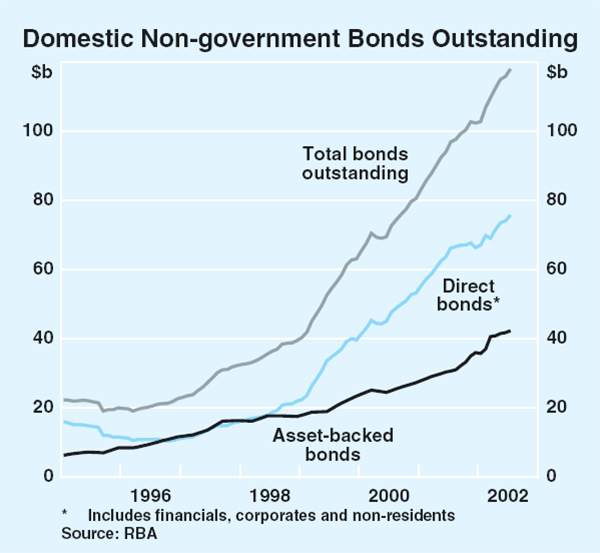
Financial institutions accounted for almost 60 per cent of direct bond issuance during the quarter (Table 15). Issuance by this group was boosted by one large issue from the domestic subsidiary of a US finance company. This issue, at $1.7 billion, was the largest single issue yet made in the Australian market. Corporate issuance, at $2.3 billion, was double that placed in the previous quarter. Property trusts and utility companies accounted for the majority of corporate issues.
| Sector | 1999 | 2000 | 2001 | 2002:Q1 | 2002:Q2 |
|---|---|---|---|---|---|
| Financials | 10.4 | 5.1 | 6.0 | 1.8 | 3.6 |
| Non-residents | 5.6 | 3.5 | 7.8 | 2.1 | 0.2 |
| Australian corporates | 5.5 | 7.9 | 6.1 | 1.2 | 2.3 |
| Total direct issuance | 21.5 | 16.5 | 19.9 | 5.1 | 6.1 |
| of which: | |||||
| – Credit-wrapped(a) | – | 3.8 | 2.0 | 0.3 | 0.7 |
| – Floating rate notes | 1.1 | 6.5 | 5.3 | 1.8 | 1.8 |
| Asset-backed issuance | 6.4 | 11.4 | 15.1 | 5.4 | 2.4 |
| Total new issuance | 27.9 | 27.9 | 35.0 | 10.5 | 8.5 |
|
(a) Bonds with credit ratings enhanced by the backing of a third party Source: RBA |
|||||
Domestic issuance by non-residents recorded its lowest level since June 2000. A number of non-resident issuers that sounded out the Australian market in recent months deferred their planned issues because the cost of raising funds in Australia relative to their home markets had risen in the past month or two. In the Australian market, most foreign issuers carry a AAA rating. Substantial issuance by AAA-rated domestic issuers earlier in the quarter left little appetite for such foreign issuers (Graph 61).
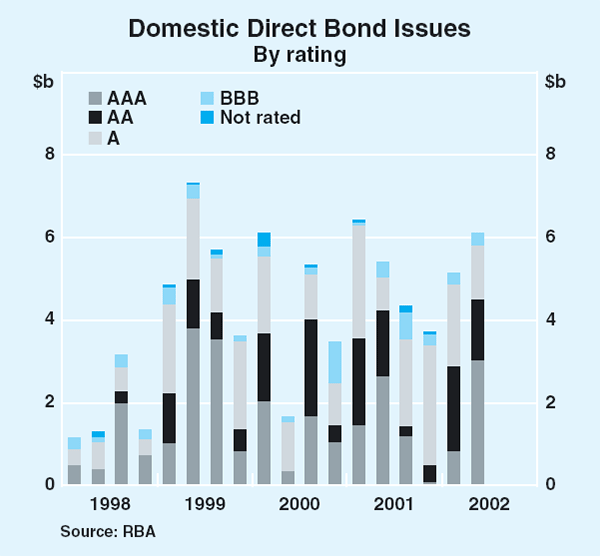
The maturity profile of bonds outstanding lengthened during the quarter as a number of domestic direct bond issuers issued long-dated bonds with the stated intention of extending the average term of their outstanding debt. Two-thirds of direct bond issues (by number) in 2002 to date have had initial maturities of five years or longer, compared with an average of 40 per cent of issues over the previous three years.
Offshore bond issuance by Australian institutions amounted to $15 billion in the June quarter, up 25 per cent on the March quarter. As in the domestic market, financial institutions accounted for most issuance, raising $7.8 billion, while corporate entities raised $2.4 billion. Offshore asset-backed issuance, at $5 billion, was 20 per cent lower than in the March quarter. As in the domestic market, the reduction was entirely due to a reduction in average issue size.
Equity markets
The Australian share market has fallen less than most markets overseas. Since end April, the ASX 200 index has fallen 9 per cent, about half the decline in the US. The ASX 200 is 13 per cent below its peak in March this year, whereas broadly based US indices are more than 40 per cent below their peaks reached in the first quarter of 2000 (Graph 62).
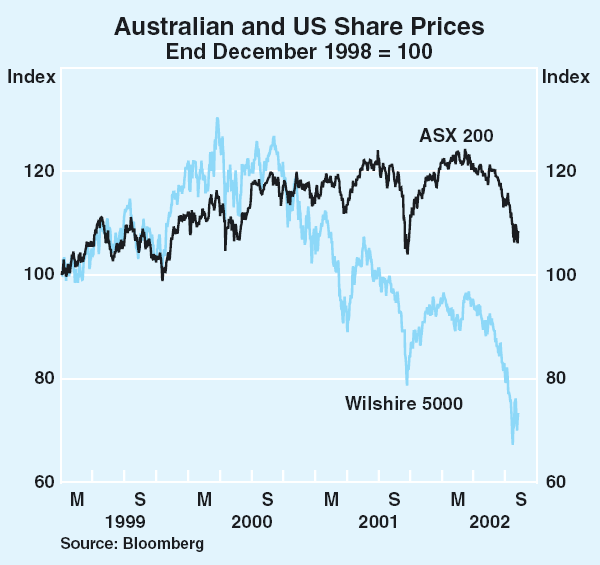
The smaller fall in the Australian market owes a lot to compositional differences compared with markets in major overseas countries (Table 16). Standard & Poor's have standardised the share price indices compiled for major countries to each include 10 broad industry sectors. Consistent data for these sectoral sub-indices are available since March 2000 (around the peak in the US market). Over this period, the Australian share market has, in aggregate, held up well, falling just 3 per cent. In comparison, the UK and Canadian markets have fallen more than 30 per cent while the US and Japanese markets have declined by around 40 per cent.
| Australia ASX 200 | US S&P 500 | UK
S&P UK Index |
Canada
TSX Composite |
Japan TOPIX 150 | |
|---|---|---|---|---|---|
| Sector returns (change since end March 2000) | |||||
| Consumer discretionary | −48 | −37 | −48 | −25 | −37 |
| Consumer staples | 34 | 27 | 35 | 97 | −29 |
| Energy | 30 | −18 | −14 | 60 | 41 |
| Financials | 30 | −10 | −10 | 35 | −51 |
| Health care | 12 | −6 | −25 | −32 | −29 |
| Industrials | 21 | −23 | −36 | 0 | −27 |
| Information technology | −91 | −77 | −92 | −93 | −64 |
| Materials | 26 | −11 | −9 | 11 | −27 |
| Telecommunication services | −48 | −73 | −77 | −58 | −68 |
| Utilities | −2 | −31 | 13 | 74 | 24 |
| Total market | −3 | −41 | −34 | −31 | −45 |
| Composition of share market (as at 7 August 2002, share of total index) | |||||
| Consumer discretionary | 11 | 13 | 8 | 9 | 26 |
| Consumer staples | 8 | 10 | 12 | 8 | 5 |
| Energy | 3 | 6 | 16 | 16 | 1 |
| Financials | 44 | 21 | 27 | 31 | 13 |
| Health care | 3 | 15 | 12 | 2 | 6 |
| Industrials | 8 | 12 | 5 | 8 | 15 |
| Information technology | <1 | 14 | 1 | 4 | 15 |
| Materials | 16 | 3 | 5 | 14 | 6 |
| Telecommunication services | 6 | 4 | 9 | 4 | 7 |
| Utilities | 1 | 3 | 4 | 4 | 6 |
|
Sources: Bloomberg; Standard & Poor's; Thomson Financial Datastream |
|||||
The Australian market has performed relatively well in five of the industry sectors, recording some of the largest net increases since March 2000 (Graph 63). These sectors were financials, materials, industrials, telecommunications and health care. In contrast, it has performed badly in the consumer discretionary and information technology sectors, recording among the biggest falls.
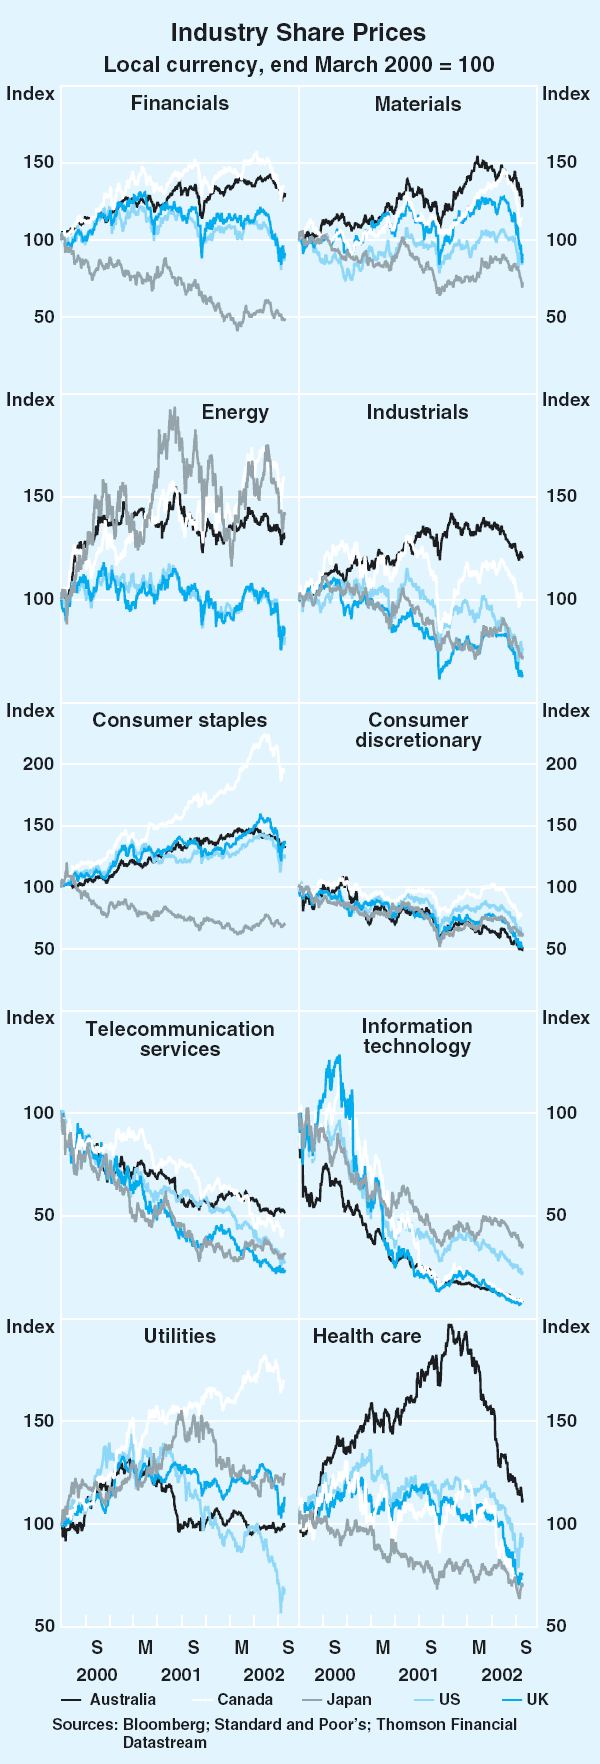
Across the sectors, therefore, the performance of the Australian share market is mixed. The factor that contributes most to the relatively strong overall performance of the Australian market is the weighting of the sectors. In particular, a very large proportion (currently 44 per cent) of the Australian market consists of financial stocks (Table 16). This has been a strongly performing sector. The Australian index also has only a negligible weight in the poorly performing information technology sector. If the Australian share market had had the same sectoral weights as the US market in March 2000, it would be showing a fall of 32 per cent since then, rather than the relatively flat outcome actually recorded.
Analysts continue to expect robust growth in company profits in the next year or two, though expectations have been scaled back a little over the past three months. Current expectations are for a 10 per cent rise in 2002, followed by a 13 per cent increase in 2003. Growth in profits tends to be volatile from year to year, and such increases are well within historical experience, as shown in Graph 64, but would require strong growth in the economy.
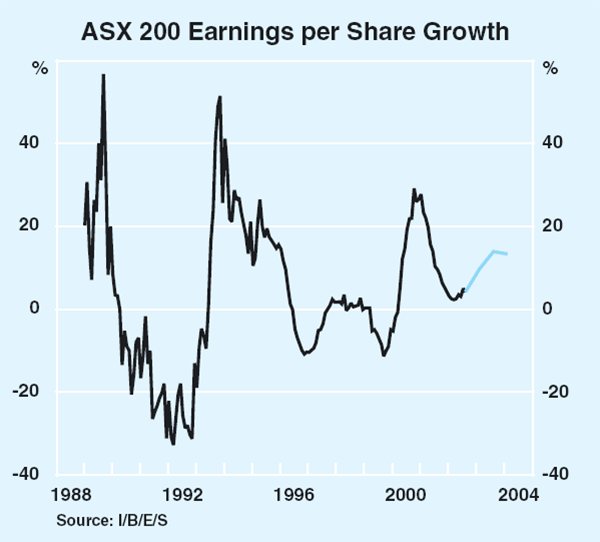
The P/E ratio calculated on trailing, ‘as-reported’ profits has risen since late 2001, from around 20 to 27. An important factor contributing to the rise was the large losses incurred by News Corporation. Excluding this company, which has a large weight in the Australian market, the P/E ratio is 18. This is higher than average, but remains below comparable ratios for the US (Graph 65).
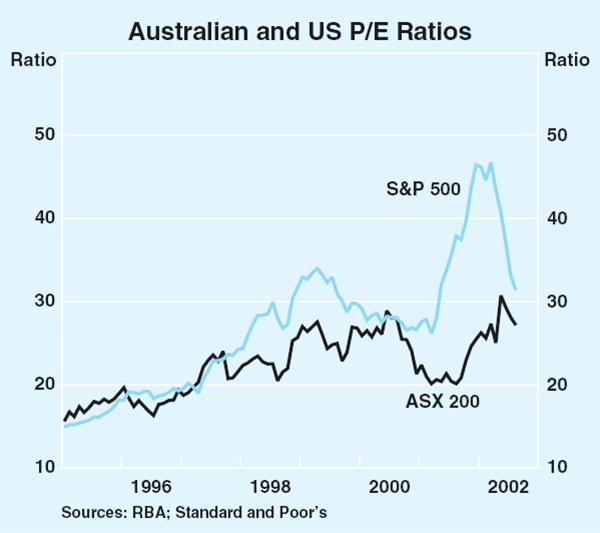
Net equity raisings for the June quarter were very strong, with non-financial companies raising $6.8 billion, more than double the amount raised in the March quarter and the strongest issuance seen in the past five years. As has been the case for the past 12 months, most raisings were through placements; initial public offerings amounted to just $1 billion. Infrastructure groups accounted for most of the funds raised through initial public offerings in the quarter. Further substantial initial public offerings from infrastructure groups are in prospect in the next month or so. There was a slight increase in buybacks during the quarter, but buybacks remain well below the levels seen in 1999 and 2000 (Graph 66).
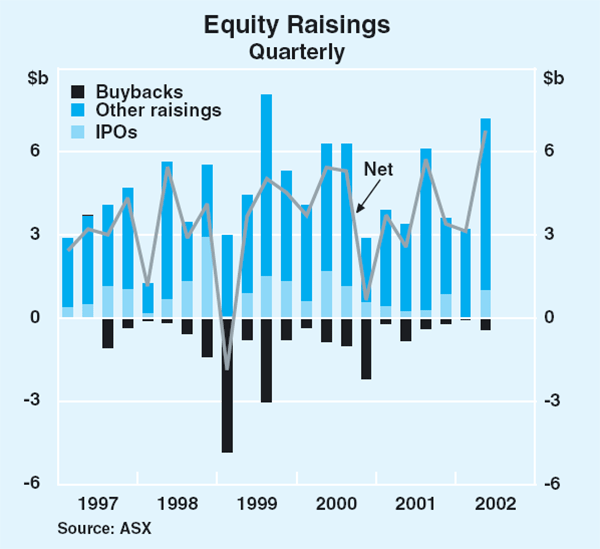
Growth in margin lending for equities and managed funds continued to be strong in the June quarter (Table 17). Total margin debt grew by 10 per cent. Over the same period margin debt in the US fell 2 per cent. Growth in both the average loan size and the number of clients remains strong. The average credit limit used and average leverage rose from the low levels seen last quarter. The 3 per cent fall in the value of securities underlying margin loans accounts for much of the increase of leverage. The number of margin calls doubled over the quarter, reflecting the fall in share prices. Banks report little difficulty with customers meeting margin calls. While protected share financing (which combines a margin loan with derivative products to ensure that the value of the share portfolio backing the loan maintains its capital value) accounts for just 6 per cent of all margin lending, it grew particularly strongly in the June quarter.
| Level at end | Growth | |||
|---|---|---|---|---|
| March 2002 |
June 2002 |
3 months to June 2002 Per cent |
12 months to June 2002 Per cent |
|
| Total margin debt ($b) | 9.7 | 10.6 | 10.0 | 25.0 |
| Credit limit ($b) | 16.2 | 16.8 | 3.7 | 27.0 |
| Value of underlying security ($b) | 21.6 | 21.1 | −2.6 | 12.8 |
| Average number of margin calls per day | 135 | 266 | 97.4 | −14.7 |
| Number of clients | 108,793 | 116,126 | 6.7 | 22.7 |
| Average loan size ($) | 88,916 | 91,595 | 3.0 | 1.8 |
| Credit limit used (per cent) | 60 | 63 | ||
| Leverage (per cent) | 45 | 50 | ||
|
Source: RBA |
||||
Assessment of Financial Conditions
The cash rate rose by a cumulative 50 basis points in recent months, which was reflected in similar increases in real short-term interest rates, though both nominal and real short-term interest rates remain low by historical standards. Real longer-term interest rates have declined, reflecting falls in nominal bond yields associated with increased uncertainty about the strength of the global recovery. Other indicators suggest financial conditions remain supportive of growth: the slope of the yield curve is positive; credit is readily available; and the real exchange rate, after rising over much of this year, has recently fallen back to its level at the beginning of the year.
Interest rates
The 25 basis point tightening in monetary policy in June lifted the cash rate to 4.75 per cent and took the cumulative tightening this cycle to 50 basis points. Nevertheless, the level of real interest rates remains low by historical standards. Using three different measures of inflationary expectations – underlying inflation, bond market inflation expectations and consumer inflation expectations – the real cash rate is 0.5 to 1.3 percentage points below its average over the period since 1992 (Table 18). The same calculations over the period since 1997, during which inflation has been around 2¼ per cent and output growth around 4 per cent, show that the current real rate is around ¾ of a percentage point below its average level. Longer-term real interest rates have fallen over the past three months, due to the sizable decline in nominal yields over this period, though they remain well above the lows reached in 2001.
| Nominal | Real – based on: | |||
|---|---|---|---|---|
| Weighted median inflation(a) |
Bond market expectations |
Consumer expectations(a) |
||
| Current level | 4.75 | 2.1 | 2.0 | 0.5 |
| 1992–2002 average | 5.7 | 3.4 | 2.5 | 1.5 |
| 1997–2002 average | 5.1 | 2.9 | 2.7 | 1.0 |
| Current deviation from: | ||||
| 1992–2002 average | −0.9 | −1.3 | −0.5 | −1.0 |
| 1997–2002 average | −0.3 | −0.8 | −0.7 | −0.5 |
|
(a) Adjusted for tax changes Sources: ABS; Melbourne Institute; RBA |
||||
As discussed in the chapter on ‘Domestic Financial Markets’, variable lending rates of financial institutions have generally moved higher, in line with the cash rate, though they also remain quite low by historical standards (Graph 67). The gap between cash rates and variable home loan rates has remained fairly steady over the past couple of years, after narrowing quite sharply through the 1990s. In contrast, the gap between cash rates and indicator lending rates on business loans not secured by residential mortgages has widened over the same period. Fixed lending rates of financial institutions for both housing and small business have begun to fall from their recent peak in June. Yields on corporate debt have not fallen as far as yields on lower-risk government debt, though the widening in the yield differential in Australia has not been as large as in the US, where concerns about corporate financial health have resulted in a sharp increase in the gap.
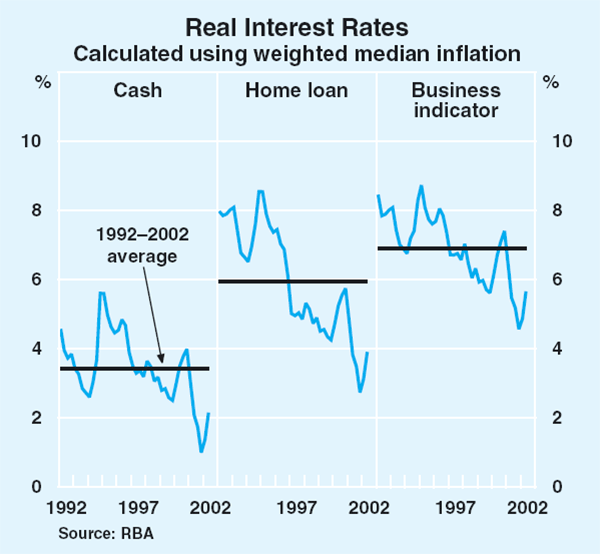
The slope of the yield curve in Australia, as measured by the difference between the 10-year bond yield and the 90-day bank bill rate, has narrowed sharply over the past three months, reflecting both higher short-term rates and lower bond yields (Graph 68). Nonetheless, the slope remains positive, consistent with perceptions of accommodative monetary policy and continued economic growth.
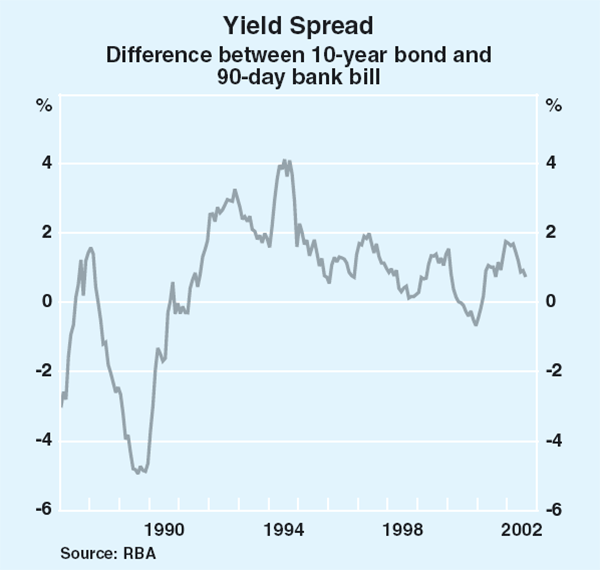
Financing activity
Total credit grew at an annualised rate of 12 per cent in the six months to June, a faster pace than over the preceding six months (Graph 69). The increase mainly reflects a pick-up in business borrowing, with business credit growing at an annualised rate of 6½ per cent over the six months to June, after contracting by about 3 per cent in the second half of 2001. As discussed in the chapter on ‘Domestic Economic Activity’, external fundraising by businesses has picked up in the first half of the year, consistent with improving corporate sentiment and a positive outlook for investment.
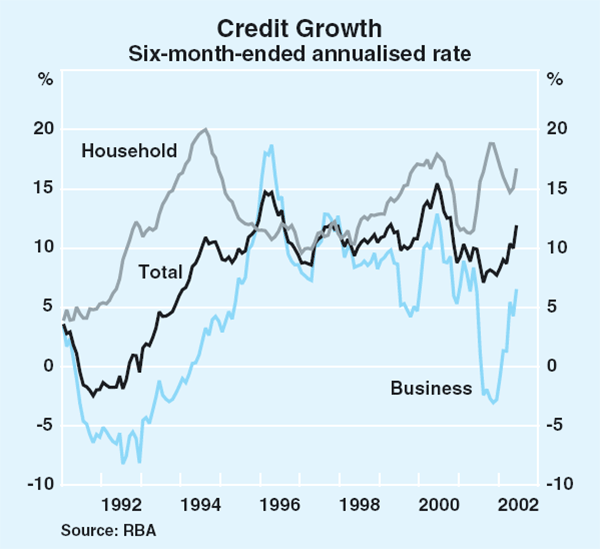
Growth in lending to households remains strong, with household credit in the six months to June increasing at an annualised rate of a little over 16½ per cent, compared with an annualised increase of 18 per cent over the previous six months. Borrowing by investors for housing has been particularly strong in recent months.
Annual growth in the broader monetary aggregates has been similar to that of credit, with M3 and broad money growing by 12.3 and 9.7 per cent respectively over the year to June (Graph 70). Over the course of the year, however, funding patterns of financial institutions have varied considerably, leading to sharp divergences in growth rates between credit and the monetary aggregates. In particular, growth in the monetary aggregates has been affected by substitution by banks between certificates of deposit and bank bills, with the latter not included in the monetary aggregates, as well as offshore borrowing by financial institutions, which is also excluded from the monetary aggregates.
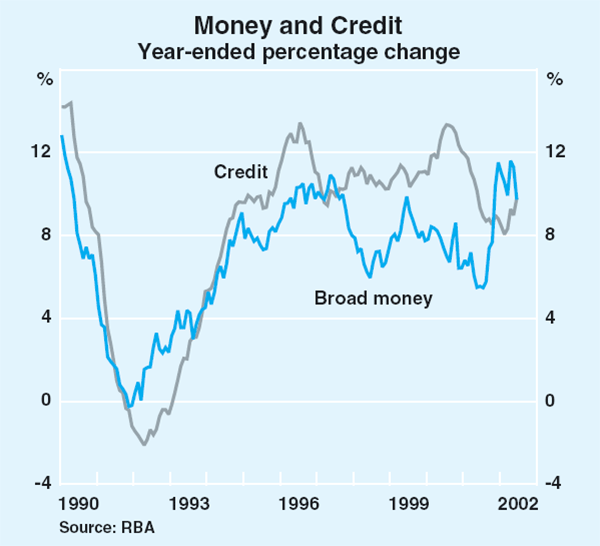
Real exchange rate
As discussed in the chapter on ‘International and Foreign Exchange Markets’, the Australian dollar, after rising strongly over much of the first half of the year, has depreciated more recently and in trade-weighted terms is broadly unchanged over the year to date. The real exchange rate, which adjusts for inflation across our trading partners, rose by about 7 per cent over the year to the June quarter, but remained around 8 per cent below its 1990s average (Graph 71). With the current level of the real exchange rate only slightly above the historical low reached in 2000, competitive conditions for the export and import-competing sectors of the economy remain favourable.
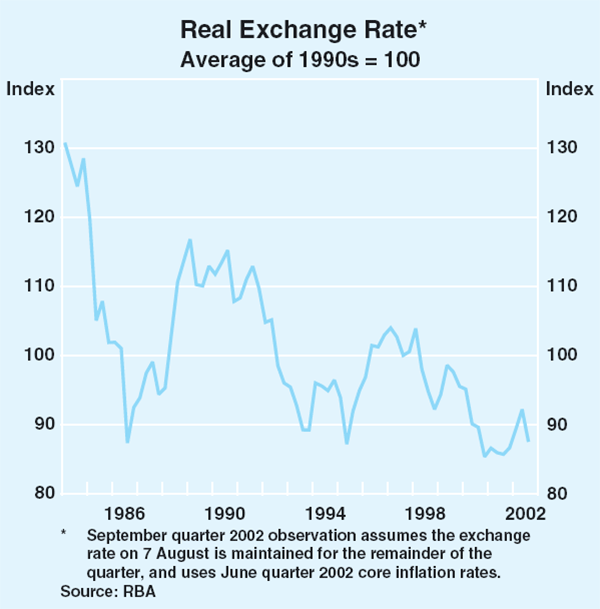
Inflation Trends and Prospects
Recent developments in inflation
Consumer prices
The Consumer Price Index (CPI) increased by 0.7 per cent in the June quarter and by 2.8 per cent over the year (Table 19, Graph 72). Measures of underlying inflation increased by around 0.6 per cent in the quarter, and by between 2½ and 3¼ per cent in year-ended terms, reflecting the dispersion in the various measures of underlying inflation in previous quarters (Graph 73). As noted in the May Statement, the exclusion-based measures of underlying inflation have been at the upper end of this range as they include some items whose prices have risen rapidly over the past year, such as holidays, and exclude others whose prices have fallen, such as petrol. The Bank's assessment is that the statistical measures of underlying inflation, which are around 2½ per cent, are currently providing a more accurate reading of underlying inflation.
| Quarterly | Year-ended | ||||
|---|---|---|---|---|---|
| March quarter 2002 | June quarter 2002 | March quarter 2002 | June quarter 2002 | ||
| CPI | 0.9 | 0.7 | 2.9 | 2.8 | |
| – Tradables | 0.6 | 0.8 | 2.3 | 1.8 | |
| – Non-tradables | 1.1 | 0.6 | 3.6 | 3.8 | |
| Underlying inflation | |||||
| Weighted median(a) | 0.5 | 0.6 | 2.8 | 2.5 | |
| Trimmed mean(a) | 0.6 | 0.5 | 2.9 | 2.5 | |
| CPI excluding volatile items | 1.0 | 0.6 | 3.6 | 3.3 | |
| Market goods and services excluding volatile items | 0.8 | 0.6 | 3.6 | 3.1 | |
|
(a) For more information on these measures see ‘Box D: Underlying Inflation’ in the May 2002 Statement on Monetary Policy. Sources: ABS; RBA |
|||||
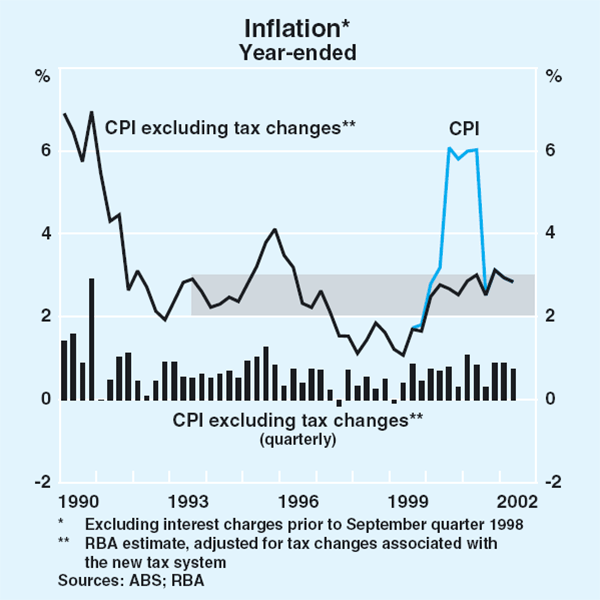
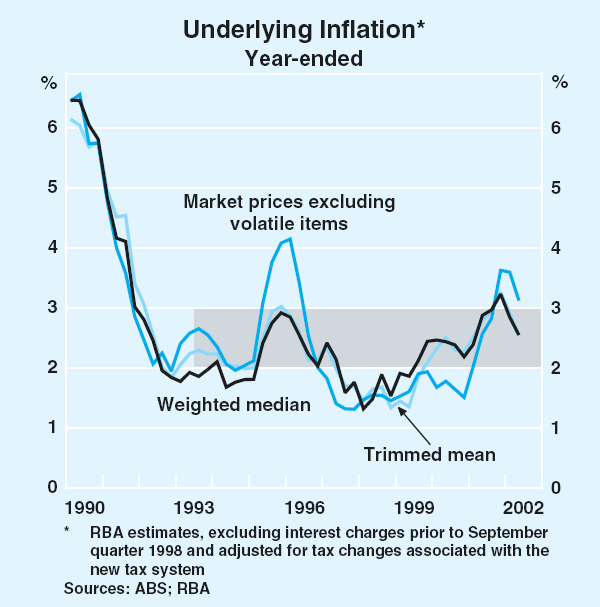
The largest contribution to the CPI in the June quarter was made by petrol prices, which increased by 7.5 per cent, although they fell by 5.1 per cent over the year, reflecting movements in world oil prices. Other major contributors to the quarterly increase in the CPI were higher prices for hospital and medical services (largely due to higher private health insurance premiums), overseas holiday travel and higher costs of building a new home.
There were also a few notable price falls in the quarter. Fruit and vegetable prices fell by 5.8 per cent, to be little changed over the year. Motor vehicle prices fell by 0.9 per cent due to end-of-year discounting and the prices of audio, visual and computing items continued their ongoing decline.
The price of tradable goods rose by 0.8 per cent in the June quarter, and by 1.8 per cent over the year. Abstracting from recent movements in oil and food prices, which have significantly affected these numbers, the price of tradable goods increased by 0.6 per cent in the quarter to be 2.1 per cent higher over the year (Graph 74). The continued easing in the rate of increase of traded goods prices suggests that the inflationary impulse from the earlier depreciation has largely dissipated. In contrast, non-tradables prices increased by 0.6 per cent in the June quarter, having grown by around 1 per cent in each of the previous three quarters, reflecting the strength in the domestic economy. Over the year to the June quarter, non-tradables prices rose by 3.8 per cent.
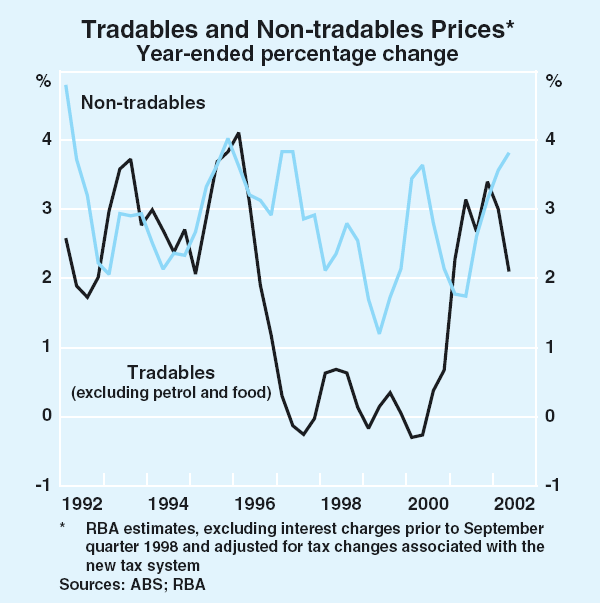
Producer prices
Producer prices, which provide a measure of input costs, have remained moderate in the June quarter, as higher oil and building construction prices were offset by the effects of the exchange rate appreciation over the first half of the year. Final stage producer prices rose by 0.2 per cent in the quarter, and intermediate and preliminary stage prices increased by 0.3 and 0.7 per cent respectively (Table 20).
| June quarter 2002 | Year to June quarter 2001 | Year to June quarter 2002 | |
|---|---|---|---|
| Preliminary | 0.7 | 5.5 | −1.1 |
| – Domestic | 0.9 | 4.7 | 0.4 |
| – Imported | 0.2 | 11.0 | −9.2 |
| – Excluding oil | −0.5 | 4.4 | 0.3 |
| Intermediate | 0.3 | 5.2 | −0.3 |
| – Domestic | 0.5 | 4.4 | 1.0 |
| – Imported | −1.0 | 10.1 | −8.2 |
| – Excluding oil | −0.6 | 4.4 | 0.7 |
| Final(a) | 0.2 | 3.4 | 0.6 |
| – Domestic | 0.9 | 2.2 | 2.4 |
| – Imported | −3.2 | 8.8 | −6.8 |
| – Excluding oil | −0.2 | 2.9 | 1.1 |
|
(a) Excluding exports Sources: ABS; RBA |
|||
Abstracting from oil prices, the prices of imported components at all three stages of production fell by around 3¼ per cent in the June quarter. This is consistent with the appreciation of the exchange rate in the first half of 2002, and continuing downward pressure on world prices for goods such as electrical equipment, industrial machinery and motor vehicles. The large increases in the domestic component of preliminary producer prices in late 2000 now appear to have passed through to final producer prices. Excluding oil, the domestic component of final producer prices rose by 3 per cent over the year to the June quarter.
Business surveys also suggest that upstream cost pressures are subdued (Graph 75). The NAB survey reported that growth in purchase costs eased to 0.3 per cent in the June quarter and businesses expect a similar moderate rise in the September quarter. The net balance of firms experiencing cost increases in the June quarter was steady according to the ACCI-Westpac manufacturing-based survey, although the share of firms expecting a rise in costs in the September quarter increased.
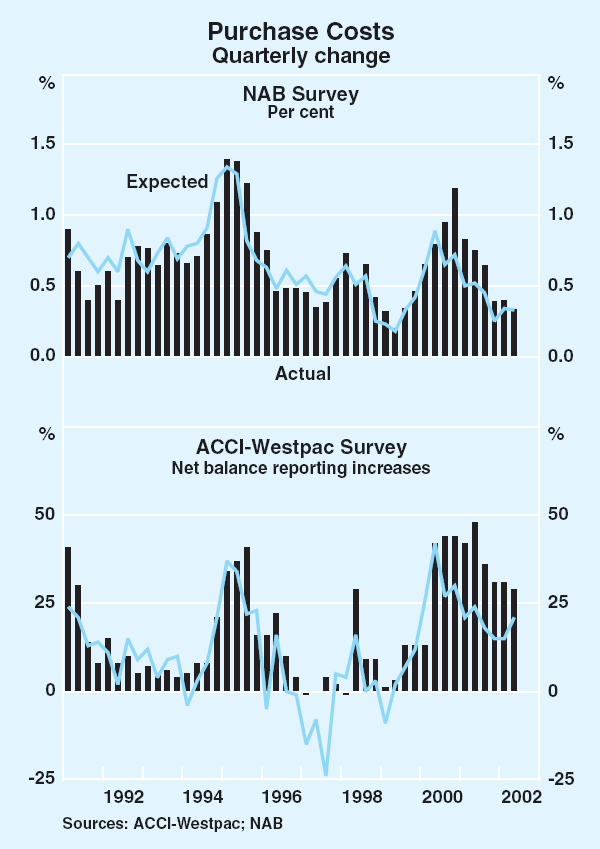
Labour costs
Over the past year, different measures of labour costs have recorded a range of outcomes, in part reflecting differences in construction and scope (Box B), but in general most measures indicate that wage pressures remain contained. Recently, however, signs have emerged to suggest that the downward forces acting on wages over the past year may now have begun to abate, and some signals of upward pressures have become apparent.
The wage cost index (WCI) for total pay rose by 3.1 per cent over the year to the March quarter (Table 21, Graph B1), down from the peak of 3.7 per cent recorded in the year to the March quarter 2001. At the industry level, the fastest wage growth according to this measure was recorded in the electricity, gas and water industry (4.6 per cent), and in the finance and insurance industry (4.0 per cent), while the slowest growth was recorded in the transport and storage industry (2.4 per cent) and the wholesale and retail trade industries (both 2.6 per cent).
| March quarter 2001 | September quarter 2001 | March quarter 2002 | |
|---|---|---|---|
| Wage cost index(a) | 3.7 | 3.6 | 3.1 |
| Federal enterprise agreements(b) | |||
| New agreements | 3.8 | 3.8 | 3.6 |
| Current agreements | 3.6 | 3.7 | 3.8 |
| Average weekly earnings survey | |||
| AWOTE | 4.6 | 5.1 | 6.2 |
| AWE | 5.6 | 4.0 | 4.1 |
| Average compensation of employees (national accounts) | |||
| Total | 3.5 | 4.0 | 3.7 |
| Excluding superannuation | 2.9 | 4.0 | 3.9 |
|
(a) Total pay excluding bonuses Sources: ABS, DEWR |
|||
Recent data on enterprise bargaining agreements from the Department of Employment and Workplace Relations also indicate that the pace of wage growth remains moderate. New federal enterprise agreements ratified in the March quarter granted an average annualised wage increase of 3.6 per cent, although this outcome partly reflected an unusually high representation of retail sector agreements certified in the quarter, which are typically at the lower end of the wage growth spectrum. The average annualised wage increase for renegotiated private sector agreements in March was 3.4 per cent, which is the same as the agreements they replaced. Wage increases for the stock of existing agreements have edged up over the past year or so, but remain relatively moderate at 3.8 per cent. According to the latest Mercer Quarterly Salary Review, executives' base salaries rose by 4.6 per cent over the year to June, which was unchanged from the previous quarter. Growth in the salaries of office-based workers was also unchanged at 4.0 per cent.
In contrast to other wage indicators, average weekly ordinary-time earnings of full-time adults (AWOTE) continue to record strong growth. AWOTE grew by 1.5 per cent in the March quarter, and by 6.2 per cent over the year. Compensation per hour in the national accounts over the same period has risen by 5.3 per cent. On a per employee basis, however, compensation has risen by 3.7 per cent, the difference reflecting a decline in average hours worked. The corresponding measure of growth in unit labour costs based on compensation per hour worked picked up slightly over the year to March, but still remains subdued.
Total labour costs reported in the NAB survey increased modestly in the June quarter, and firms expect labour cost growth to pick up in the September quarter to levels close to the average over the past 10 years. According to the NAB and ACCI-Westpac surveys firms have also reported greater difficulty attracting suitable labour.
In its Safety Net Review decision, announced on 9 May, the Australian Industrial Relations Commission granted an $18 per week wage increase across all award rates of pay. Consequently, the federal minimum wage rose by 4.4 per cent to $431.40 per week.
Inflation expectations
Inflation expectations of consumers, as measured by the Melbourne Institute survey, have remained in a range between 3½ and 4½ per cent since mid 2000 (Graph 76). Expectations for the year ahead rose to 4.3 per cent in July, after falling to 3.8 per cent in June. Business surveys generally indicate that inflationary pressures are modest. The NAB survey reported that businesses expect inflation in final product prices to be 0.5 per cent in the September quarter, and 0.4 per cent for retail prices. The latest Dun & Bradstreet survey, which covers the manufacturing, wholesale and retail sectors, reported that expectations remain subdued, with few firms expecting to raise their prices in the September quarter.
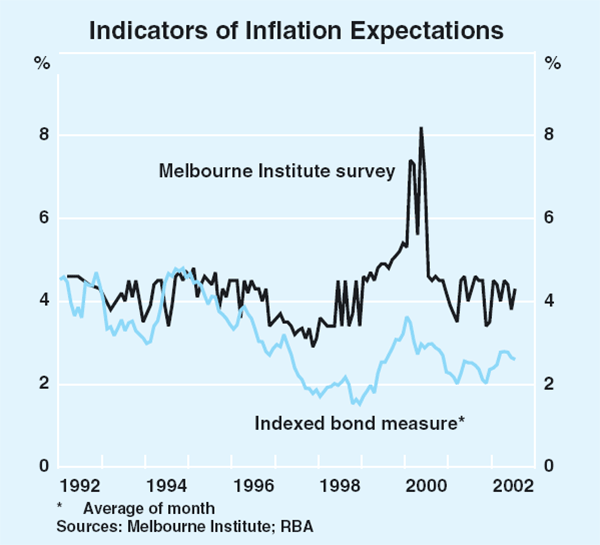
Longer-term inflation expectations of investors, measured by the difference between 10-year bond yields and indexed bonds, increased in the June quarter to around 2¾ per cent, from around 2½ per cent in the March quarter. Over the September quarter to date, bond market inflation expectations have eased slightly to around 2.6 per cent. Following the release of the CPI, financial-market economists surveyed by the Bank have updated their forecasts for inflation (Table 22). The median inflation forecast for the year to June 2003 is 2.4 per cent, roughly stable since the beginning of the year, and 2.5 per cent for the year to June 2004. The median inflation expectation of trade union officials, as surveyed by the Australian Centre for Industrial Relations Research and Training (ACIRRT), has moderated to 3.0 per cent from 3.5 per cent reported last quarter. The median expectation for the year to June 2004 is 3.5 per cent.
| Year to June 2003 | Year to June 2004 | ||||
|---|---|---|---|---|---|
| February 2002 | May 2002 | August 2002 | August 2002 | ||
| Market economists(a) | 2.4 | 2.5 | 2.4 | 2.5 | |
| Union officials(b) | 3.7 | 3.5 | 3.0 | 3.5 | |
| (a) RBA survey (b) ACIRRT survey |
|||||
Inflation outlook
The Bank's assessment is that underlying inflation is currently around 2½ per cent, which is consistent with the forecasts presented in the May Statement. CPI inflation, at 2.8 per cent on a year-ended basis, remains slightly higher than underlying inflation, and next quarter may rise temporarily, reflecting the dropping out of the low September 2001 outcome from the year-ended calculation.
Underlying inflation, however, is likely to remain at or slightly below 2½ per cent over the second half of 2002. Wages and labour cost increases have remained contained to date and are generally not pressuring business margins, though there are some pressures from rising insurance premiums and utility prices. Increases in producer prices have also been modest, and business surveys continue to report subdued rises in input prices. In part this reflects the effect on traded goods prices of the appreciation of the exchange rate in the first half of the year, and the ongoing quiescence in world prices, particularly for electrical and computing equipment.
However, the labour market has improved since the beginning of the year, and survey data suggest that labour is becoming more difficult to find. A continuation of the robust growth in the Australian economy would see capacity utilisation rising over the period ahead, leading over time to a pick-up in wage outcomes and rising inflationary pressures. Hence, as stated in the May Statement, the Bank's assessment is that underlying inflation, after being around the middle of the target band in 2002, is likely to increase during 2003. This assessment is predicated on the usual technical assumptions that the exchange rate and oil prices remain around recent levels. It also assumes a continuation of the modest recovery in the global economy.
The recent developments in financial markets have increased the risk that global growth will be weaker than expected, with a consequent adverse effect on the Australian economy. While it is difficult to estimate the size of such effects at this stage, slower global and domestic growth, together with downward pressure on world prices, would reduce the scope for domestic price increases, although this may be offset to some extent by a lower exchange rate than would otherwise be the case. On the other hand, it is possible that global output will be stronger than expected if the volatility in financial markets proves to be short-lived, given that policy settings in most countries remain very expansionary.
Box B: Measures of Labour Costs
The various measures of labour cost growth in Australia can at times present quite different signals about wage trends (Graph B1). These differences arise, in part, because the series are designed to measure different concepts. Of the most commonly used aggregate measures, average weekly earnings (AWE), average weekly ordinary time earnings (AWOTE) and the national accounts measure of average compensation are all ‘wage bill’ measures designed to measure the average level of wages or labour costs per employee, whereas the wage cost index (WCI) is designed to measure wage changes for a basket of constant quality jobs.[1] The measures can also diverge because of their use of different information sources and the inclusion or exclusion of non-wage labour costs.
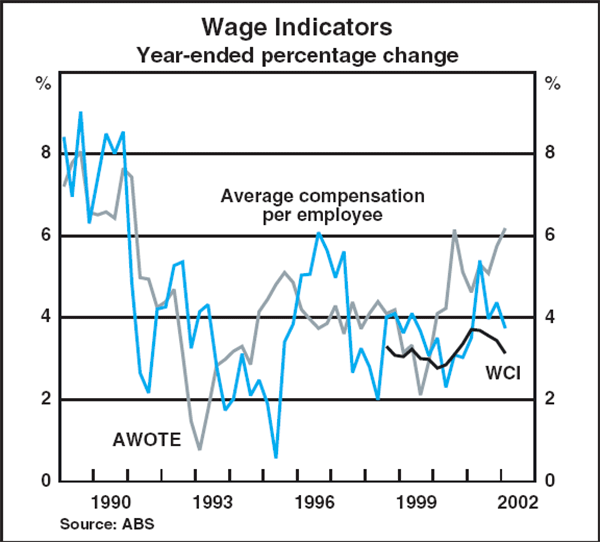
AWE and AWOTE are both sourced from the Average Weekly Earnings survey and exclude non-wage labour costs such as severance payments and superannuation contributions. Because these measures are based on estimates of the wage bill per employee, their movements will in principle reflect both changes in wage rates and compositional changes in the workforce. For example, the AWE estimate can be affected by changes in the share of full-time and part-time workers in the sample surveyed, as part-time workers tend to have lower weekly earnings. AWOTE will not be affected in this way, as it is based only on full-time jobs, which means it should provide a more accurate indication of changes in the hourly wage. Both series, however, can be affected by other sources of compositional change. For example, a rise in the share of workers in higher-wage jobs in the sample will tend to increase average earnings per worker, even if the wage paid remains unchanged, and thereby will boost the estimate of wages growth obtained from these series.
The national accounts measure of average compensation per employee is conceptually similar to the other wage-bill measures, but differs from them in two respects: it is derived from a different survey, and it incorporates a broad measure of non-wage labour costs, including severance pay and superannuation. The historical data presented in Graph B2 suggest that the inclusion of these non-wage labour costs usually makes only a relatively small difference to the estimate of the growth in labour costs. Nonetheless this series has at times diverged quite substantially from those derived from the AWE survey, with much of the difference apparently a result of differences in survey design.
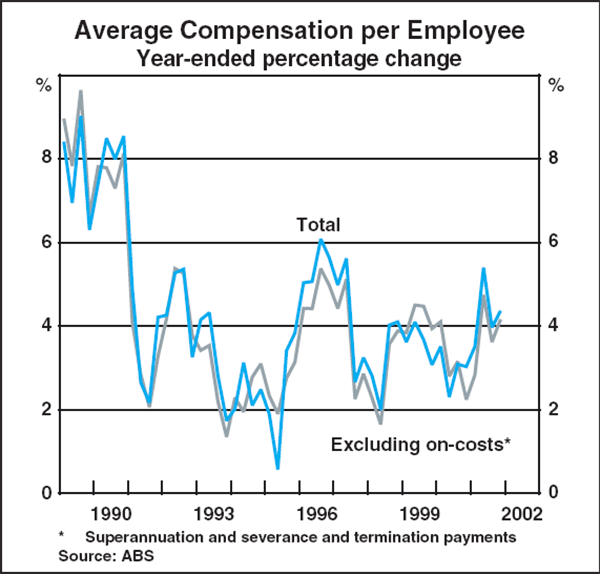
Unlike the three average earnings measures discussed above, the WCI is designed to measure wage changes rather than levels. It measures wage rates[2] for a set of constant quality jobs and is analogous in its construction to the Consumer Price Index. As such, it is less subject to the influence of compositional change and hence is less volatile than the other measures. A consequence of this construction is that the average growth rate of the WCI over time may differ from the growth in the wage-bill measures. In particular, given the tendency over time for lower-skilled jobs to be replaced by higher-skilled jobs which generally attract higher earnings, the WCI will record a lower growth rate than the other measures in the medium term.
In estimating the growth in unit labour costs (that is, labour costs adjusted for productivity) it is necessary to use wage and productivity estimates that are conceptually consistent. In particular, the effects of compositional change, which over time boosts both wages and productivity, need to be consistently treated. Available measures of productivity growth derived from the national accounts include these compositional effects and are therefore conceptually consistent with the wage-bill measures.[3] Because the WCI is designed to measure wage changes associated with specific jobs, it is difficult to construct a corresponding measure of productivity to enable a measure of unit labour costs to be calculated from this series. In particular, it would not be valid to estimate the growth in unit labour costs by adjusting the WCI using national-accounts based estimates of productivity. This would on average result in an underestimate of growth in unit labour costs, since compositional effects boosting wages and productivity would be excluded from the WCI but included in the productivity measure.
These considerations suggest that the appropriate choice of wage indicator depends upon the purpose for which it is being used. Wage-bill measures are conceptually consistent with available measures of productivity for the purposes of estimating growth in unit labour costs. However, these measures are relatively volatile as a result of short-term compositional changes in the workforce. The WCI is less volatile and may therefore be useful in assessing short-term wage trends, but it is not directly comparable with available productivity measures.
Footnotes Box A
The stock of housing debt comprises loans outstanding from financial intermediaries and the stock of housing loans that have been securitised and hence are not on the books of financial intermediaries. [1]
See ‘Recent Developments in Housing: Prices, Finance and Investor Attitudes’, Reserve Bank of Australia Bulletin, July 2002, pp 1–6. [2]
Footnotes Box B
These various measures of labour costs are discussed in ‘Alternative Measures of Labour Costs’, Box C, Statement on Monetary Policy, November 2000. [1]
The WCI does not include non-wage costs such as superannuation and payroll tax, although such a measure is currently being developed by the ABS. [2]
In practice, AWOTE cannot be easily matched with an equivalent productivity measure, as there is no separate measure of output of full-time workers. [3]