Bulletin – May 2000 Semi-Annual Statement on Monetary Policy
Download the complete Statement 521KB
The Australian economy has continued to perform strongly during the past year. In 1999 growth once again exceeded 4 per cent, and a good pace appears to have been maintained in the early part of 2000. By mid year, the economy will have recorded nine years of continuous expansion. Unemployment has continued to fall, to be below 7 per cent of the labour force for the first time in almost a decade. These developments have been accompanied, in the past year or two, by a gradual increase in the rate of inflation.
In terms of economic growth, the international environment remains a favourable one for the Australian economy. The US economy has continued to expand rapidly, exceeding the expectations of most observers and official forecasters. In Europe growth is also picking up, and economic recoveries across most of the east Asian region are proceeding more quickly than had been expected. The situation in Japan is more difficult to assess, but, overall, there is no doubt that the general trend for the world economy over the past year has been one of increasing strength. Projections have been revised upwards, such that world growth in 2000 and 2001 is expected to be noticeably faster than in 1999.
With improved growth prospects in most countries, and signs of over-heating in the United States, central banks in most advanced countries have been raising official interest rates over the past six months. Over that period the level of short-term interest rates around the world has risen by between 100 and 150 basis points. Most of the rise was designed to restore interest rates to more normal levels from the unusually low rates that had persisted in 1998 and the first half of 1999, but for some countries exchange rate weakness was also adding to pressure on future inflation.
Although all developed countries, except Japan, have been part of this process, developments in the United States have played a major role. With growth still very strong, a discernible pick-up in price and wage inflation and rapidly increasing equity prices (at least until very recently), the expectation of further tightening of US monetary policy has underpinned developments in world financial markets. Much will depend on the success of US monetary policy in reining back the economy in a timely manner, and this will depend in part on a return to more subdued sentiment in the equity markets. This explains the relief with which the recent falls in share prices, particularly technology stocks, were greeted by those hoping for stability in world financial markets.
In international currency markets, the US dollar has generally been under upward pressure, and most currencies with the exception of the yen have depreciated. The Australian dollar has weakened more than most, notwithstanding continuing good domestic economic performance and an improving world economic outlook, a development normally supportive of the currency.
Economic growth in Australia is likely to remain quite robust over the year ahead, even though its composition is shifting. Consumer spending, which had been exceptionally strong in 1999, has slowed. This is likely to mean some slowing in the growth of domestic demand, from the very rapid pace it recorded last year. Nonetheless, it would be surprising if consumer spending were to remain as weak as suggested by recent retail trade data, given the continued gains in household income in the recent period, the high level of wealth, and the prospect of substantial tax cuts in the second half of the year. At the same time, exports are now clearly benefiting from the stronger international environment. Hence, while the growth of domestic demand may be easing, external demand should contribute to growth of the economy in 2000, having been a drag on growth for much of the previous two-year period.
Developments in economic activity will be unusually hard to interpret during the remainder of 2000 because of the important influence of tax reform on the timing of expenditures. The effects will differ quite markedly across the different types of expenditure, with consumer spending and housing activity being brought forward in net terms, while some business investment and car purchases could be delayed. In the case of retail spending, international experience suggests that much of this impact may be concentrated quite tightly in the months either side of the implementation date. The effect on housing activity will be spread over a longer period, with some GST-related demand already evident in data for late 1999 and early 2000. While the overall package, in net terms, will shift demand from the second half of the year into the first half, demand in the second half will be boosted by substantial income tax cuts and increases in government benefits to be introduced on 1 July.
Inflation has gradually increased during the past two years, to be running, according to underlying measures, at an annual rate of around 2¼ per cent, up from around 1½ per cent two years ago. CPI inflation has increased more markedly. While higher petrol prices have contributed significantly to the rise in the headline rate, the increase in underlying inflation more generally reflects the sustained strength of domestic demand in recent years, which has seen a gradual increase in levels of capacity utilisation across the economy. Wage pressures to date have remained moderate, although there have been signs of tightening in labour market conditions, with employers reporting increased difficulties in obtaining suitable labour, and the unemployment rate falling. In these circumstances there is some risk that wage pressures will strengthen, particularly given recent increases in inflation expectations and the prospect of some high CPI figures later in the year.
The recent decline in the exchange rate may also have implications for the course of consumer prices over the next year or more. The Australian dollar moved significantly lower against most major currencies in the early part of the year and, in the past month, has averaged a level 7 per cent below its 1999 average in import-weighted terms. This weakness may not persist. If it does, however, or if the currency continued to decline, it would put upward pressure on prices for traded goods and services. The pass-through into consumer prices could be stronger than it was in 1997 and 1998 when more competitive conditions, both domestically and internationally, contained price rises which would otherwise have flowed from a weak exchange rate. Added pressure on prices from this source, at a time when domestic pressure may be intensifying, would clearly be unhelpful.
In the near term, the most significant influence on the CPI will be the implementation of tax reform on 1 July. CPI inflation in year-ended terms will, for the first year following implementation, be substantially higher than the target, with the peak effect of the package occurring in the September quarter 2000. As has been made clear in previous Statements, the Bank intends to abstract from these short-run tax effects on the price level in conducting monetary policy, but will remain vigilant against second-round wage and price increases that might lead to an escalation in ongoing inflation. There are good prospects that such second-round effects can be avoided, provided it is widely understood that part of the initial price impact of the package is temporary, and that the overall price impact will be smaller, and more than fully compensated by income tax cuts and increases in government benefit payments. Tax effects aside, and on the assumption that there are no second-round impacts of the tax package or further large falls in the exchange rate, the Bank expects that the recent policy changes should keep inflation within the 2–3 per cent range over the coming year to eighteen months, although, given the pressures identified above, the likelihood is that inflation will be in the upper half of the range.
In the past six months, the Bank has tightened monetary policy on four occasions, raising cash rates by a total of 125 basis points, to a current level of 6 per cent. In doing so, the Bank judged that the fairly expansionary policy setting previously in place was no longer warranted, given the economy's changing circumstances. This judgment reflects an assessment of the changing balance of risks facing the economy. That balance has shifted over the past year from a situation where the predominant risk was that of faltering growth and persistent undershooting of the inflation target, to one where the risk of rising inflation has attained greater importance. The most recent interest rate adjustments in April and May continued the process of bringing interest rates to levels where that risk would be reduced. This is in line with the broader goal of promoting sustainable growth by avoiding the build-up of inflationary pressures.
International Economic Developments
The world economy is estimated to have grown by around 3¼ per cent in 1999, a considerable improvement from growth of 2½ per cent recorded in 1998 (Table 1), and significantly in excess of most forecasts of a year ago. At that time, world growth was expected to remain weak in 1999, on the basis that the US economy would slow to below trend rates of growth, and the recovery in the emerging markets would be slow and protracted. Instead, growth in the US remained above 4 per cent in 1999 and most emerging market economies experienced a strong rebound in activity.
| 1998 | 1999 | 2000(b) | 2001(b) | |
|---|---|---|---|---|
| United States | 4.3 | 4.2 | 4.4 | 3.0 |
| Euro area | 2.8 | 2.3 | 3.2 | 3.2 |
| Japan | −2.5 | 0.3 | 0.9 | 1.8 |
| Newly Industrialised Economies(c) | −2.3 | 7.7 | 6.6 | 6.1 |
| ASEAN-4(d) | −9.5 | 2.5 | 4.0 | 4.4 |
| World | 2.5 | 3.3 | 4.2 | 3.9 |
|
(a) Using purchasing power parity weights Source: IMF World Economic Outlook, April 2000 |
||||
World GDP growth in 2000 and 2001 is now expected to exceed that in 1999. According to the IMF, the world economy is likely to grow by around 4¼ per cent in 2000 and just under 4 per cent in 2001. Moreover, the IMF argues that there is some risk that the forecast for 2000 may be revised up, if there is more momentum in the US or the euro area economies than currently projected. The outlook for the Japanese economy remains uncertain, especially given the unanticipated fall in GDP during the second half of last year.
Capital flows to emerging market economies picked up in 1999, after contracting sharply in 1998 in the wake of the Asian financial crisis. The size of capital flows remains considerably smaller than those in the years immediately preceding the crisis (Table 2).
| 1997 | 1998 | 1999 | ||
|---|---|---|---|---|
| Total | 293 | 150 | 173 | |
| Asia | 129 | 35 | 63 | |
| Europe | 38 | 36 | 26 | |
| Middle East and Africa | 31 | 13 | 20 | |
| Western Hemisphere | 95 | 66 | 64 | |
|
Source: IMF World Economic Outlook, April 2000 |
||||
Aside from the considerable effect of higher oil prices, inflation rates currently remain quite low around most of the world. But in line with the pick-up in world growth, core consumer price inflation has begun to increase in recent months in most developed countries. Concerns about the inflationary implications of the improved outlook for growth and the rise in oil prices have led to an increase in policy interest rates in many countries in recent months.
The Americas
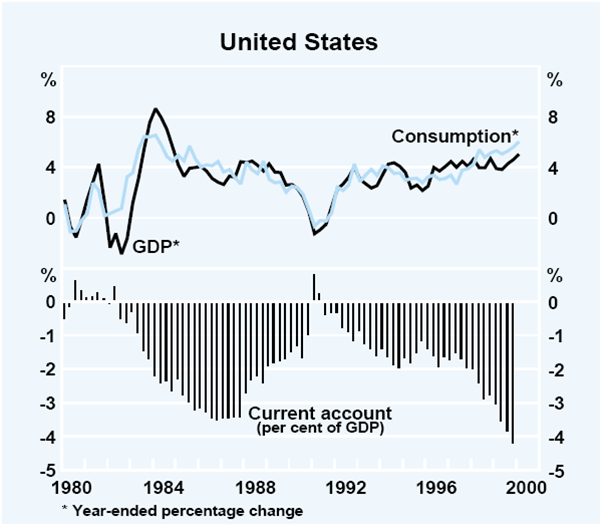
The strong momentum of the United States economy continued into 2000, with GDP increasing by 1.3 per cent in the March quarter. Over the past 4 years, GDP growth has averaged around 4½ per cent per annum (Graph 1). Household consumption expenditure has been particularly strong, increasing by 2 per cent in the March quarter, and by an average of 5¾ per cent per annum over the past 2 years. The strength of the US economy relative to the rest of the world contributed to the widening in the US current account deficit to 4¼ per cent of GDP in the December quarter.
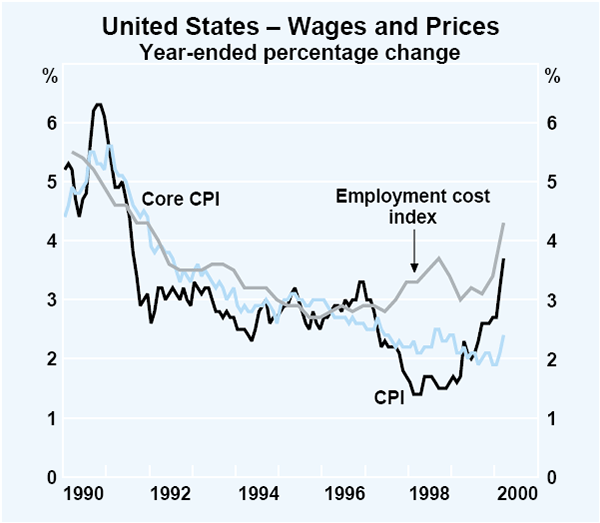
In increasing interest rates by 25 basis points in March, the Federal Reserve highlighted concerns about potential inflation. In recent months, CPI inflation has increased substantially to over 3½ per cent, largely reflecting the impact of oil prices. Core inflation also picked up sharply in March (Graph 2). Excluding food and energy prices, consumer prices increased by 0.8 per cent in the three months to March, and 2.4 per cent over the year to March. Wage pressures are also increasing, with year-ended growth in the employment cost index rising to over 4¼ per cent in the March quarter, from 3 per cent a year earlier.
The strength of the US economy continued to support activity in the rest of the Americas. Canadian GDP grew by 1.1 per cent in the December quarter last year, and by 4.7 per cent over 1999. Despite a pause in the December quarter, the Mexican economy expanded by 5.3 per cent over the past year. With the additional stimulus of an easing in monetary policy, GDP in Brazil increased by 4.2 per cent over 1999, while the Argentine economy rebounded from a recession at the beginning of 1999 to grow at an annualised rate of over 5 per cent in the second half of the year.
Japan
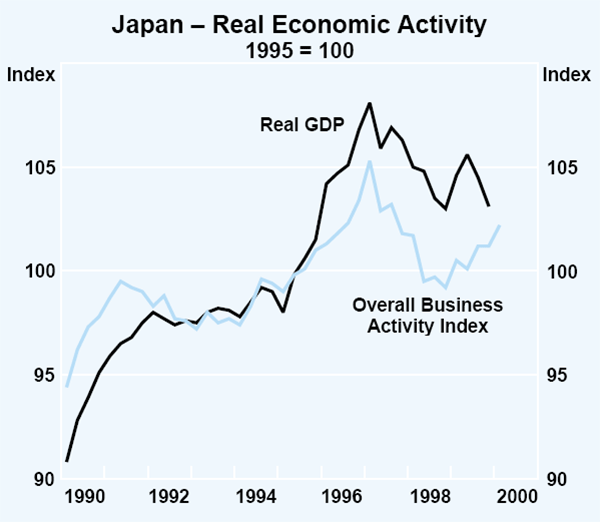
According to the national accounts, the Japanese economy lapsed back into recession in the second half of 1999, following stronger than anticipated growth in the first half of the year. Real GDP fell by 1.4 per cent in the December quarter, following a 1 per cent contraction in the previous quarter. The only component of domestic final demand that rose in the quarter was business investment spending. Most of the decrease in output was due to sharp falls in both private consumption and public investment. The rise in public spending in the first half of 1999 was not maintained in the second half of the year. However, fiscal policy should provide some support to the economy during the first half of 2000, as spending initiatives worth 1 per cent of GDP, announced in November, begin to take effect.
Other indicators paint a more positive picture of the economy than that suggested by the national accounts. The index of Overall Business Activity – a production-based measure of economic activity published by the Ministry of International Trade and Industry (MITI) – has been gradually increasing over the past year (Graph 3), driven by stronger output of service industries (especially communication and finance) and the manufacturing sector. The Bank of Japan's Tankan survey indicates that business conditions have been improving over the past 18 months and that firms expect this trend to continue into the June quarter, although the general assessment of business conditions remains below its ten-year average. Industrial production rose by 2.7 per cent in the March quarter, and has been rising since the end of 1998, buoyed by exports (particularly of electrical machinery to the rest of Asia) and the unwinding of the inventory overhang.
The reform of the financial and corporate sectors in Japan has restrained growth in the short term. Nevertheless, with some recovery in profitability and access to international finance, firms have been reporting a steady improvement in their financial position since the beginning of last year. According to the Tankan survey, firms have also reported an improvement in banks' lending attitudes.
While these developments are encouraging, much uncertainty remains about the prospects for consumption. Consumer confidence continues to improve and household spending appears to have picked up in the first few months of this year, but employment has fallen over recent months and the unemployment rate has risen to almost 5 per cent again. Spending by consumers over the past few years has been facilitated by falls in the saving rate as real household incomes have been declining since the beginning of 1998.
Non-Japan Asia
Activity continues to expand across most countries in non-Japan Asia. While domestic consumption has provided some impetus to growth, much of the improvement has been driven by the export sector.
The volume of the region's exports rose by 17 per cent in the year to the December quarter. Intra-regional trade continues to expand strongly, in part because of the high share of intermediate goods, which are processed further elsewhere within Asia and ultimately exported as final goods to countries outside the region (Table 3). This is particularly the case for exports of machinery and transport equipment, which have been a major source of export growth in Asia.
| Intra-regional exports share | Growth rate, year to December 1999 | ||
|---|---|---|---|
| 1999 | Intra-regional | Rest of world | |
| China | 30.5 | 22.5 | 14.2 |
| Korea | 31.5 | 29.0 | 20.0 |
| Malaysia | 37.5 | 29.8 | 12.7 |
| Philippines | 32.7 | 66.8 | 7.9 |
| Singapore(a) | 35.7 | 32.6 | 15.5 |
| Taiwan | 36.1 | 30.5 | 16.1 |
| Thailand | 28.8 | 26.6 | 12.6 |
|
(a) Excludes re-exports Source: CEIC database |
|||
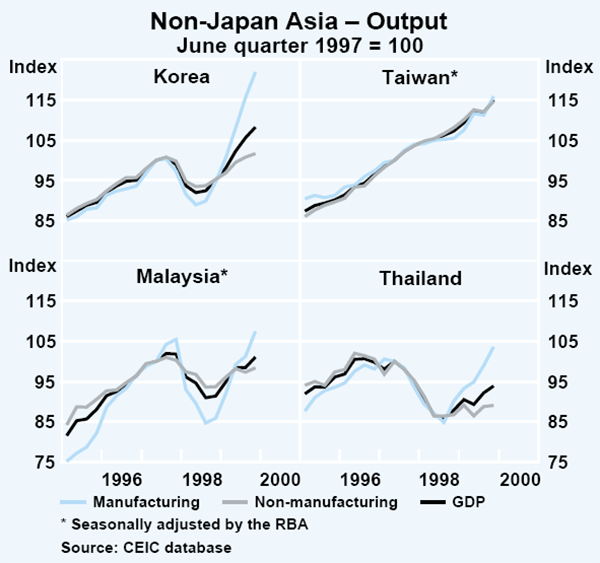
The manufacturing sector has particularly benefited from the strong rebound in exports, most notably in Korea where manufacturing output grew at an annualised rate of 25 per cent in the second half of 1999 (Graph 4). The strong growth in the manufacturing sector has led to increased rates of capacity utilisation in some of these economies. This in turn has generated a pick-up in equipment investment, but, in most countries, this has been more than offset by continued falls in construction investment.
As these economies continue to expand, the demand for funding to facilitate new investment is likely to rise. For those economies most affected by the financial crisis of 1997 and 1998, this may be inhibited by the need to further repair balance sheets in the financial sector. Total lending by financial institutions to the private sector in these economies has been falling since early 1998, despite some increase in new loans, as existing loans are being written off or repaid at an even faster pace. Some firms are raising funds through alternative sources such as equity and bond issues, particularly in Korea, although this avenue is generally restricted to larger firms.
Consumer price inflation has begun to edge up across the region, largely reflecting the increase in oil and food prices. Excluding food and energy, core consumer price inflation remains less than 5 per cent.
New Zealand
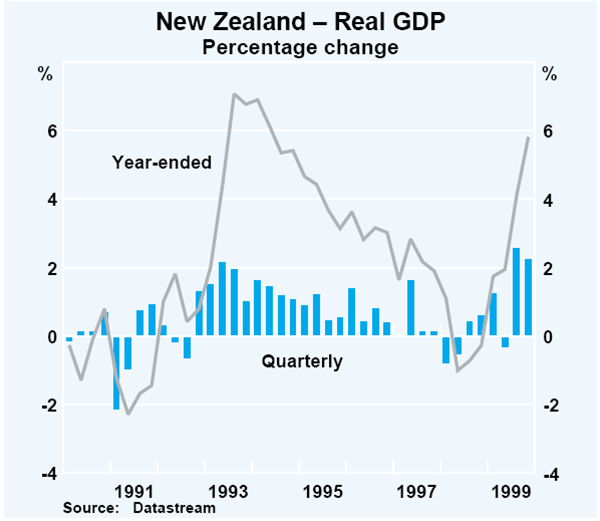
The New Zealand economy grew rapidly in the second half of 1999, expanding at an annualised rate of 10 per cent (Graph 5). Private final demand was particularly strong over the second half of the year as were exports, which recovered from a sizeable drought-related fall earlier in the year. In response to the strong pick-up in demand, the Reserve Bank of New Zealand has raised interest rates by 150 basis points since November, with the latest move being a 25 basis point increase on 19 April. The strength in activity during 1999 has been reflected in a strong pick-up in employment growth which has seen the unemployment rate fall to 6.3 per cent in the December quarter, the lowest rate since December 1996. At this stage, wages growth remains moderate and inflation remains within the inflation target band, at 1.5 per cent.
Europe
Growth in the euro area picked up in the second half of 1999 to an annualised rate of 3½ per cent, from 2 per cent in the first half of the year. The pick-up was particularly evident in the larger economies, although the smaller economies have continued to grow more quickly than the euro-area average. The export sector has been an important source of growth, reflecting the depreciation of the euro and the general recovery in global demand. The employment growth that accompanied the steady expansion in output resulted in a sustained downward trend in the euro-area unemployment rate to 9.5 per cent in February, the lowest recorded in over six years.
Reflecting the impact of higher oil prices, CPI inflation has been on an upward trend over the past year, rising to just over 2 per cent in March (Graph 6). Excluding energy, inflation remained subdued at around 1 per cent, though it is no longer declining. The potential inflationary impact of the declining euro has been a factor in the European Central Bank's deliberations on monetary policy.
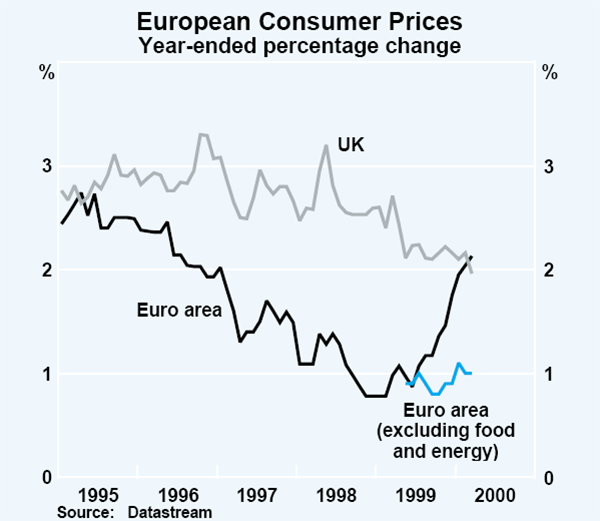
Economic activity in the United Kingdom also gained momentum over the second half of last year, driven by strength in domestic demand. The tradeables sector was relatively subdued, reflecting the strength of the pound, particularly against the euro. The labour market in the UK remained tight with the unemployment rate at 5.8 per cent in February, the lowest rate in twenty years. Wages have increased sharply, with growth of 6 per cent over the year to February. Nevertheless, despite the labour market pressures and the recent increases in world oil prices, consumer price inflation has remained steady over the past twelve months at around 2–2¼ per cent, aided by the appreciation of the pound.
International Financial Markets
With economic activity proving to be stronger than anticipated and signs of inflationary pressures rising, central banks in most industrialised countries have lifted policy interest rates to less accommodative settings.
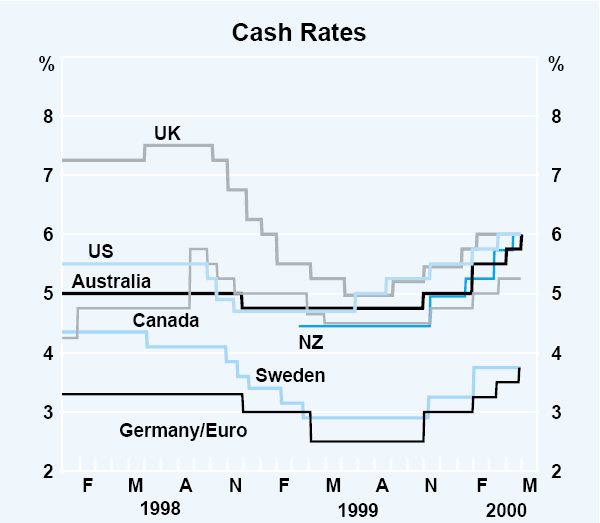
This process of global monetary tightening began in the United States in June last year. The United States has now raised the Fed funds target by 125 basis points to 6 per cent in a series of 25 basis point increases. This has lifted the rate back to its early 1995 peak. Financial markets are pricing in additional monetary tightenings by the end of the year. While the Fed has adopted a ‘gradualist’ approach to tightening so far this year, several members of the Federal Open Market Committee (FOMC) have recently noted that rates might need to increase more aggressively should imbalances continue to build and stronger signs of a pick-up in inflation emerge. Signs that labour costs are accelerating have prompted the market to push up their expectations of the size of the prospective tightening at the forthcoming FOMC meeting.
Interest rate increases in other English-speaking countries have been similar. The Bank of England has increased official rates by 100 basis points in four steps to 6 per cent, while the Reserve Bank of New Zealand has increased rates by 150 basis points to 6 per cent. The Bank of Canada has increased rates by less – 75 basis points – to 5.25 per cent, though recently it has begun to follow the US Fed closely, adjusting rates the day following each of the FOMC's announcement so far this year (Graph 7 and Table 4).
|
Increases since 1999 low Basis points |
Level now Per cent | |
|---|---|---|
| US | 125 | 6.00 |
| UK | 100 | 6.00 |
| Canada | 75 | 5.25 |
| Australia | 125 | 6.00 |
| New Zealand | 150 | 6.00 |
| Europe | 125 | 3.75 |
| Sweden | 85 | 3.75 |
| Denmark | 125 | 4.10 |
| Switzerland | 125 | 2.50–3.50 |
As growth in the Euro 11 region accelerated and broadened during the second half of 1999, the European Central Bank began to move official rates back to a more neutral footing. To date, it has increased rates by 125 basis points to 3.75 per cent. Also, so far in the current tightening phase, Denmark's central bank has increased rates by the same amount to 4.10 per cent, Sweden by 85 basis points to 3.75 per cent and the Swiss by 125 basis points to a target range of between 2.5 and 3.5 per cent. While the increase in rates has been broadly similar across countries, the level of short-term rates in Europe remains somewhat lower than in English-speaking countries, largely because European economies are at a less advanced stage of their economic expansions and have lower inflation.
Japan remains an exception to the tightening cycle. Continued weakness in consumption, coupled with the large output gap and no inflation, has meant that the Bank of Japan has continued to maintain its zero-interest rate monetary policy.
With global short-term interest rates on the rise, share markets in most countries have been prone to increasing volatility over recent months. Share price valuations had previously risen to well above historical norms, as buyers reacted to sustained high growth of productivity in the United States. Share prices of so-called ‘new economy’ stocks, largely those in the technology, media and the communication sectors, rose to particularly high levels, with many commentators arguing that they could not be sustained. While this phenomenon had its origins in the US, it was repeated around the world with remarkable consistency.
In the US, the technology-rich Nasdaq index saw dramatic gains through to the beginning of March as investors dumped ‘old’ economy stocks for ‘new’, with the index rising by over 20 per cent over the first couple of months of 2000, on top of a rise of more than 80 per cent in the previous year (Graph 8). During this period, traditional share price indices such as the Dow Jones and the S&P 500 declined noticeably. Growing investor perceptions that there seemed to be a substantial element of a ‘bubble’ in technology stock prices saw the Nasdaq index peak in March and then fall substantially. Downward pressure intensified in mid April due to increasing concerns that stronger inflation data could trigger more aggressive tightening by the Fed. This weighed on broad market indices, not just technology stocks. The broadest share price index available in the US, the Wilshire 5000, which covers over 90 per cent of all equities listed in the US, at one stage had declined by about 15 per cent since its peak in mid March. This is around its level prior to the start of the tightening process in June last year.
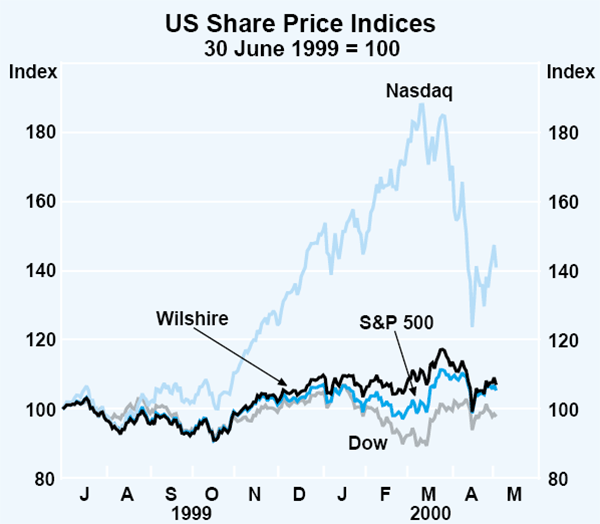
Thereafter, however, as has happened on several other occasions in the past few years, buyers re-entered the market, supposedly bargain hunting, and share prices recovered. Most broadly based indices in the US are now showing only modest falls from their peaks.
Share markets in other countries have followed a similar course (Graph 9). Indices in those countries with relatively higher weightings of technology stocks – such as Germany and Canada – have been more volatile. They rose to record highs in March, came back sharply in line with the fall in the Nasdaq in the US, and subsequently have rebounded. Markets in most developed countries are down by around 6–8 per cent since recent peaks.
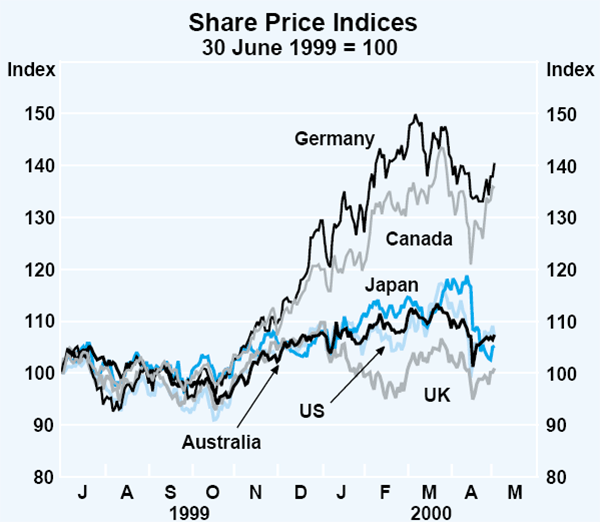
The Japanese stock market had been very strong through the second half of 1999 as domestic economic conditions continued to improve, and up until mid April, appeared immune to the weakness in markets elsewhere. However, the Nikkei then fell in sympathy with the large falls in the Nasdaq, and has been slower to enjoy the recovery seen in most other markets. It is about 12 per cent below its recent peak.
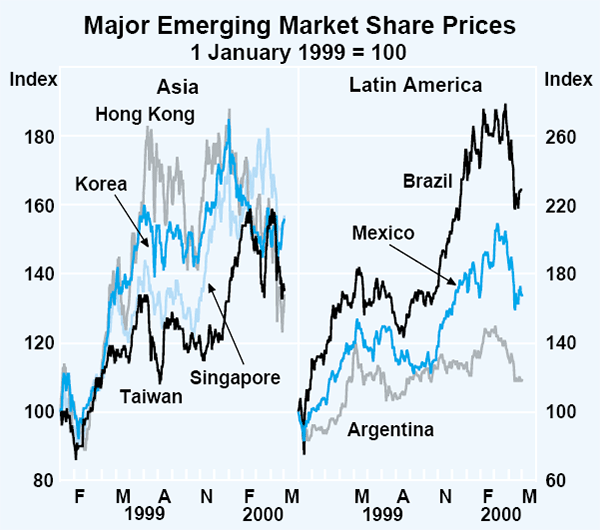
Stock prices in the emerging markets generally increased through the second half of last year, as economic recoveries broadened and strengthened. However, most markets had peaked by early in the new year, and have since been subject to increased volatility, taking their lead from the US market. Several Asian and Latin American markets experienced a large correction in mid April, following the Nasdaq down (Graph 10).
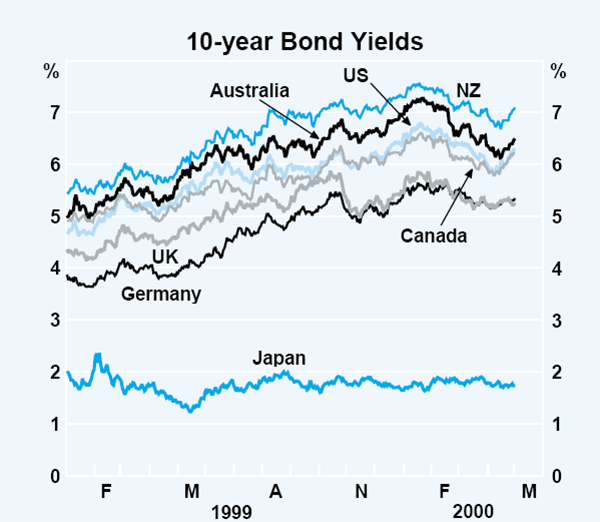
After rising in all major economies throughout the second half of 1999, bond yields fell significantly during the March quarter, before rebounding in recent weeks (Graph 11). In the United States, the yield on 10-year Treasury bonds had fallen by around 100 basis points from its high in January, unwinding all of the rise that had occurred since the Fed started to tighten in the middle of last year. However, since then, signs that inflationary pressures are building have caused yields to retrace to around 6.3 per cent, more than 50 basis points above its recent low.
There has been a significant inversion of the yield curve, with yields on a 10-year bond trading 40 basis points below the yield on a two-year security. This pattern in the yield curve is normally associated with market expectations of slowing economic activity and falls in inflationary pressures. On this occasion, however, it has been accentuated by the fact that US authorities have begun to buy back securities from the market with proceeds from budget surpluses.
Other long-term interest rates in the United States show a similar pattern, but remain well above their pre-tightening levels (Table 5). Mortgage rates, for example, are around 50 basis points above their levels of late June last year, compared with little net change in 30-year Treasuries. Similarly, rates on bank and corporate 10-year paper have shown rises of 70 to 100 basis points over that period, compared with the more modest rise in the corresponding Treasury security.
| Level as at 29 June 1999 |
Level as at 2 May 2000 |
Change | |
|---|---|---|---|
| 10-year Treasury | 5.92 | 6.30 | 0.38 |
| 30-year Treasury | 6.07 | 6.01 | −0.06 |
| 10-year swap | 6.79 | 7.50 | 0.71 |
| 30-year mortgages | 7.63 | 8.13 | 0.50 |
| 10-year AAA-rated corporates | 6.67 | 7.62 | 0.95 |
| 10-year BBB-rated corporates | 7.77 | 8.75 | 0.98 |
In most English-speaking countries, government bond yields have followed those in the US. The fact that most of these countries are also running budget surpluses, and, therefore, retiring debt, has helped maintain the close link with the US market. In contrast, the fall in bond yields in Europe earlier in the year was less than in English-speaking countries. To a degree, this may be explained by the less favourable fiscal position in Europe. The greater capacity in Europe to increase output without triggering inflationary pressures has seen little rise in yields over recent weeks, compared with the significant rebound which has occurred in the US.
Exchange rates among the three major currencies have remained volatile (Graph 12). Through the second half of 1999, the yen had strengthened by about 20 per cent against the US dollar, peaking at around 100 per US dollar, as foreign investors restored exposures to Japan in anticipation of a sustained Japanese economic recovery. It weakened for a time to around 110 per US dollar, as economic data failed to live up to expectations, strengthened again ahead of the end of the financial year, as Japanese institutions repatriated funds and as signs emerged that the recovery may be back on track. The Bank of Japan intervened on several occasions to stem the yen's rise. More recently, however, the US dollar/yen exchange rate has moved back to around 108 with the US dollar strengthening against all major currencies as markets factor in a more aggressive monetary tightening phase by the Fed.
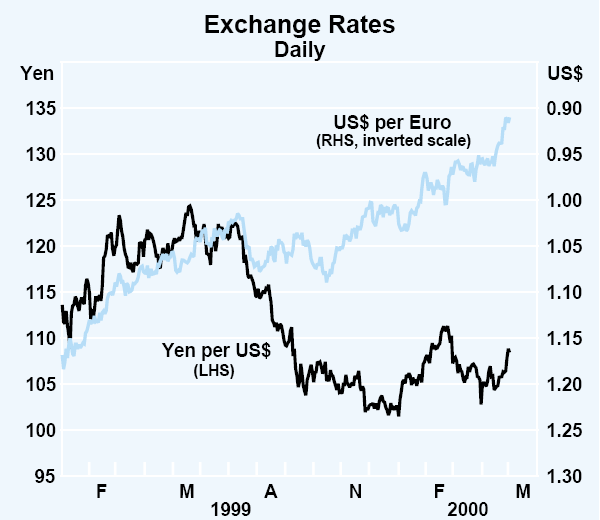
The euro has continued to slide against the US dollar and the yen, with its current level against the US dollar more than 20 per cent below the rate at which it came into existence around 16 months ago. This fall has gone against the generally bullish predictions that were made for the currency on its introduction, and has, therefore, caught most market analysts by surprise. Initially, the fall was rationalised by the sluggish economic growth in Europe, but over the past six months, growth has picked up noticeably, yet the euro has continued to slide. Others have pointed to a very strong flow of direct investment out of Europe, said to reflect dissatisfaction with structural reform in Europe. For whatever reasons, the euro has now fallen to a level against the US dollar which European currencies have not experienced since the mid 1980s. This trend is adding to the current account imbalances between Europe and the US.
The major Asian currencies have been relatively stable against the US dollar over the past six months, as have the free-floating currencies of Latin America – Chile, Brazil and Mexico.
Domestic Economic Activity
The Australian economy has grown strongly during the past year. According to the latest national accounts, real GDP expanded by 4.3 per cent over 1999, with somewhat stronger growth being recorded over the second half of the year (Table 6, Graph 13). The pick-up in growth during the second half of 1999 was driven by a marked increase in exports and was supported by continued strength in domestic final demand.
| Six months to: | Year to: | ||
|---|---|---|---|
| June 1999 | December 1999 | December 1999 | |
| Private final demand(a) | 4.0 | 4.4 | 4.2 |
| Consumption | 3.7 | 5.8 | 4.7 |
| Dwelling investment | 1.9 | 2.8 | 2.4 |
| Business investment(a) | 5.5 | −1.9 | 1.7 |
| – Machinery and equipment(a) | 10.2 | 5.2 | 7.7 |
| – Buildings and structures(a) | −5.2 | −29.8 | −18.4 |
| – Computer software and other | 11.5 | 31.6 | 21.2 |
| Public final demand(a) | 3.2 | 12.8 | 7.9 |
| Domestic final demand | 3.8 | 6.3 | 5.0 |
| Change in inventories(b) | 2.6 | −2.3 | 0.1 |
| Net exports(b) | −2.4 | 0.1 | −1.2 |
| Gross domestic product | 3.1 | 5.4 | 4.3 |
|
(a) Excluding transfers between the public and private sectors (b) Contributions to growth in GDP |
|||
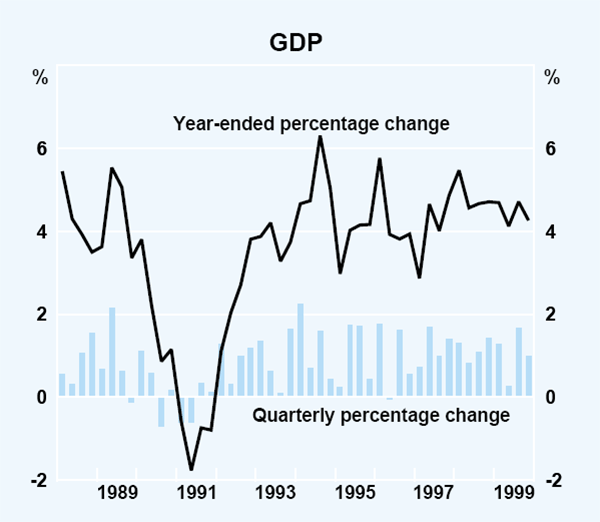
Recent indicators suggest that growth in private demand may now be easing back to a more sustainable pace, while exports continue to grow strongly. Declines in both consumer and business sentiment have been recorded in recent periods, and retail sales data have been very weak, although other indicators of current economic conditions have remained quite strong. The pace of output growth in the recent period has, for example, generated continued strong employment growth. This is, in turn, boosting household incomes and, together with the strong growth in household credit and high level of household wealth, should continue to provide support for consumer spending. The strength of the world economy and high levels of profitability suggest that prospects for businesses also remain positive.
Two forthcoming events will make interpreting developments in the economy more difficult than usual over coming months. The first is the introduction of the major components of the Government's tax package, The New Tax System, on 1 July. This will probably result in expenditure on some components of consumption being brought forward, and expenditure on some components of investment being delayed. Some GST-related acceleration in housing demand appears to be already occurring. In net terms, the international experience suggests that it is most likely that demand will be brought forward into the June quarter (see Box A). This effect will reduce demand in the second half of the year, although offsetting that will be the effect of substantial income tax cuts and increases in government benefit payments from 1 July.
The second event is the Olympic Games, which will be held in the second half of September. Most of the impact on output of the preparatory work for the Olympics has already been recorded, and in the September quarter the substantial boost to exports, from broadcast royalties and overseas tourism, and to consumption, from domestic ticket sales, is expected to be largely offset by a run-down in stocks (see Box C in the May 1999 Semi-Annual Statement). It is difficult, however, to quantify the possible effect of the Olympics on production and expenditure from here on. It is possible, for example, that Olympic-related consumption expenditure, by both residents and tourists, could be greater than currently anticipated. On the other hand, there may be some offsetting effects of the Games on the level of non-Olympic-related production in NSW during this period, as many businesses curtail normal activity.
Household consumption, income and wealth
Household consumption expenditure grew strongly during 1999, increasing at an annual rate of 5.8 per cent in the second half of the year. The strength in consumption was broadly based, but was particularly noticeable in spending on durable goods, such as furnishings and household equipment, and communications. Monthly retail sales data suggest that since November, however, consumer spending has weakened considerably (Graph 14). Falls have been recorded in each of the latest three months, and year-ended growth has fallen from just over 7 per cent over the year to November, to 3 per cent over the year to February.
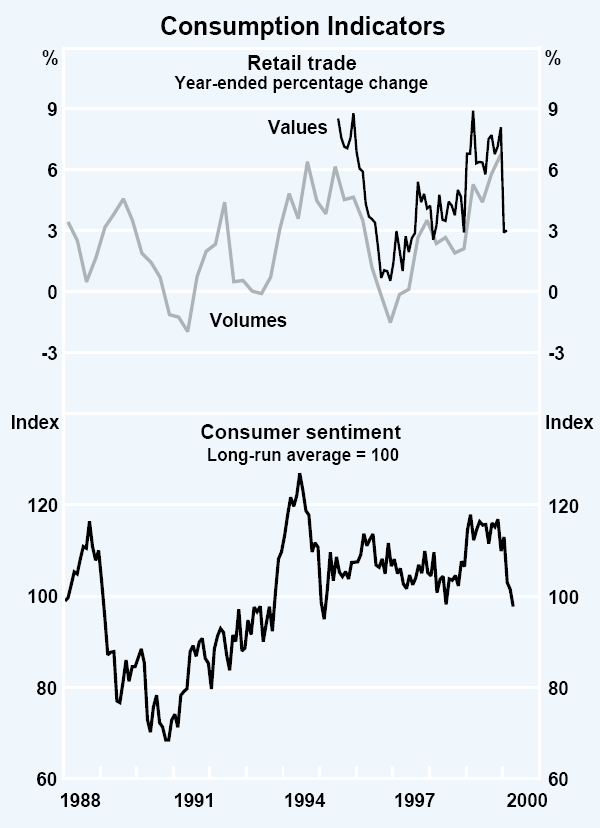
While some slowdown from last year's rapid growth in retail sales was expected, the extent of the recent weakness has surprised most observers of the economy and appears at odds with the ongoing gains in household income and employment. Much of the weakness has been concentrated in a couple of retail trade components. In the latest three months, for example, around a quarter of the total fall in retail trade is explained by falls in sales of clothing, even though these comprise only 5 per cent of total retail sales. Sales at department stores and non-supermarket food sales have also been recorded as particularly weak. On a State basis, the weakness has been particularly pronounced in Victoria, where retail sales have fallen back to their June 1999 level.
Some weakening in retail sales growth, however, is consistent with the recent falls in consumer sentiment. Since the beginning of the year the Westpac-Melbourne Institute index of consumer sentiment has fallen to just below its long-run average, a level last seen temporarily in the middle of 1998. Falls in sentiment have been concentrated in components of the index that relate to prospects for the year ahead, and appear to be partly related to uncertainties about the effect of the forthcoming changes in taxation arrangements and the recent increases in interest rates. In March, the survey reported that nearly 40 per cent of respondents recalled hearing news on taxation issues, up from 14 per cent a year ago, and 17 per cent recalled hearing news on interest rates, up from around 10 per cent a year ago.
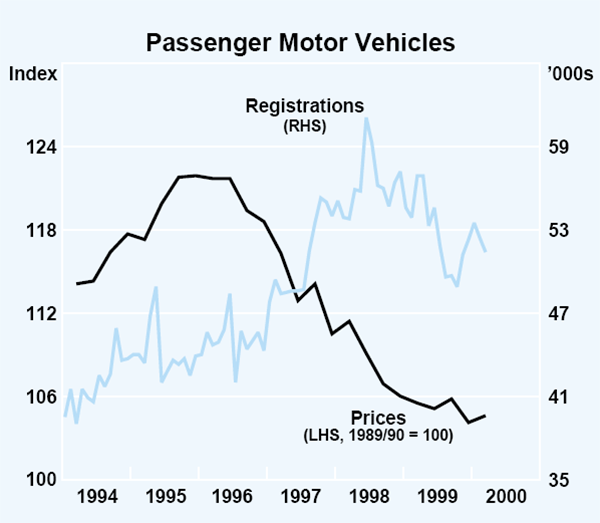
Over recent years, substantial falls in the relative price of motor vehicles have implied that spending on motor vehicles has evolved somewhat differently to other areas of consumption. Between mid 1996 and mid 1998, heightened international competitive pressures placed considerable downward pressure on motor vehicle prices, particularly at the smaller end of the market. As a result, the average price of new motor vehicles fell by around 10 per cent, before stabilising in early 1999 (Graph 15). These price movements contributed to the very high level of sales in 1998 and the subsequent weakness in 1999. Since late 1999, some further discounting has occurred and motor vehicle registrations have again picked up. In this case, however, some of the price discounting appears to be related to the changes to indirect tax arrangements to be introduced in July, which should reduce the final price of motor vehicles. It seems that some manufacturers and wholesalers have brought forward a portion of the expected price fall in an attempt to smooth production and sales.
Household disposable income increased by a little over 2 per cent in the December quarter, to be 4½ per cent higher than a year earlier in nominal terms. This was somewhat weaker than the growth in consumption spending during the year, implying a further decline in the household saving ratio. In the period ahead household income is likely to be supported by growth in employment and increases in average wages. Both of these components increased further in the March quarter and, from July, household disposable income will be boosted by the reduction in personal income taxes and increases in social benefits.
In recent years, consumer spending also appears to have been supported by the high level of household wealth that has accumulated, though perhaps not to the same extent as in some other countries (see Box B). Household wealth is estimated to have increased by a further 6 per cent in the December quarter, the largest quarterly increase recorded in the decade, to be 15½ per cent higher than a year earlier. Both dwelling and share prices rose particularly strongly in the quarter. Tight conditions in the housing market are likely to support dwelling prices in the near term, though the recent volatility of the share market has made the outlook for financial assets less certain. How these developments in wealth will affect consumer spending is difficult to determine. On the one hand, it is possible that increased volatility in share prices could adversely affect consumer sentiment and this could weaken spending. On the other hand, the total gains in wealth in recent years have been very strong and the current ratio of consumption to wealth is at an historically low level. The current level of wealth could thus prove sufficient to support further growth in consumer spending, even given some correction in share prices.
To date, households have continued to expand their borrowing at a rapid pace, with total household credit increasing by just over 16 per cent over the year to March. Within the total, growth in housing credit was a little stronger in the first months of 2000 than in the previous year, continuing the trend increase in housing credit growth since late 1998. Strong growth in housing credit is consistent with real and nominal home loan interest rates prevailing in 1999 being at or near historical lows, although it may also reflect some bringing forward of dwelling purchases and building activity before the introduction of the GST. Personal credit has continued to grow strongly, increasing by over 17 per cent over the year to March, and has been boosted by rapid growth in bank margin lending (see Box C). In the March quarter, margin lending increased by 8.4 per cent, following growth of 12.2 per cent in the previous quarter. Outstanding margin debt now stands at $6.3 billion and accounts for 8.6 per cent of outstanding personal debt. Taken together, the continued strong growth in both housing and personal credit suggests that consumers do not perceive current borrowing conditions to be very restrictive, although behaviour may not have had time to adjust fully to recent increases in interest rates.
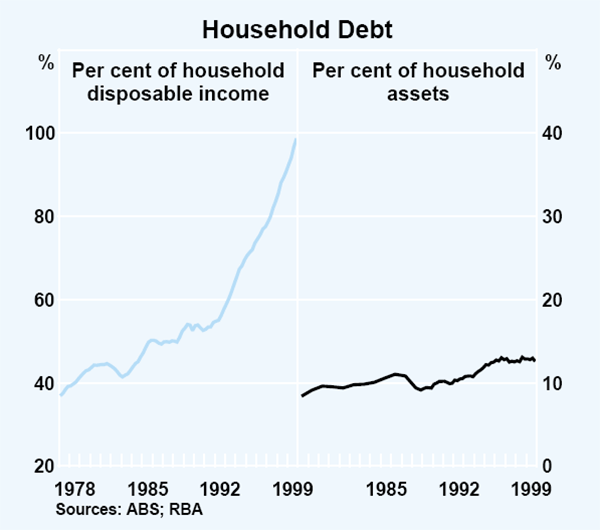
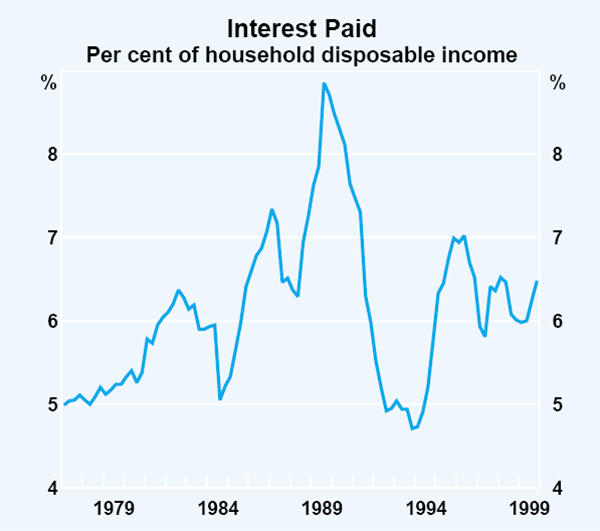
The rising ratio of household debt to income (Graph 16) has combined with recent increases in nominal interest rates to increase the interest repayments required of the household sector. The ratio of household sector interest payments to disposable income increased to 6½ per cent in the December quarter, up from its most recent low of around 6 per cent in the March quarter 1999 (Graph 17). Over the next couple of quarters, as debt continues to rise and the interest rate increases that have already occurred flow through, these ratios are likely to rise to around the peak recorded in early 1996, despite the fact that interest rates remain considerably lower than at that time. This reflects the increased influence that interest rate increases have on households when gross debt burdens are higher.
The housing market
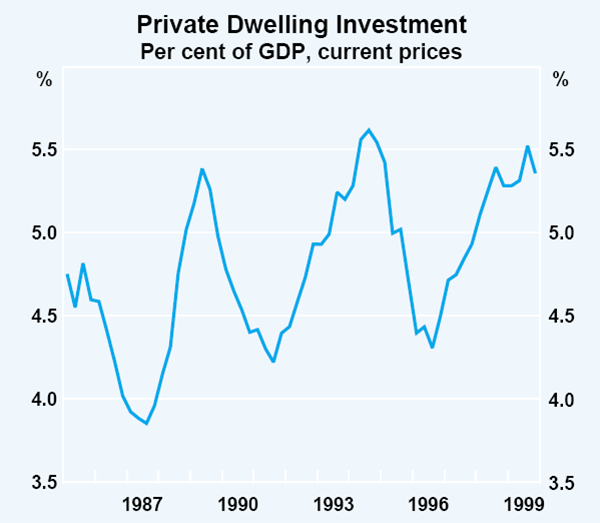
Conditions in the housing sector have been buoyant during the past couple of years and forward indicators of activity continue to point to further strength in the near term. Although dwelling investment as recorded in the national accounts fell by 3 per cent in the December quarter and increased by only 2½ per cent over the previous year, the level of dwelling investment as a share of GDP remains high (Graph 18). By most measures, this cycle now looks to have been almost as strong as that of the early 1990s.
Loan approvals and building approvals data, moreover, point to further substantial increases in dwelling investment. Although the value of loan approvals rose by only 1 per cent in the three months to February, it remains more than 30 per cent higher than a year earlier. In part, this strength has been driven by further increases in the average value of a new housing loan. Growth in the value of private building approvals has also been strong, rising by nearly 14 per cent in the three months to February, to be 37 per cent higher than a year earlier. This growth has been driven by approvals for houses. Although much of the strength in building approvals over the last few years has been in Victoria and New South Wales, growth in housing activity in the other States has picked up during the last year to rates in excess of 30 per cent (Table 7).
| Private building approvals(a) | Loan approvals(b) | |
|---|---|---|
| New South Wales | 15.8 | 37.3 |
| Victoria | 49.3 | 31.4 |
| Queensland | 47.4 | 31.7 |
| Western Australia | 37.4 | 26.1 |
| South Australia | 76.3 | 38.5 |
| Tasmania | 66.5 | −8.8 |
| Australia | 36.6 | 32.9 |
|
(a) Value; houses and medium-density dwellings (b) Value; for owner-occupation |
||
An important influence on the housing market at present is the introduction of the GST on 1 July. With the construction and sale of new homes, repairs and renovations to existing homes and transaction costs incurring the GST from 1 July 2000, there is an incentive for households to bring forward their construction spending to before that date. This may be offset to some extent by demand pressures and capacity constraints that have increased the cost of getting work done in the first half of this year, and by the Government's introduction of a First Home Owners Scheme which provides a grant to first home buyers of $7,000 for purchases after 1 July. Overall, however, the introduction of the GST should imply that housing activity is boosted in the first half of the year relative to the second half, although capacity constraints mean that some activity planned for the first half of the year will probably spill over into the second half.
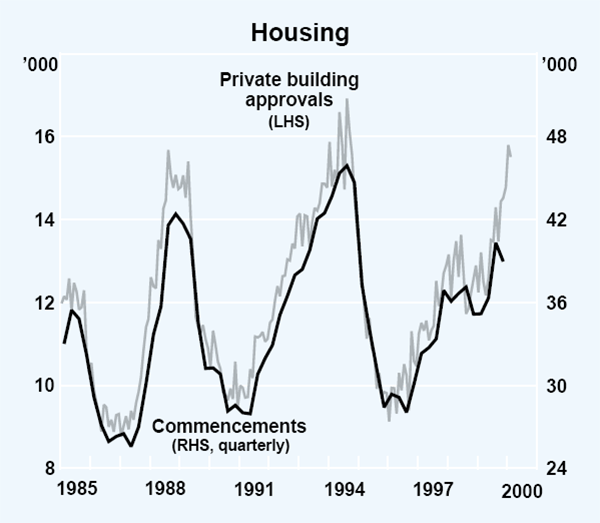
The growing gap between dwelling commencements and the leading indicators of dwelling activity suggests an increasing stock of work yet to be done in the housing sector (Graph 19), possibly reflecting an emergence of capacity constraints in the industry. In NSW and Victoria, where capacity constraints appear to be most prevalent, dwelling investment as a share of GDP now exceeds the peaks recorded in the late 1980s and early 1990s. Most of the other states have recorded increases in this ratio more recently, the one exception being Queensland where oversupply from the previous upswing in the middle of the 1990s has taken longer to be absorbed. Capacity constraints in the industry are also evident in some price and labour market data. The house purchase component of the CPI, which reflects the cost of project homes, grew by 8 per cent over the year to March, while the cost of materials used in house building has accelerated after a period of relatively subdued growth. Skilled vacancies in the construction industry, as recorded in the Department of Employment, Workplace Relations and Small Business (DEWRSB) survey, have also risen sharply over the past year or so.
The strength in the housing sector across the country has been reflected in rising house prices. According to ABS and REIA data, strong price rises over the past year or so have been recorded in all state capital cities with the exception of Brisbane (Table 8). Price rises have been particularly strong in Melbourne and Sydney. This pattern is also reflected in dwelling rents, where significant gains have been recorded in Sydney and Melbourne, with Brisbane showing little growth.
| Sydney | 13.8 |
|---|---|
| Melbourne | 19.5 |
| Brisbane(a) | −2.1 |
| Adelaide | 2.4 |
| Perth | 5.2 |
| Hobart | 8.0 |
| Darwin | 6.2 |
| Canberra | 9.7 |
| Australia | 10.8 |
|
(a) Year-ended September Source: Real Estate Institute of Australia |
|
The business sector
Businesses have experienced favourable conditions over the last year, with domestic demand remaining strong and the prospects for exporters having improved considerably. The disparity in conditions across industries, which had been a feature of the last couple of years, has also been reduced. This is particularly evident in those industries with a high export share, such as mining and to a lesser extent manufacturing. These industries experienced difficult conditions during the Asian financial crisis, but as world demand has accelerated, production has picked up. Mining production rose by 10 per cent over the year to December, aided by the large number of new projects that have been coming on-line, particularly in the oil, gas and base metals sectors. Manufacturing production fell in the middle of last year, but bounced back by just under 3 per cent in the December quarter to be around 2 per cent higher over the year. Elsewhere in the economy, growth in output continues to be strongest in the service sector, particularly in the communications industry where output rose by nearly 18 per cent over the year to the December quarter.
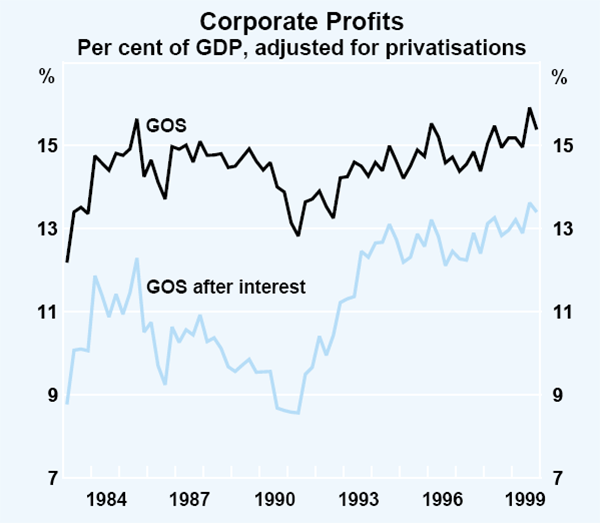
The current level of profitability of the corporate sector also seems to be reasonably strong, according to both the official data and the financial reports of listed companies. Although corporate GOS fell by just over 2 per cent in the December quarter, this followed a substantial rise in the previous quarter, and over the year to the December quarter profits rose by 7 per cent. As a share of GDP, corporate GOS after interest remains near recorded peaks (Graph 20).
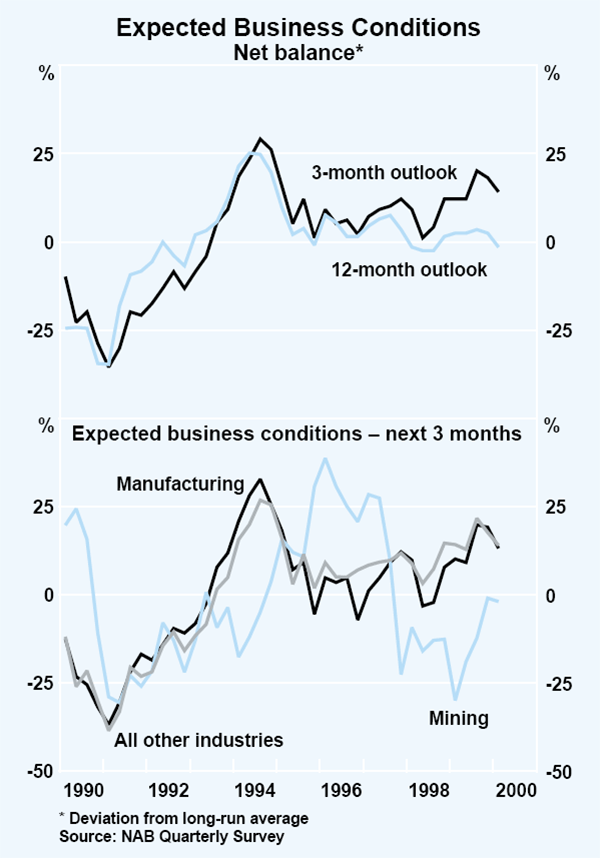
In recent months indicators of current and prospective business conditions have been more mixed. Most of the major business surveys suggest that conditions in the March quarter were not as strong as in the robust December quarter, although in most cases, the overall level of business conditions remains well above long-run average levels (Graph 21). According to the quarterly National Australia Bank (NAB) survey, however, businesses have become somewhat more pessimistic about the longer-term outlook. This may reflect their concerns about the likely effects that the recent increase in interest rates, higher oil prices, the introduction of the GST and other changes to business taxation arrangements will have on their operations and the economy more generally. In Victoria, where business confidence has fallen particularly sharply, this deterioration may also reflect concerns about the recent increase in industrial disputation.
Despite these indications of lessening of confidence, however, businesses' raisings of external funds are continuing to grow strongly. Business credit has on average picked up in recent months, after several months of more moderate growth, to grow at an annual rate of around 10 per cent in the six months to March. The overall pick-up in business credit growth in recent months has been broadly based across lenders and products, with fixed-term lending particularly strong.
Businesses also continue to raise a significant amount of funds directly from capital markets. Gross equity raisings in the December and March quarters have continued at the robust pace seen earlier in 1999. This strength, reflected in both new listings on the stock exchange and issuance of additional equity by existing public companies, was no doubt encouraged by the high level of share prices at the time. In comparison, direct debt raisings have slowed a little in 2000 from the pace seen in 1999.
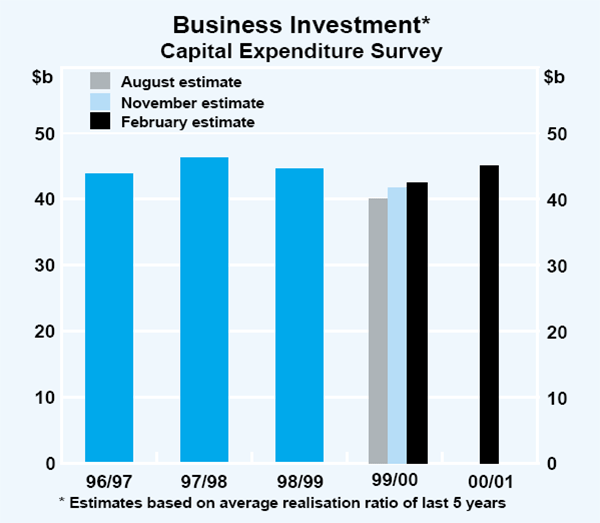
The strong financial position of the corporate sector and the improvement in business conditions over the last year has been reflected in a further modest improvement in the outlook for business investment (Graph 22). Investment in machinery and equipment, while volatile, has generally exhibited little growth over the last couple of years (Graph 23), with uncertainty regarding the global outlook probably dampening firms' investment plans. There may also have been some deferral of investment on account of the forthcoming introduction of the GST. As the outlook for the world economy has improved and capacity utilisation rates have increased, however, the outlook for machinery and equipment investment has picked up. According to the latest ABS Capital Expenditure survey, firms have further upgraded their machinery and equipment investment plans for 1999/2000, and they now expect to increase investment in machinery and equipment in 2000/01 by about 12 per cent in nominal terms. This should amount to quite strong growth in real equipment investment in 2000/01, although interpreting the CAPEX figures is complicated by the introduction of the GST, as it is not clear how firms have accounted for the impact of the introduction of input tax credits on their investment expenditure plans.
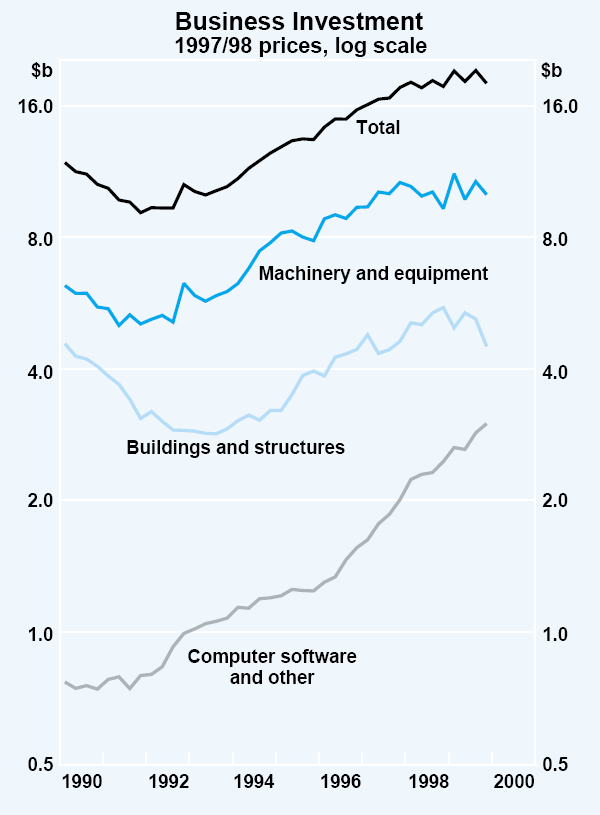
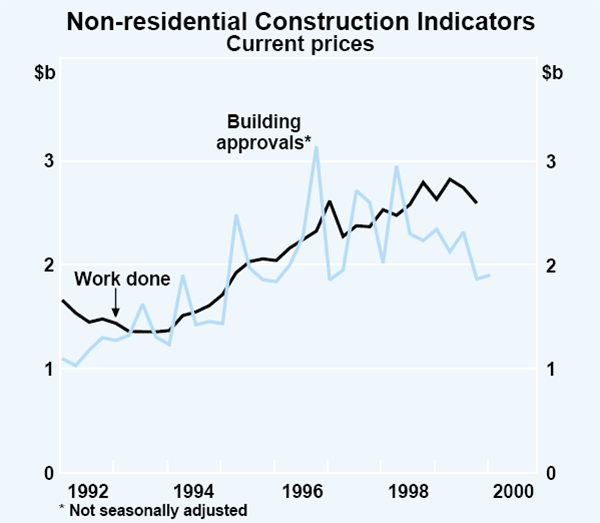
The outlook for investment in buildings and structures is less positive. After a number of years of quite strong growth, which took buildings and structures investment to a relatively high level as a share of GDP, spending in this area has been falling over the past few quarters. The immediate outlook for non-residential building activity looks particularly weak with the level of non-residential building approvals so far this year suggesting that there are insufficient new projects to sustain the current level of activity (Graph 24). The outlook for investment in structures is better, with work continuing on a number of infrastructure projects. An improved outlook for the mining sector should also provide some support to this component of investment, since around 60 per cent of mining investment is in buildings and structures.
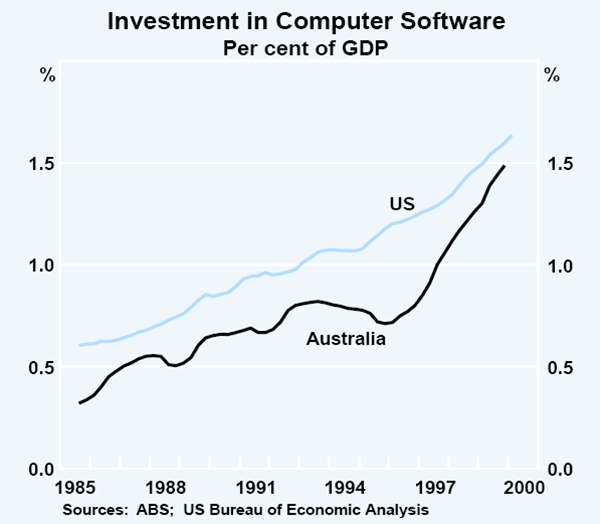
The third component of business investment, which includes investment in intangible fixed assets (mainly computer software), livestock and mineral exploration expenditure, continues to grow very strongly (Graph 23). Over the last four years this component has grown at an annual rate of 22 per cent and it now accounts for around 18 per cent of new business investment, compared with 12 per cent four years ago. Virtually all of this strength relates to the computer software component, which comprises more than 80 per cent of this category. Growth of this order of magnitude is not surprising, as high rates of depreciation of this type of capital mean that a high amount of investment has to be undertaken just to keep the existing capital stock in place. Similar rates of growth in computer software investment are being recorded in the US. Although over the longer term Australia has tended to spend less on computer software than the US, Australian levels of spending on software are now approaching US levels (Graph 25).
The labour market
Employment has increased strongly during the past year, reflecting the overall strength of economic activity. Over the year to March, employment increased by almost 3 per cent, compared with growth of around 2 per cent over the previous year. More than two-thirds of the increase in employed persons over the past year has been in full-time positions, roughly corresponding with the share of full-timers in total employment. Employment growth has been particularly strong in the construction and services industries, which have been among the fastest-growing parts of the economy recently.
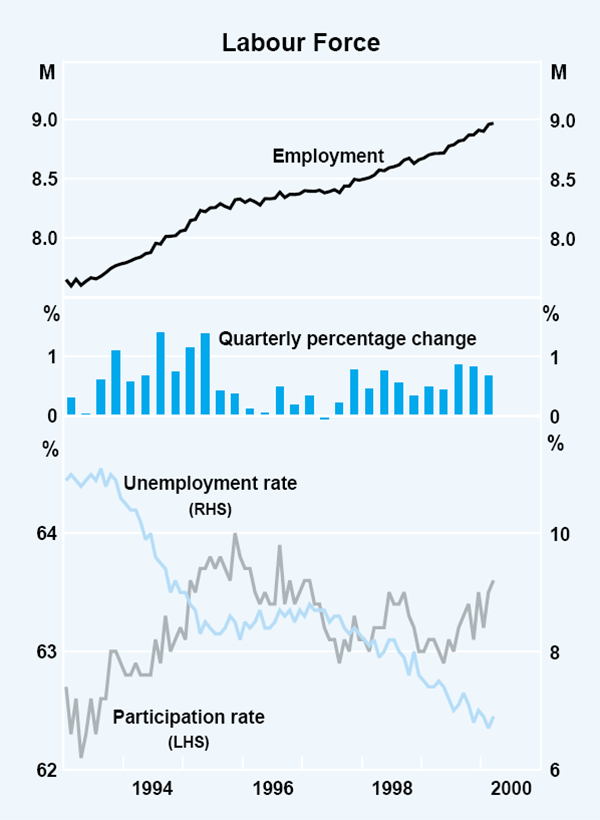
The overall strength of the labour market over the past year continued in the March quarter, with employment increasing by 60 000, or 0.7 per cent. The unemployment rate has declined, and averaged 6.8 per cent in the quarter, compared with an average of 7½ per cent in the corresponding period a year earlier. Some of the growth in employment has also been met by increases in labour force participation, as previously discouraged workers may have re-entered the job market; labour-force participation increased to a three-year high of 63.6 per cent in March (Graph 26).
The improvement in labour market conditions during the past year has been widely spread across States (Table 9). Most States recorded employment growth well in excess of 2 per cent over the year to the March quarter 2000 (with Queensland the only exception). Similarly, unemployment rates across most States and Territories have continued to fall, and are currently at their lowest levels in over nine years. While there has been some regional variation, both cities and non-metropolitan areas recorded strong employment gains: the average growth in employment in non-metropolitan areas over the year to the March quarter 2000 was 3.1 per cent, slightly higher than the growth in metropolitan areas.
| NSW | VIC | QLD | SA | WA | TAS | Australia | |
|---|---|---|---|---|---|---|---|
| Employment growth | |||||||
| – Year to March quarter 2000 | 3.4 | 2.4 | 1.9 | 2.9 | 3.7 | 3.0 | 2.8 |
| Unemployment rate | |||||||
| – March quarter 1999 | 6.9 | 7.5 | 8.0 | 9.2 | 7.0 | 10.5 | 7.4 |
| – March quarter 2000 | 6.0 | 6.9 | 8.1 | 8.2 | 6.5 | 8.9 | 6.8 |
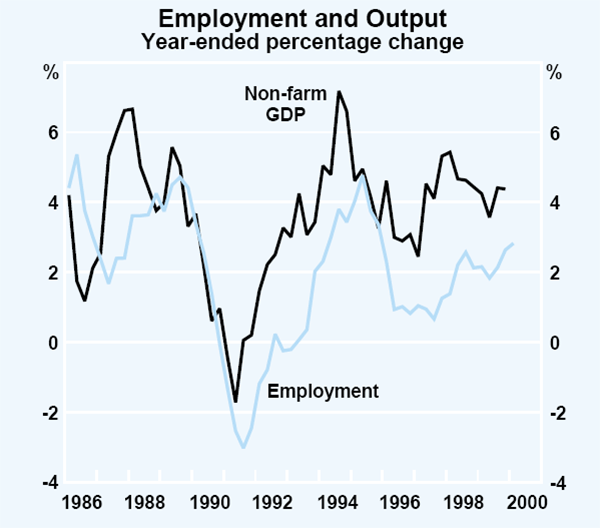
The recent strong gains in employment have followed a period of slower employment growth during 1998 and into the early part of 1999. During that period, employment had been somewhat weaker than might have been expected given the strength of the economy, possibly reflecting the adverse impact that the Asian crisis was having on business confidence at that time. As employment growth has picked up in the more recent period, and with output growth remaining fairly steady, there has been some decline in labour productivity growth (Graph 27). Measured in terms of output per hour worked, productivity fell slightly in the December quarter, and year-ended productivity growth in the past two quarters has been running at a rate of around 1¾ per cent, a bit below the average growth rate recorded in the course of the current economic expansion since 1991.
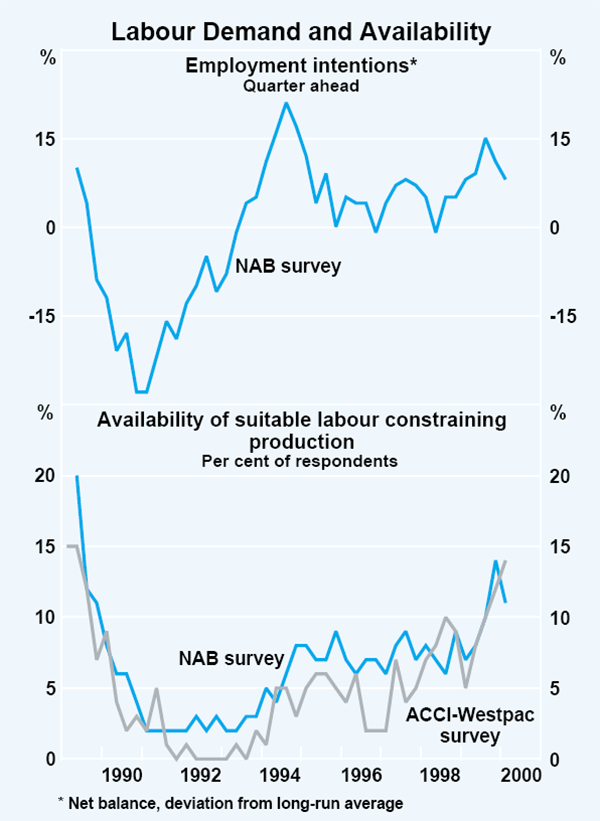
A high level of job vacancies continues to point to strong labour demand, though there has been some divergence among the alternative indicators recently. The ABS measure of job vacancies, based upon a survey of employers, increased by over 9 per cent in the three months to February and stands at record levels. Both the ANZ Bank and DEWRSB measures of job vacancies have been quite volatile in recent months, but they have remained high, 13–17 per cent higher than their levels of a year ago. Indicators of near-term employment intentions present a similar picture (Graph 28). The NAB business survey and the ACCI-Westpac survey of manufacturing firms in the March quarter both suggest that near-term employment intentions are at high levels, though they have fallen below the peaks recorded in mid 1999. Both surveys also suggest that firms are having greater difficulty in obtaining labour than has typically been the case in recent years. (See the section on ‘Labour costs’ in the chapter on ‘Inflation Trends and Prospects’ below.)
Box A: Transitional Effects on Demand of the GST: the Canadian, Japanese and New Zealand Experiences
Canada, Japan and New Zealand are three countries that have relatively recently introduced GST-type taxes as part of a broad-ranging reform of the taxation system.[1] In all of these countries, as in Australia, the introduction of the GST coincided with a reduction in other indirect tax rates, so the prices of some goods were expected to rise, while others were expected to fall. In each case, however, these reforms were expected to lead to a once-off rise in the aggregate price level. Economic conditions at the time these tax changes were introduced varied across the three countries; conditions were very buoyant in Japan, quite soft in New Zealand and very weak in Canada. In each case, however, there is clear evidence that the introduction of the GST had significant transitional effects on some components of domestic demand. These transitional effects were concentrated in the couple of months immediately before and after the introduction of the new tax.
Although it is often difficult, even with hindsight, to disentangle GST-related effects from underlying trends, these effects appear to be fairly clear in the available data on consumer expenditure for each of these countries. In each case, the aggregate level of retail sales, for example, was significantly boosted in the month or two before the GST was introduced, and was correspondingly weaker in the subsequent two or three months (Graph A1). This effect was particularly pronounced in New Zealand, where the once-off rise in the aggregate price level was expected to be greater than in Canada or Japan because the New Zealand reforms involved the most significant change in taxation arrangements.
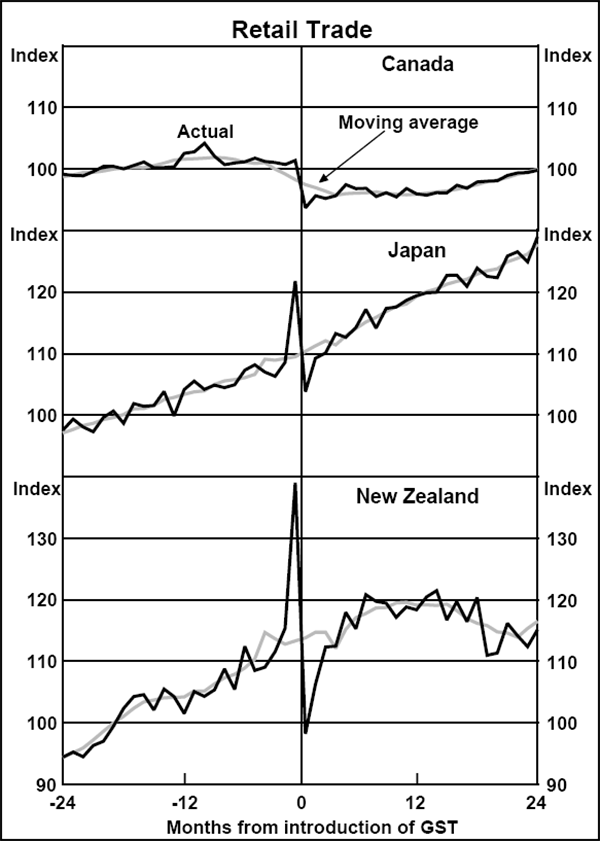
This shifting in expenditure was primarily confined to spending on goods; the consumption of services was largely unaffected by the tax changes because it is quite difficult to shift the timing of much of this expenditure. An analysis of retail trade by store type indicates that across types of goods, the shifting of expenditure was greatest for big-ticket durable items such as furniture and household appliances, and most limited for food (Table A1). Interestingly, although motor vehicle prices were expected to remain unchanged in New Zealand on account of the tax changes, spending on motor vehicles was significantly boosted in the month before the GST was introduced. This suggests that consumers may have been confused about the effect the reforms were to have on some prices. In Japan, by contrast, motor vehicle prices were expected to fall and some spending on motor vehicles was postponed.
| Japan | Canada | New Zealand | ||||||
|---|---|---|---|---|---|---|---|---|
|
Pre-tax Mar 89 |
Post-tax Apr 89 |
Pre-tax Dec 90 |
Post-tax Jan 91 |
Pre-tax Sep 86 |
Post-tax Oct 86 |
|||
| Food | 2.7 | −2.3 | 0.0 | −0.7 | 8.3 | −5.1 | ||
| Clothing | 14.5 | −7.6 | 6.2 | −12.3 | 28.3 | −10.3 | ||
|
Furniture and household appliances |
21.4 | −9.9 | 18.7 | −20.3 | 54.7 | −31.1 | ||
| Motor vehicles | −3.5(a) | 3.5(a) | 2.1 | −1.4 | 27.1 | −20.1 | ||
| Other | .. | .. | 3.1 | −5.4 | 18.1 | −7.4 | ||
| Total | 11.2(b) | −6.0(b) | 3.0 | −4.0 | 22.9 | −13.5 | ||
|
(a) Motor vehicle registrations (b) Excludes motor vehicle registrations |
||||||||
The effect of the introduction of the GST on the timing of dwelling construction activity is more difficult to discern from the available data, in part because these data are inherently more volatile (Graph A2). In Canada and Japan it is hard to establish whether housing-related activity was affected at all by the introduction of the GST. In New Zealand, the number of dwelling approvals does appear to have been boosted significantly in the six months before the introduction of the GST, with approvals in the following six months being correspondingly weaker. Approvals of alterations and additions behaved in a similar fashion to those of new houses, as did approvals of medium-density dwellings. This bunching of approvals resulted in a significant increase in construction activity in New Zealand in the quarter before the GST was introduced, while activity was weaker than otherwise in the following quarter.
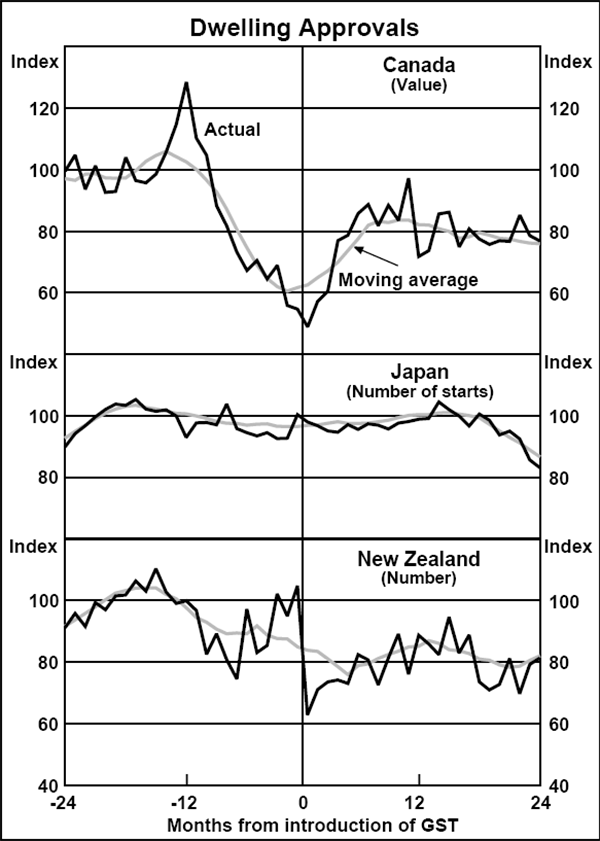
It is difficult to find evidence of the introduction of the GST having a significant effect on the timing of expenditure on most other components of domestic demand or on the aggregate level of employment in these countries. The employment data, in particular, do not appear to have been more volatile than usual around these periods (Graph A3), suggesting that it was widely appreciated that the observed effects on demand were likely to be temporary.
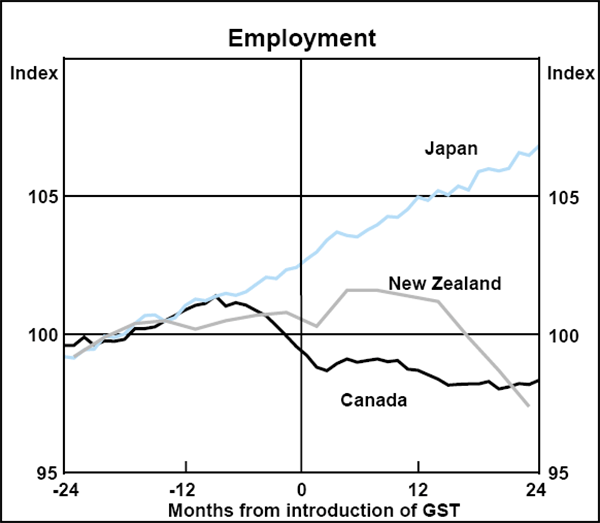
In summary, all of these countries experienced a boost to consumption expenditure in the quarter immediately prior to implementation of the tax, with the effect being broadly reversed in the following quarter. The overall effect on GDP varied quite widely across countries, and depended on the details of the tax reform package being implemented amongst other factors. Employment data, however, were little affected by these tax changes and throughout these transitional periods provided a better guide to the underlying strength of these economies.
Box B: Household Wealth: Some International Comparisons
Households in Australia, the United States and the United Kingdom have all benefited from rapid increases in wealth during the 1990s, and particularly in the later years of the decade. In all three countries, household wealth increased at an annual rate of more than 10 per cent in the period from 1996 to 1999, contributing to the strong pace of consumption growth and supporting the overall growth of economic activity. The composition of the increases in wealth has, however, varied considerably across the three countries.
In the United States and the United Kingdom, the rise in wealth has primarily resulted from increases in the value of financial assets, and from rises in equity prices in particular. In Australia, while equities have been the fastest growing component of household wealth, they still form a smaller share of the total than in the other two countries.
The relatively low share of equities in household wealth in Australia partly reflects a lower market value of business assets, compared with the other two countries. The market capitalisation of Australian equity markets in 1999 was just over 100 per cent of GDP, compared with around 200 per cent in the UK and the US. In recent years, the faster increases in equity prices in the US and the UK have amplified the differences in the value of equity holdings among households in the three countries (Graph B1). Another factor is that net foreign ownership of Australian equity assets is relatively high; hence the share of business assets held by domestic residents, either directly in the form of equity, or indirectly through financial institutions, is lower than in the other countries.
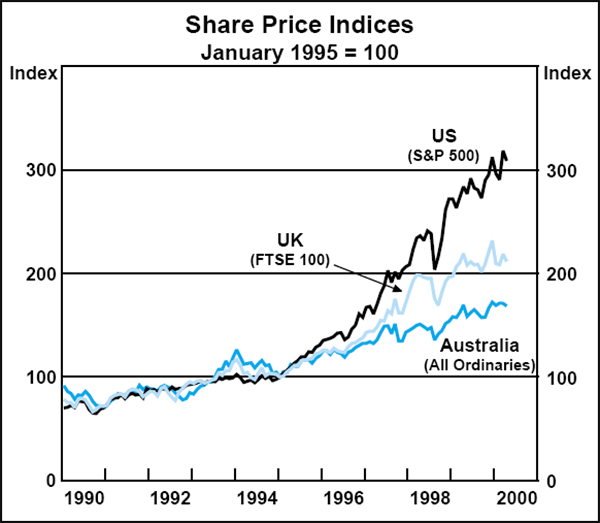
Available data suggest that more than half of total household wealth in Australia in 1999 was held in the form of dwellings, compared with only around a quarter in the United States and a third in the United Kingdom (Table B1). With house prices rising solidly in Australia during the past few years, increases in the value of dwelling assets have accounted for much of the increase in total household wealth.
|
Average annual growth 1996–1999 |
Ratio to household disposable income |
Share of total wealth | |||
|---|---|---|---|---|---|
| Dwellings | Equity(a) | Other financial assets(b) |
|||
| Australia | 13 | 721 | 57 | 17 | 22 |
| United States | 11 | 737 | 23 | 27 | 44 |
| United Kingdom | 12 | 770 | 38 | 35 | 27 |
|
(a) Includes equity held in life, superannuation and mutual funds Sources: ABS; RBA; CBA/HIA Housing Reports; Board of Governors of the Federal Reserve System; Government Statistical Service (UK); Nationwide Building Society (UK) |
|||||
The high proportion of wealth held in the form of housing in Australia does not appear to reflect significant differences in home ownership patterns among the three countries; most of the dwelling stock in each country is owned by domestic residents. Rather, the available data suggest a relatively high valuation of the overall housing stock in Australia. This may partly reflect differences in the type of housing, as well as differences in the value of and amount of land devoted to dwellings.
The differences in the composition of wealth among the three countries imply that recent share market fluctuations will have differing effects on the overall levels of household wealth. The direct effects of a decline in share prices on household wealth will be larger in the US and the UK than in Australia. In Australia, household wealth will be more sensitive to movements in house prices.
Box C: Margin Lending
In recent years household borrowing to finance investment in the share market has increased. Some of this has been through personal loans and loans secured against houses and, therefore, the amount of such activity is not easily measurable. Some of the lending, however, has been more direct, taking the form of ‘margin lending’. Margin loans involve the borrower lodging cash or shares with the lender (typically a bank or stockbroker), which then supplements the investor's capital by providing a line of credit. This line of credit – the margin loan – plus the borrower's own capital are used to purchase shares, which then become the security for the loan. Margin loans have been available in Australia since the late 1970s, although they have increased strongly in recent years as most retail banks and larger stockbrokers now offer this product.
Margin loans outstanding from banks and brokers rose from $2 billion in September 1996, when the Reserve Bank began informally collecting this information, to $6.3 billion in the March quarter of 2000. Over the past year, margin lending has increased by 50 per cent, although there are some signs that this growth might have begun to slow following the absorption of the Telstra 2 sale. Interest rates on margin loans are currently around 8.4 per cent, about 0.7 of a percentage point higher than for a residentially-secured line of credit, but almost 2 percentage points below the interest rates available on other secured personal loans. Fast growth in margin lending over recent years mirrors developments overseas. For example, over the year to March 2000, margin lending in the US grew by 78 per cent.
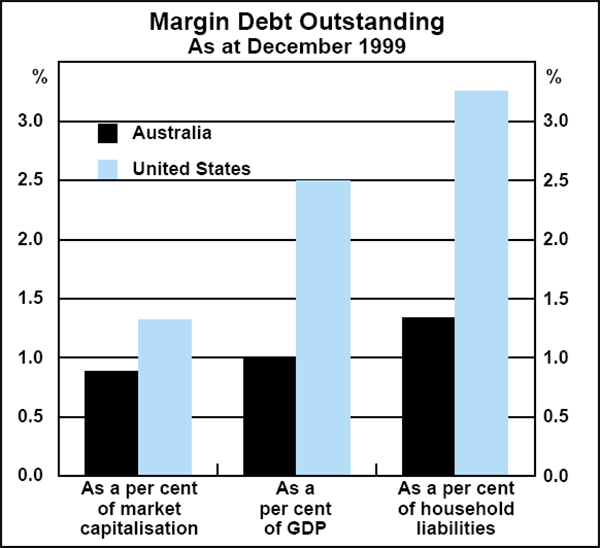
While the recent rate of growth of margin lending in Australia has been high, the level of margin debt remains relatively low. The value of outstanding margin loans represents about 0.9 per cent of market capitalisation of the Australian Stock Exchange, around 1 per cent of GDP and 1.3 per cent of the household sector's gross liabilities. These figures are well below those for the US (Graph C1). The level of margin loans is not thought to pose any significant prudential risk to the individual lenders involved, or systemic risk for the financial system as a whole, given that they account for such a small part of total lending. Whether margin loans will adversely affect the share market in the event of a market correction is, however, less clear.
Leverage and risk
By leveraging their own capital with a margin loan, it is possible for investors to control a much larger portfolio than they could if they were to invest only their own capital. Leverage, however, magnifies both the potential gains and losses that might result from fluctuations in equity prices (see example below).
Financial institutions typically designate the range of securities which they are prepared to accept as collateral in order to limit their potential exposure to investors with margin loans. In Australia, lenders also typically limit the funding from margin loans to a maximum of 70 per cent of a portfolio of ‘blue-chip’ stocks; a larger equity contribution would be required of investors buying other securities.
Larger margin lenders in Australia say that Australian borrowers typically gear their portfolios conservatively, providing around 50 per cent of funds from their own resources. This operates to minimise investors' exposure to market volatility, particularly the risk of receiving a margin call. Banks and brokers make margin calls when falling share prices result in the market value of a borrower's equity falling below the minimum level prescribed by the lender (see Case 2 in example).
When a margin call is made, borrowers must restore, within 24 hours, their gearing to the ratio required by the lender. Borrowers can provide additional equity (in the form of cash or approved securities) or instruct their lender to sell some shares from the portfolio and use the proceeds to repay part of the debt. If they fail to take either of these courses of action, the lender has the power to sell sufficient securities to restore the required ratio.
Example: The effects of leverage
Initial portfolio value: $100,000
Investor's equity contribution: $30,000
Margin loan: $70,000
Maximum gearing ratio prescribed by the lender: 70 per cent
Case 1: Market value of portfolio rises by 10 per cent
New portfolio value: $110,000
Gearing ratio: 63.6 per cent ($70,000/ $110,000)
Return on investor's
equity: 33.3 per cent ($10,000/$30,000)
In the absence of the margin loan, the investor's return would have been 10 per cent, the same as the rise in the market value of the portfolio. To the extent that the investor still has unused margin credit available, the investor could purchase up to about an additional $23,000 of shares, to restore the gearing ratio to 70 per cent.
This would tend to reinforce buying pressure in the market.
Case 2: Market value of portfolio falls by 10 per cent
New portfolio value: $90,000
Gearing ratio: 77.8 per cent ($70,000/ $90,000)
Return on investor's
equity: −33.3 per cent
With the gearing ratio exceeding the prescribed maximum, a margin call is triggered, with the investor required to restore the gearing ratio to 70 per cent. The investor could do this in one of three ways:
- Paying a minimum of $7,000 in cash, thereby reducing the loan to $63,000.
- Providing the equivalent of at least $10,000 extra in approved securities, restoring the portfolio to its initial value of $100,000, with a loan of $70,000.
- Selling about $23,000 in shares out of the leveraged portfolio, and using the proceeds to repay the debt. This would leave the investor with a portfolio valued at about $67,000, a loan of $47,000 and investor's equity of $20,000. This sale of shares is larger than the margin call in cash or securities because, as the investor's equity has been reduced to $20,000 by the decline in the market value of the portfolio, the maximum loan size this will support is about $47,000. Therefore, if the investor was not willing to top up the equity in the portfolio, the investor would have to sell enough shares (i.e. about $23,000) to raise cash to reduce the loan to this level.
Balance of Payments
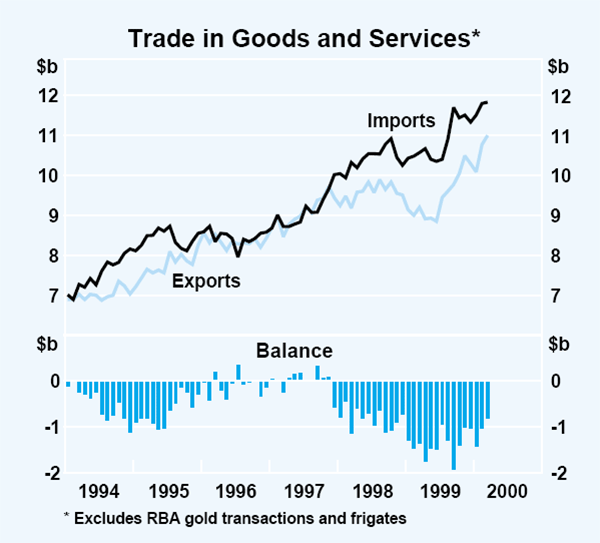
Australia's external accounts have improved since the middle of 1999, with the trade deficit narrowing from about 3 per cent of GDP in the June quarter 1999 to around 2 per cent of GDP in the March quarter 2000 (Graph 29). Export values (excluding the export of the ANZAC frigate) increased by about 5 per cent in the March quarter, while import values increased by 3½ per cent. Export growth has been broadly based across the major categories (Graph 30).
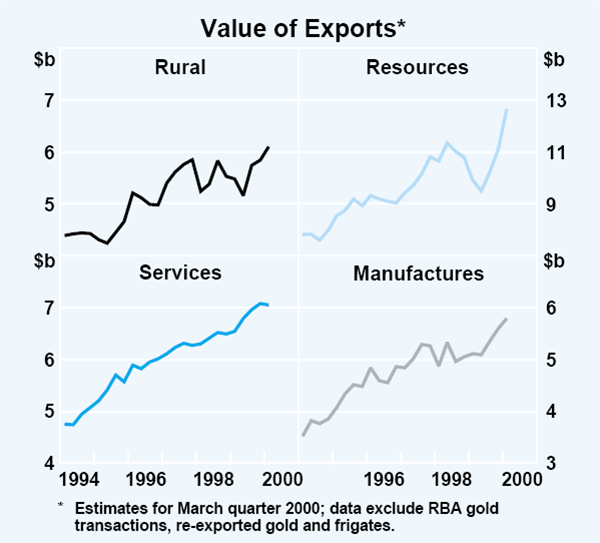
The continued strong growth in export revenues reflects the ongoing recoveries in the economies of most of Australia's trading partners. Exports to all regions have increased since June 1999, and in particular, exports to east Asia have increased by nearly 30 per cent over that time. Revenues have been bolstered by gains in a broad range of commodity prices in the March quarter, which in aggregate had remained flat in the second half of 1999. A number of large new resource projects have approached full capacity in the new year, and rural production levels remain high.
About half of the increase in resource export earnings over the past two quarters was the result of large gains in the value of oil, gas and petroleum exports. These gains flowed from the increase in the price of oil and related products, in conjunction with expansions in the production of these commodities as major new projects reached full production. Export revenues from processed metals and base-metal ores also increased strongly over the past six months. The commencement of production at a number of ore-related projects and the solid recovery in demand from some major east Asian trading partners underpinned these gains. The recovery in world demand has also contributed to a pick-up in export volumes for some of the major bulk commodities over the past few quarters, particularly iron ore.
The value of rural exports continued to increase in the March quarter. The volume of rural exports was bolstered in recent quarters by the high level of agricultural production, although this has eased in the early part of this year. The 1999/00 wheat crop is estimated to be at a record level of 24 million tonnes; similar strength in a number of other cereal crops has seen the volume of cereals exported also reach record levels. By contrast, beef exports have slowed, as, after a number of years of very strong growth, herd rebuilding has begun in earnest. Wool exports have enjoyed a rebound in demand from major foreign buyers.
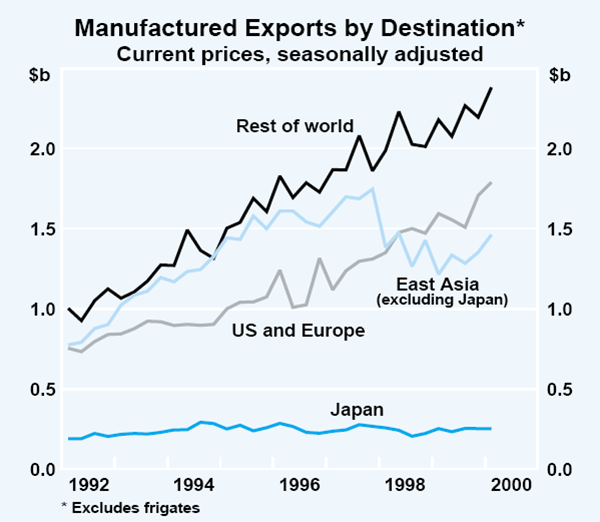
Manufactured export revenues (excluding the frigate) continued to grow solidly in the March quarter, after strong growth in the second half of 1999, to be about 13 per cent higher than a year earlier. The gains in the second half of 1999 were underpinned by a large increase in the export of transport equipment, particularly to the Middle East, which has subsequently eased. Manufactured exports to the US and Europe have been particularly strong recently, and exports to east Asia have begun to recover from the troughs in late 1998 (Graph 31).
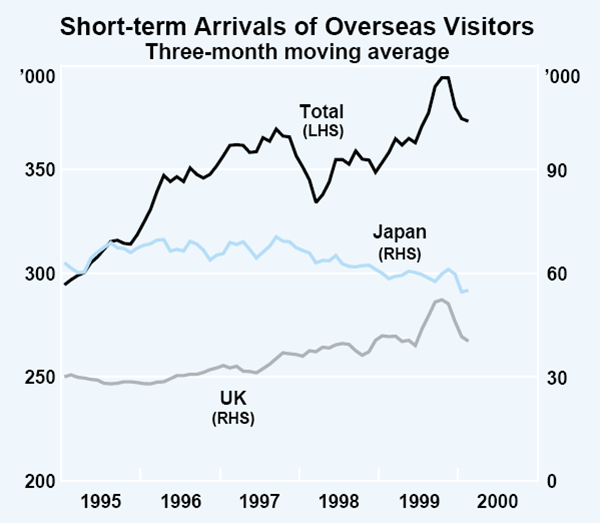
In contrast, the performance of service exports was less robust in the March quarter. This is, in part, attributable to falls in visitor arrivals from two of Australia's major tourist markets, Japan and the United Kingdom (Graph 32). Japanese tourist arrivals have been on a downward trend since 1997, reflecting the lacklustre growth in Japanese disposable incomes through this period. By contrast, the fall in arrivals from the UK in December and January followed a large sustained surge in the middle of 1999. In the period ahead, the depreciation of the Australian dollar and the approach of the Olympics is likely to provide a substantial boost to tourism exports.
Underlying import values increased by just under 7 per cent in the March quarter, an acceleration from the second half of 1999. Given a modest rise in import prices in the quarter, this suggests a strong rise in import volumes. Consumption imports remain very strong, and motor vehicle imports have recovered somewhat from the sharp fall in the December quarter. Underlying capital import volumes increased by about 20 per cent over 1999, almost entirely a result of increases in computer and telecommunications imports. The strength in capital imports continued into 2000, with telecommunications imports again being the major source of growth.
Net foreign debt rose in the December quarter, but was largely unchanged as a share of GDP at around 40 per cent, where it has been for a number of years. The ratio of net income payments to exports decreased slightly, to 16¼ per cent, in the December quarter.
Commodity prices
The prices of many of Australia's commodity exports rose strongly in the first 3 months of the year after remaining flat through 1999. The Reserve Bank index of commodity prices increased by 4 per cent in SDR terms in the March quarter (Graph 33). More recently, however, commodity prices in aggregate have fallen, with strong gains in rural prices being more than offset by weaker base metal prices.
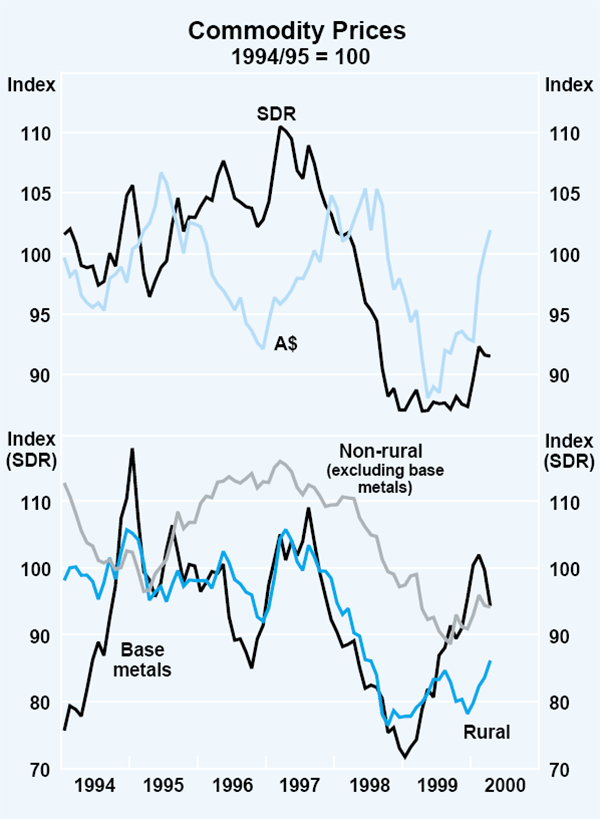
The strong rise in the base metals index in the March quarter was largely a result of a substantial increase in nickel prices, and, to a lesser extent, aluminium prices. Nickel prices rose as a result of the continuing strong demand from stainless-steel producers, and also the threat of supply disruptions due to labour disputes at some large nickel producers. Similar conditions of strong demand and low inventory levels underpinned the rise in aluminium prices. The more recent falls in base metal prices have been driven by expectations of a moderation in the outlook for demand for base metals. The gold price was flat in the quarter, although there was substantial price volatility, particularly in early February when a number of gold producers announced their intentions to reduce forward sales programs, causing the price to spike by over US$30 per ounce in the space of a few days.
Contract negotiations for bulk commodity prices for the current Japanese fiscal year (April 2000–March 2001) were recently concluded. Price rises of between 4 and 6 per cent (in US dollar terms) were agreed for iron ore exports, recovering some of the substantial cuts in the previous round of negotiations. Price cuts of about 4–5 per cent were negotiated for steaming and coking coal. These price changes will be reflected in Australia's export prices from the June quarter. At current exchange rates, prices for coal and iron ore will rise by around 4 and 14 per cent respectively in A$ terms from their levels a year earlier.
In late March, a group of nine OPEC members announced their intention to increase production of crude oil, as of 1 April 2000, back to pre-April 1999 levels. As a result, the price of West Texas Intermediate crude oil has fallen by about US$9 per barrel since its peak of around US$34 per barrel in early March. Reports of higher-than-anticipated stock levels in some major oil-consuming countries also reinforced the recent fall in oil prices. While Australia is a net importer of oil, the price changes have flowed through to other related gas and petroleum products.
The rise in rural commodity prices in the March quarter was predominantly driven by very strong increases in wool and cotton prices. Wool prices have been supported by strong demand from major buyers including China and Italy. The rise in cotton prices reflected stronger demand from Asian mills. Smaller price rises were recorded for barley, beef, rice and wheat. In contrast, sugar prices fell sharply in the March quarter, reflecting continuing world oversupply. More recently, sugar prices have recovered a little as demand from Asia and Russia has improved and adverse weather affected crops in the major sugar-growing regions of Queensland.
Domestic Financial Markets
Market interest rates
For reasons outlined earlier, the Bank has raised the target for the cash rate, in four steps, by 125 basis points over the past six months. These policy moves had in each case been anticipated by the market. The yield on 90-day bills, for example, began to rise in mid 1999 – well ahead of the first rise in the cash rate in November – and has consistently been above the prevailing cash rate target since then (Graph 34). While Y2K influences were a contributing factor for a period late in 1999, expectations about monetary policy have been the main underlying influence on short-term yields.
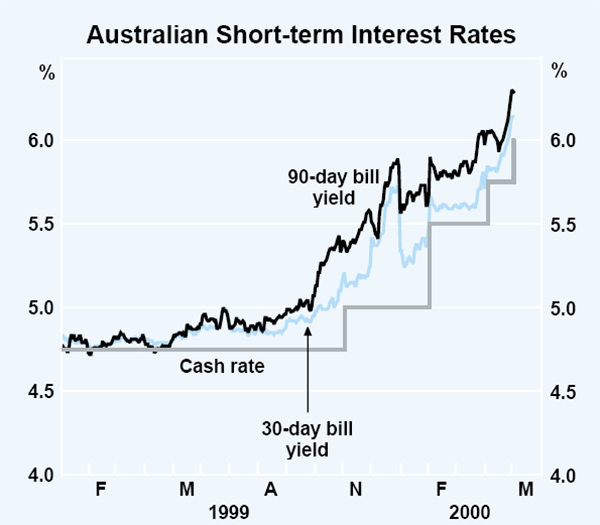
As noted earlier, virtually all developed countries apart from Japan have raised interest rates by between 100 and 150 basis points over the past six months or so, and to that extent developments in Australia have been part of a general worldwide trend.
Australian short-term interest rates have remained below those in the US throughout most of this period. Australian short-term interest rates fell below those in the US in 1997, when the US tightened monetary policy and the Bank eased (Graph 35). For most of the period since then, Australian rates have been around 50 basis points below those in the US, though this gap closed with the latest tightening.
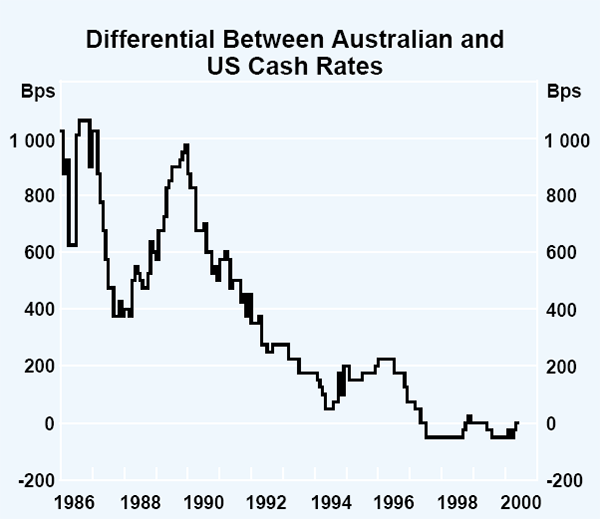
Long-term market interest rates in Australia have for several years now been strongly linked to those in the United States, possibly reflecting the link between the business cycles in the two countries and the broadly similar performance on inflation. Not surprisingly, therefore, the rally in bond yields in the United States in recent months has also been reflected in the Australian market, as the yield on 10-year bonds fell from about 7.3 per cent in late January to around 6.5 per cent early in May (Graph 36). As in the United States, this rally in Australia was also associated with a marked flattening of the yield curve, partly influenced by the favourable supply outlook for government bonds in Australia with the government continuing to run budget surpluses.
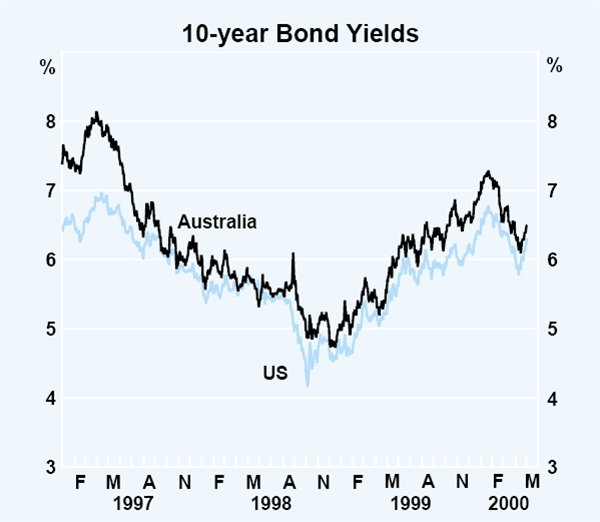
If anything, however, bond yields in Australia have recently fallen by more than those in the US. In early May, the yield on 10-year bonds in Australia was about 25 basis points above the corresponding yield in the United States, compared with an average level of around 50 basis points in the final months of 1999 and for much of the first quarter of 2000 (Graph 37).
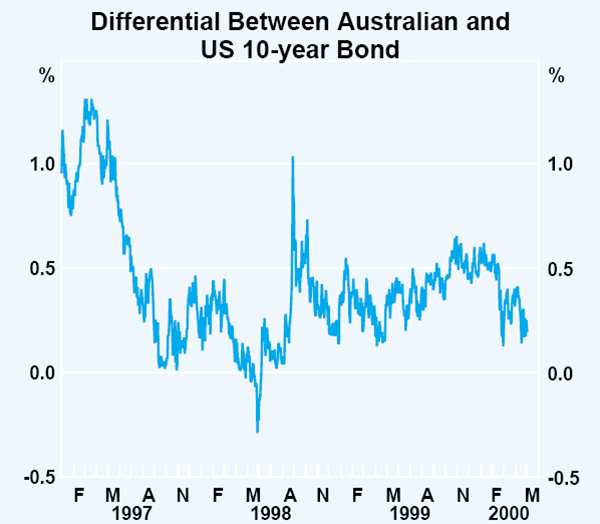
Intermediaries' interest rates
Banks, typically, passed on the 1 percentage point rise in the overnight cash rate involved in the first three tightenings by raising interest rates on variable-rate loans by a similar amount. Banks have not yet responded to the latest tightening. Increases in banks' lending rates since end October are summarised in Table 10.
| Change since end October | April 2000 | |
|---|---|---|
| Household | ||
| Standard-variable housing | ||
| – Banks | 1.00 | 7.55 |
| – Mortgage managers | 1.10 | 7.35 |
| Residential-secured overdraft | 1.05 | 7.70 |
| Credit card(a) | 0.80 | 16.10 |
| Small business(b) | ||
| Residential secured | ||
| – Overdraft | 1.10 | 8.05 |
| – Term | 1.00 | 7.65 |
| Other security/unsecured | ||
| – Overdraft | 1.15 | 8.60 |
| – Term | 1.05 | 8.10 |
| Large business | ||
| – Overdraft | 1.10 | 9.05 |
| – Term | 1.05 | 8.95 |
| Cash rate | 1.00 | 5.75 |
|
(a) With interest-free period (b) Indicator rates |
||
In the housing market, banks' standard-variable and basic lending rates are currently 7.55 per cent and 7.0 per cent respectively. Mortgage managers have increased interest rates on housing loans by more, on average, than have the banks, and by more than the increase in the cash rate, mainly because these lenders fund themselves in wholesale markets; consequently, their cost of funds has been pushed up by the larger increase in bill yields than in the cash rate over the past year (Graph 38).
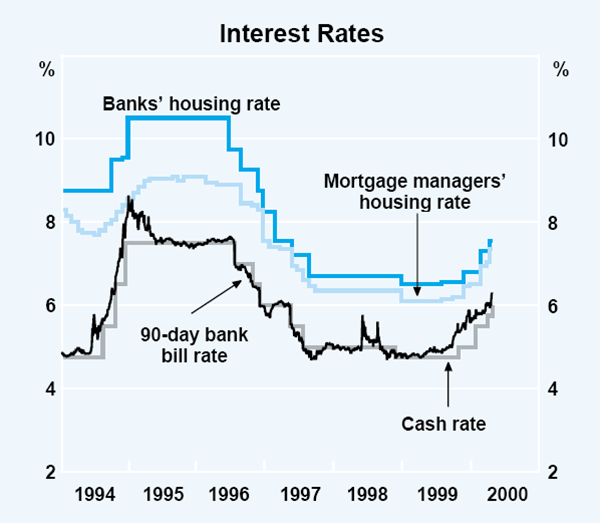
Banks also raised the interest rates on most other forms of lending to the household sector by a total of around 1 percentage point in response to the first three policy tightenings, bringing the interest rate on residentially-secured personal overdrafts to an average of around 7.70 per cent. Those major banks which have announced increases in credit card rates in response to the first three policy moves have increased these rates by an average of about 0.9 of a percentage point.
In the case of business loans, as well as responding to the first three tightenings of monetary policy, three major banks have also made additional adjustments to overdraft indicator rates, so that the increase in overdraft rates of these banks exceeded that in the cash rate by up to 0.5 of a percentage point.
Banks' fixed-rate loans rose by about 1.75 percentage points during 1999, in line with rises in yields in the capital markets in which these loans are funded. More recently, however, these rates have started to fall, again reflecting movements in capital markets. The interest rate on a three-year fixed-rate housing loan is currently 7.90 per cent, around 150 basis points above the late 1998 trough. The comparable indicator rate for a small business loan is 8.30 per cent, 200 basis points above the trough in late 1998. Despite the net rises over the past year, interest rates on fixed-rate loans, like those in variable-rate loans, remain below their previous cyclical low (Graph 39).
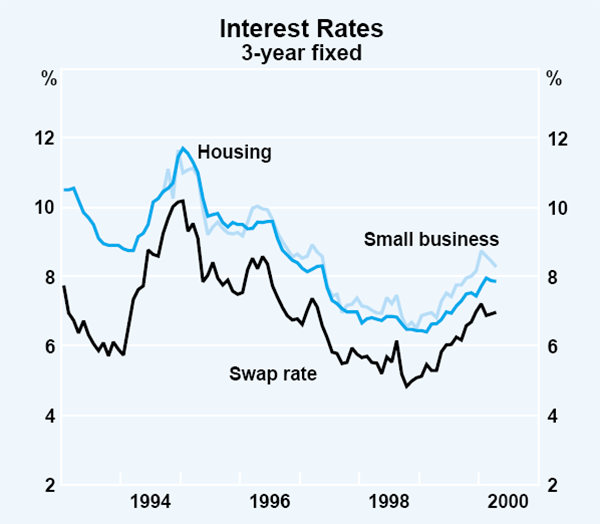
Interest rates faced by borrowers in Australia remain low, both in real and nominal terms (Graph 40 and Table 11). For example, notwithstanding the rise in interest rates to end April, the level of real and nominal interest rates for housing, personal and small business loans are still noticeably lower than at the time of the previous cyclical low in the structure of interest rates in 1993/94. At end April, intermediaries' variable interest rates for the household and small business sectors were about 120 basis points and 70 basis points, respectively, below their cyclical lows in 1993/94, reflecting greater competition among intermediaries which has produced a noticeable contraction in their interest margins. In real terms, intermediaries interest rates were also lower than in 1993/94.
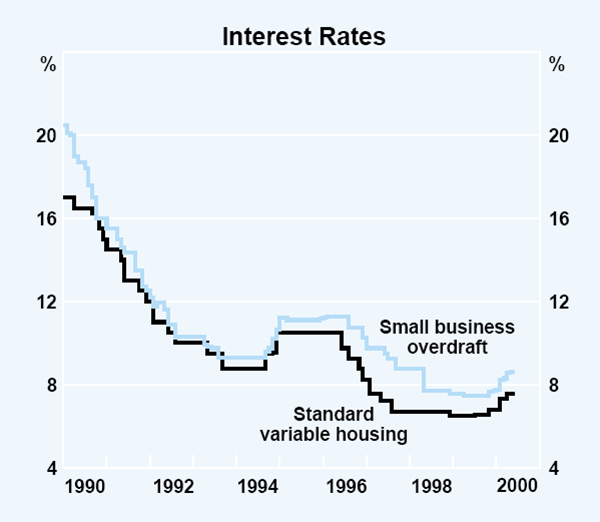
| Nominal | Real(a) | ||||||
|---|---|---|---|---|---|---|---|
| April 2000 |
Trough of 1993/94 |
Net change |
April 2000 |
Trough of 1993/94 |
Net change |
||
| Cash rate | 5.75 | 4.75 | 1.00 | 3.5 | 2.7 | 0.8 | |
| Housing | 7.55 | 8.75 | −1.20 | 5.3 | 6.7 | −1.4 | |
| Personal | 7.70 | 9.75 | −2.05 | 5.4 | 7.7 | −2.3 | |
| Large business | 9.05 | 9.00 | 0.05 | 6.8 | 6.9 | −0.2 | |
| Small business | 8.60 | 9.30 | −0.70 | 6.3 | 7.2 | −0.9 | |
| (a) Measured using underlying inflation. | |||||||
Share market
The All Ordinaries Index has been subject to similar, although generally less pronounced, gyrations to those evident in global share markets. The domestic market rose strongly from late in 1999, reaching a record high in late March, before falling in the past month or so (Graph 41). The peak in the share market in Australia came somewhat later than that in the Dow Jones index mainly because shares in the All Ordinaries Index were pushed higher early in 2000 by the strength of shares in News Corporation – the largest company listed in Australia – which were boosted by the strength of ‘new economy’ stocks globally. Excluding News Corporation, the pattern of moves in the All Ordinaries Index was similar to that in the broader US share price indices. The All Ordinaries Index is now about 6 per cent below its peak of mid March; excluding News, it has fallen by about 4 per cent.
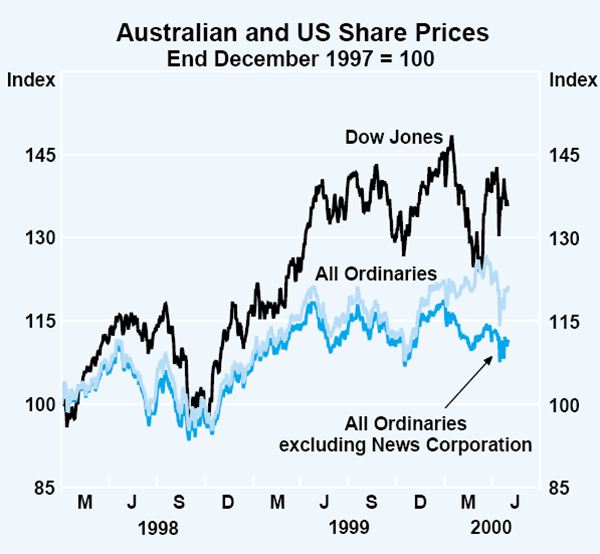
Most components of the All Ordinaries Index have fallen so far in 2000. The industrial sector (excluding financial companies and News Corporation) has fallen. Share prices of resource companies (excluding gold producers) have fallen by 12 per cent; share prices of gold producers have fallen by 29 per cent. The exception to this pattern of falling share prices was share prices of banks and insurance companies, which have risen by 1 per cent so far in 2000 (Graph 42). This rise is due, in part, to recent takeover activity as well as a growing perception that Australian financial institutions look to be ‘cheap’, in global terms, on standard valuations.
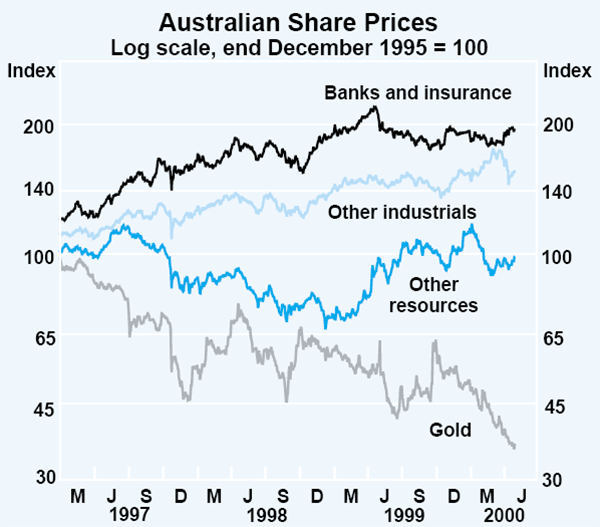
As in other countries, prices of technology stocks have been volatile. The Warburg Dillon Read (WDR) Technology Index of share prices of technology companies in Australia rose strongly, following the Nasdaq index, in the second half of 1999, moving to a peak in late March more than double its level in June 1999. Since then, however, the WDR index has fallen by about a third.
Australian dollar
After trading in a range of US63–67 cents through most of 1999, the Australian dollar has depreciated markedly in the first few months of this year, falling below US59 cents. As in the case of the euro, this fall has gone against generally bullish assessments by market analysts on the outlook for the currency. Early in the year, these bullish assessments looked like being borne out, as the currency rose to the top end of the aforementioned range. But in late January, the situation changed abruptly (Graph 43).
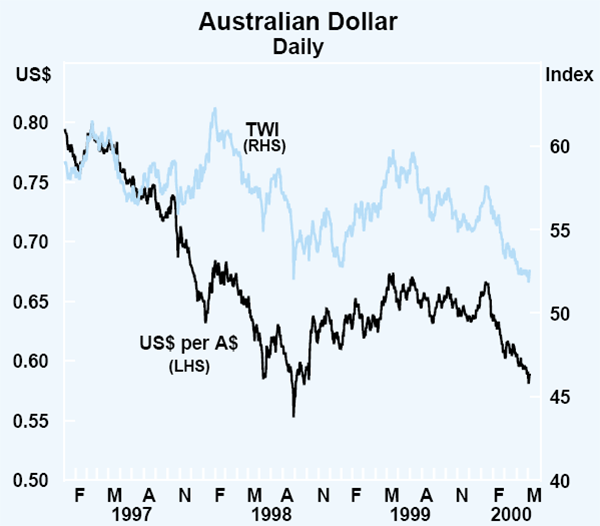
A view developed, encouraged by some softer economic data in Australia and some political comments about interest rates, that Australia was unlikely to match the anticipated monetary tightening in the US. The short-term interest differential relative to the US, already negative, was therefore expected to move further against Australia.
These considerations caused the exchange rate to fall by nearly US3 cents in one night in late January. Recovery over subsequent days was minimal and, before long, a downward trend emerged. A contributing factor was that the volatility of that night caused some investors to reassess the risks and returns in holding long Australian dollar positions, and to reduce their exposures accordingly.
Some analysts have sought to explain the fall in the Australian dollar as being more due to share market developments than interest rates. The reasoning here was that Australian companies were largely ‘old economy’ type companies and, therefore, out of favour with international investors. While perceptions about share markets may have played a role in the Australian dollar's weakness, it is unlikely this was a significant factor. The Australian All Ordinaries Index through the March quarter performed better than traditional US indices, such as the Dow Jones, and in line with the US Wilshire 5000 Index, which is a very broad index including technology stocks. The relatively good performance of the Australian share price index was due to News Corporation, whose share price rose very sharply through this period, in line with media stocks worldwide. In any event, movements in the exchange rate tended to coincide more with news which markets saw as affecting interest differentials. For example, the exchange rate took another significant step down in early March after the release of retail trade data which were significantly weaker than expected.
The Bank has not intervened in the foreign exchange market as, apart from the very sharp fall in late January, the fall in the exchange rate has been orderly. It has, however, gone back to meeting a significant part of the Government's foreign currency needs from reserves rather than putting them through the market.
Financial aggregates
Credit growth has picked up steadily in recent months, driven by increases in the rate of both household-sector and business-sector borrowing. Total credit grew at an annual rate of 13¾ per cent over the six months to March, compared with rates close to 10 per cent around the middle of last year (Table 12). Within the total, annualised growth in credit provided to the household sector was more than 17 per cent over the six months to March, compared with just over 10 per cent for credit provided to the business sector.
|
Year to March 2000 |
Six months to: | ||
|---|---|---|---|
| September 1999 | March 2000 | ||
| Total credit | 11.8 | 9.9 | 13.7 |
| – Personal | 17.2 | 16.0 | 18.5 |
| – Housing | 16.0 | 15.1 | 16.9 |
| – Business | 7.4 | 4.7 | 10.1 |
| Currency | 7.0 | 7.0 | 7.0 |
| M1 | 7.8 | 9.1 | 6.6 |
| M3 | 8.0 | 11.3 | 4.9 |
| Broad money | 8.3 | 9.8 | 6.8 |
Growth in the deposit aggregates slowed substantially in the second half of 1999, from the more robust growth seen around mid year. Although, on some measures, deposit growth has picked up again in 2000, recorded growth rates are still generally lower than the mid-1999 peak. Broad money and M3 grew at annual rates of around 7 per cent and 5 per cent, respectively, in the six months to March 2000. The slower growth of money relative to credit reflects the fact that intermediaries have found it more cost effective to fund their domestic lending with international raisings, rather than by growing their domestic liabilities.
Funds under management increased by around 4½ per cent in the December quarter, compared with the 0.7 per cent growth recorded in the previous quarter (Table 13). Continuing the pattern of the recent past, this growth is likely to have been driven by large valuation effects arising from movements in domestic and overseas equity markets. Growth in managed fund assets over the year to December slowed slightly, to just above 14 per cent. Within the aggregate portfolio of fund managers, the share of domestic equities and overseas assets (which are mainly equities) has risen, at the expense of traditionally less volatile assets such as deposits and debt securities, reflecting the good performance of share markets.
|
Quarterly percentage change |
Annual percentage change |
Level $b | Share of total Per cent | |
|---|---|---|---|---|
| Cash, deposits and loans | 0.2 | 11.9 | 66.8 | 12.2 |
| Short-term securities | −0.3 | 2.9 | 58.1 | 10.6 |
| Long-term securities | 0.5 | 1.7 | 75.3 | 13.7 |
| Equities and units in trusts | 7.2 | 17.7 | 163.2 | 29.7 |
| Assets overseas | 9.9 | 26.5 | 106.7 | 19.4 |
| Other assets | 4.4 | 16.1 | 79.5 | 14.5 |
| Total assets | 4.6 | 14.1 | 549.7 | 100.0 |
Non-government bond market
The non-government bond market in Australia continued to grow in recent months. Over the past year, the stock of bonds outstanding grew by around 50 per cent to $69 billion. Preliminary figures suggest that the level of non-government bonds on issue has now surpassed the level of Commonwealth Government securities outstanding (Graph 44).
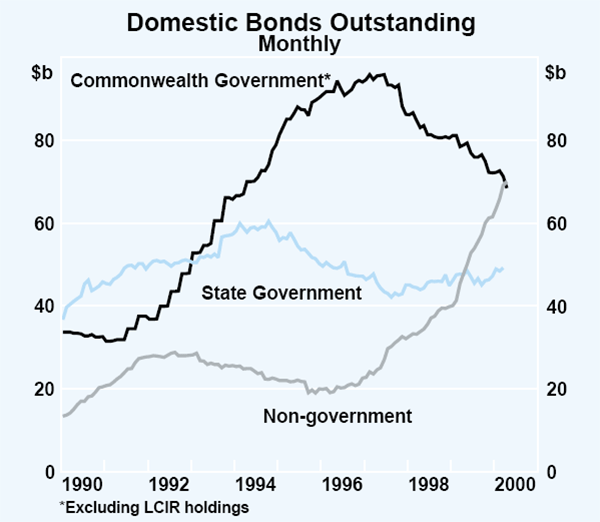
In recent months, issuers have shown increased willingness to approach the market for larger amounts and longer terms – one issuer raised more than $1 billion with a single offering (the largest non-government issue to date), while another issued maturities as long as 20 years (the longest bonds issued in Australia without a government guarantee). Growth in this market over the past year has been broadly-based, with the corporate sector, non-residents and asset-backed bonds all showing strong increases (Table 14).
| Banks and other financial institutions | 7 |
|---|---|
| Non-residents | 6 |
| Asset-backed | 5 |
| Other (mainly corporate sector) | 6 |
| Total | 24 |
| Memo item: | |
| Non-government bonds outstanding | 69 |
Inflation Trends and Prospects
Recent developments in inflation
Consumer prices
Measures of consumer price inflation increased further in the March quarter. The Consumer Price Index (CPI) increased by 0.9 per cent in the March quarter and by 2.8 per cent over the year, representing a sharp rise in the year-ended inflation rate from 1.8 per cent in the December quarter (Graph 45). The increase in CPI inflation is partly attributable to the dropping out of the health insurance rebate, which had reduced year-ended inflation rates during 1999. Other important contributing factors to increasing inflation in recent quarters have been the strong rise in petrol prices, driven by earlier increases in international oil prices, and recent increases in tobacco excise.
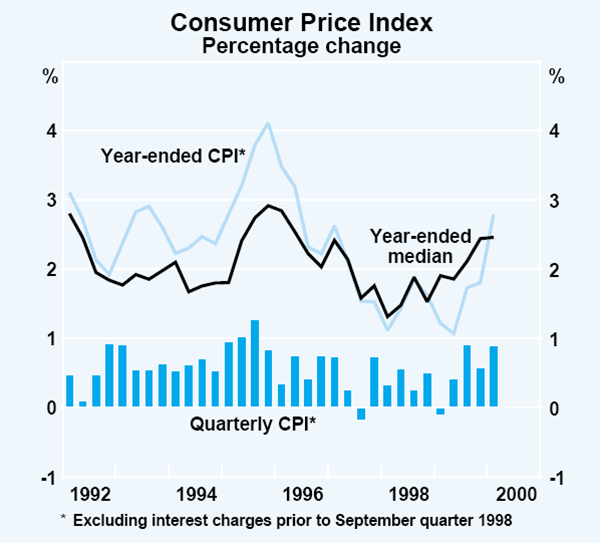
Measures of underlying inflation, which exclude or are less sensitive to movements in these volatile components, point to a more gradual increase in inflation over the past couple of years. Private-sector goods and services prices show an increase of 2¼ per cent over the year, as does the CPI excluding fresh fruit and vegetables and petrol, which is a broad measure of core inflation. The median and trimmed mean series are currently a little higher. Most of these indicators have increased fairly steadily over the past two years from a trough of around 1½ per cent (Table 15, Graph 46).
| Quarterly | Year-ended | |||||
|---|---|---|---|---|---|---|
| December 1999 |
March 2000 |
December 1999 |
March 2000 |
|||
| Headline CPI | 0.6 | 0.9 | 1.8 | 2.8 | ||
| – Tradeable component | −0.2 | 0.5 | 1.3 | 1.8 | ||
| – Non-tradeable component | 1.2 | 1.3 | 2.3 | 3.8 | ||
| CPI excluding ‘volatile items’(a) | 0.6 | 0.7 | 1.6 | 2.2 | ||
| Private-sector goods and services | 0.6 | 0.5 | 2.2 | 2.2 | ||
| Weighted median(b) | 0.6 | 0.7 | 2.4 | 2.5 | ||
| Trimmed mean(b) | 0.5 | 0.7 | 2.2 | 2.5 | ||
|
(a) CPI excluding fresh fruit and vegetables and automotive fuel. (b) For details on the calculation of these measures, see ‘Measuring Underlying Inflation’, Reserve Bank of Australia Bulletin, August 1994. |
||||||
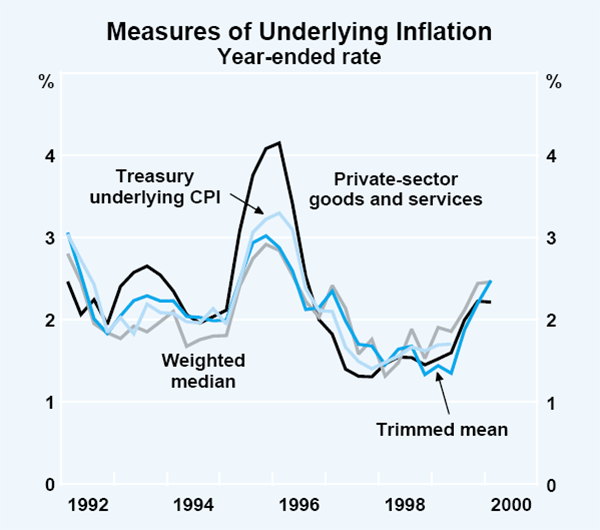
Petrol price movements, as noted above, have broadly followed movements in international oil prices. These peaked in March at above US$30 a barrel, but settled back to a level of around US$25 a barrel in April (Graph 47), following an OPEC decision in late March to increase production. Despite the recent decline, oil prices remain more than double the price prevailing in early 1999, and the increase over the past year has contributed significantly to rises in headline inflation rates in most industrial countries. In Australia, petrol price increases contributed 0.3 percentage points to the rise in the CPI in the March quarter, and 1 percentage point to the increase over the past year. If international oil prices remain around their April level, this would be likely to imply a small decline in petrol prices at the pump from their average March quarter level in the next quarter or two.
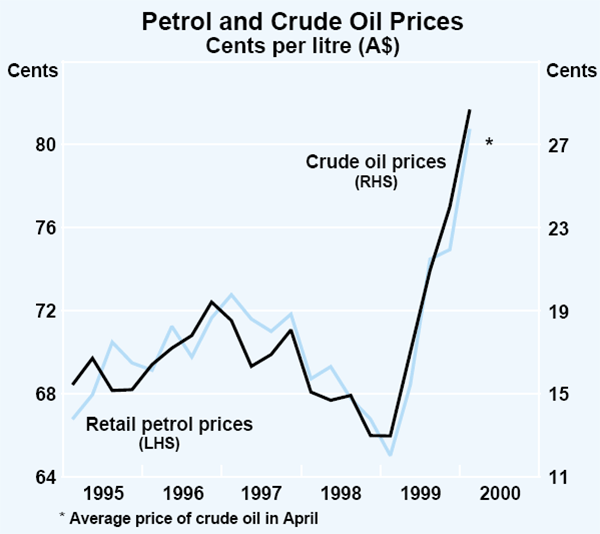
The cost of house purchase, which has the largest weight of any individual component in the CPI, continued to rise in the March quarter, to be 8 per cent higher over the year, contributing significantly to the increases in CPI and underlying inflation. The increase reflects the sustained strength of demand in the housing sector, which has for some time been supported by the ready availability of housing credit on attractive terms, and the emergence of supply bottlenecks in some parts of the housing industry. Some of the recent strength of housing demand also reflects the anticipation of higher costs associated with the introduction of the GST. Other housing costs have also been increasing, with privately owned dwelling rents rising by 3 per cent over the year, and property rates and charges by around 5 per cent. The price of insurance again rose strongly in the March quarter, largely reflecting the effect of the GST in current annual premiums.
These increases in prices in the March quarter were partly offset by further falls in the price of fresh fruit, and discounting in the price of overseas holiday travel and accommodation (some of which is seasonal). Prices of other predominantly imported items, such as audio, visual and computing equipment and household appliances also fell in the March quarter. The price of imported motor vehicles was flat in the quarter, but overall, car prices rose by 0.5 per cent. Over the past six months, car prices have nonetheless declined by 1.1 per cent, partly reflecting discounting by vehicle manufacturers ahead of the introduction of the GST.
As has been the case for some time, prices in the tradeables sector of the economy have on average risen more slowly than those in the non-tradeables sector. The prices of tradeable goods and services rose by 0.5 per cent in the March quarter and by 1.8 per cent over the year. Non-tradeable prices (a category dominated by services but also including house purchase prices) rose strongly in the March quarter, to take the year-ended increase close to 4 per cent. Taking out the effect of prices of items that are regulated or have a high tax component, private-sector goods price increases are running at an annual rate of 1.8 per cent, up from 1.1 per cent a year ago. The rate of increase of private-sector service prices has eased slightly, but remains above 3 per cent (Graph 48).
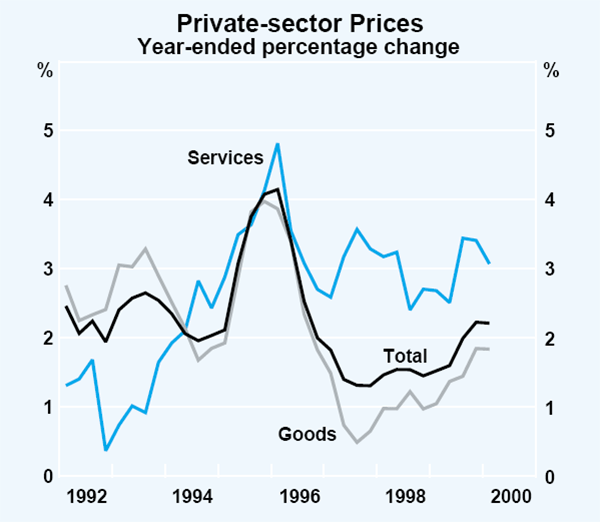
It is too early at this stage to see any effects of recent exchange rate weakness in the CPI. In import-weighted terms, the exchange rate reached a recent peak in mid January and has since declined quite sharply, to a level that is now around 7 per cent lower than the average during 1999. Some effect of the lower exchange rate is already evident in import prices at the docks, which (excluding oil) rose by 0.9 per cent in the March quarter, though the main impact on dock prices is likely to be recorded in the June and September quarters.
Producer prices
Strong growth in producer prices in the manufacturing, housing and some service industries continued in the March quarter (Table 16). In the manufacturing sector, price increases have been driven mainly by the rise in oil and base metals prices. Input prices increased by 3.7 per cent in the March quarter, to be 13.1 per cent higher over the year, with both domestic and imported input prices increasing strongly. Rising oil prices have accounted for much of the increase in input prices over the past year, but prices for base metals and chemicals also contributed and, even excluding crude oil, a significant pick-up in input-price increases is clearly evident.
| March quarter 2000 |
Year to March 2000 |
|
|---|---|---|
| Manufacturing | ||
| Input prices | 3.7 | 13.1 |
| – Domestic | 3.5 | 16.8 |
| – Imported | 4.1 | 7.8 |
| Final prices | 1.8 | 5.6 |
| – Excluding petroleum | 1.1 | 2.9 |
| Construction | ||
|
Materials used in house building |
1.9 | 3.6 |
|
Materials used in other building |
0.9 | 1.0 |
| Services | ||
| Transport and storage | 0.9 | 0.1 |
| Property and business services |
0.8 | 6.0 |
| Merchandise trade | ||
| Export prices | 4.3 | 6.9 |
| Import prices | 1.5 | 0.8 |
Rising input costs have in turn contributed to a sharp pick-up in prices of manufactured outputs. Over the past year, manufactured output prices have increased by 5.6 per cent. While the price increase in the fastest-growing component, refined petroleum, has been directly related to the higher price of crude oil, there have also been broadly based price increases across other parts of the manufacturing sector. Excluding petroleum, manufactured output prices rose by 2.9 per cent over the year to the March quarter, a sharp turnaround from the declines being recorded in these prices less than a year ago (Graph 49).
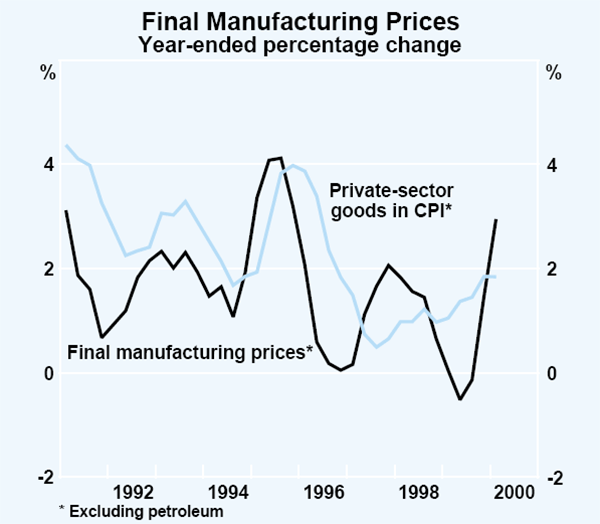
In the housing sector, the growth of materials prices has picked up further, reflecting the buoyant demand conditions in the industry. In the March quarter, house-building materials prices rose by 1.9 per cent, to be 3.6 per cent higher than a year earlier (Graph 50). The increases have been broadly spread across the major cities, although the most rapid increases continue to be in Sydney and Melbourne. Growth in other building materials prices also picked up in the March quarter, but remains moderate over the year.
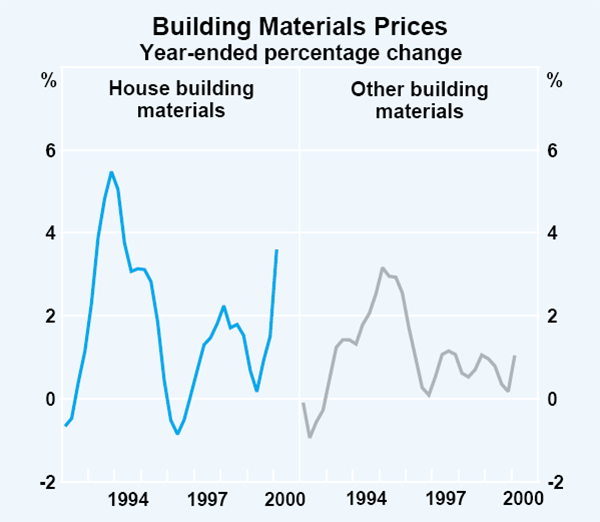
The strong demand in the housing sector is also evident in newly available data on service-industry prices. These show prices of property and business services having increased by 6 per cent over the past year, reflecting the effects of rising property prices and the increased demand for these services in the recent period. Prices of transport and storage services have shown little net movement over the past year but increased noticeably in the March quarter, probably partly reflecting increased fuel costs.
Labour costs
The Wage Cost Index for total hours (excluding bonuses) increased by 3.0 per cent over the year to December 1999, the same rate of increase as was recorded over the year to September (Graph 51). This measure of wages growth has remained at or slightly above the 3 per cent mark since annual figures became available in late 1998. Data for average weekly ordinary-time earnings (AWOTE) have, in contrast, shown more variability, and suggest an increase in wages growth recently. AWOTE increased by 4.0 per cent over the year to February 2000 compared with an increase of 3.1 per cent over the corresponding period a year earlier, and has grown particularly strongly in the two latest quarters. While this increase may signal some pick-up in aggregate wages growth, the volatile nature of these figures makes it difficult at this stage to draw firm conclusions. New federal enterprise agreements in the December quarter yielded average annualised wage increases of 3.4 per cent, slightly lower than those recorded earlier in the year (Table 17). In general, discounting the recent volatility in the AWOTE figures, the data suggest that growth of wages has remained well contained over the past couple of years, an outcome that has no doubt been helped by low inflation and generally low levels of inflation expectations.
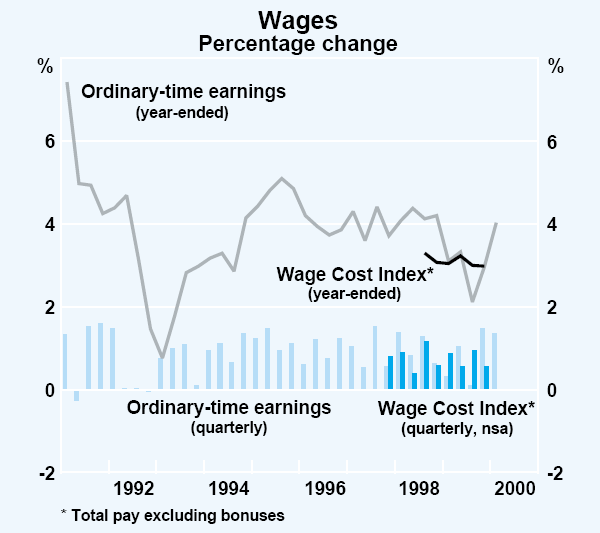
| September 1999 |
December 1999 |
March 2000 |
Year to latest |
|
|---|---|---|---|---|
| Quarterly | ||||
|
Wage Cost Index (total pay, excluding bonuses)(a) |
||||
| Private | 1.0 | 0.5 | .. | 2.8 |
| Public | 0.9 | 0.7 | .. | 3.5 |
| Total | 0.9 | 0.6 | .. | 3.0 |
| AWE survey | ||||
| AWOTE | 0.1 | 1.5 | 1.4 | 4.0 |
| AWE | −0.8 | 0.9 | 1.6 | 3.0 |
| Annualised | ||||
| New federal enterprise agreements | ||||
| Private | 3.6 | 3.5 | .. | |
| Public | 3.4 | 3.1 | .. | |
| Total | 3.5 | 3.4 | .. | |
| (a) Not seasonally adjusted | ||||
While the Wage Cost Index, which is the broadest measure of aggregate wage rates, suggests little change in overall wages growth in the recent period, there are some indications that tighter labour-market conditions may add to wage pressures in the period ahead. The major business surveys continue to point to a tightening labour market. The proportion of firms describing labour shortages as a ‘significant’ constraint on output, as reported in the March quarter NAB survey, remains at a higher level than has been typical in recent years. The ACCI-Westpac survey of manufacturers reported a substantial net balance of firms finding it more difficult to obtain labour, with the proportion of manufacturing firms citing labour availability as the most important factor limiting production at its highest level since the late 1980s (see Graph 28).
The extent to which these tighter labour market conditions might translate into higher wage outcomes remains to be seen. A number of major enterprise agreements are currently being renegotiated in industry-wide campaigns in the Victorian construction and manufacturing sectors. To some extent these outcomes will also influence agreements due for re-negotiation next year in other States. In the construction industry, a reduction in the standard working week to 36 hours has been a key demand in recent negotiations, and has been accepted by some employers. The exact impact this will have on hourly unit labour costs is not yet clear, and will depend on the extent to which offsetting productivity improvements are achieved.
An important uncertainty in the wages outlook at present is the potential impact of GST-related clauses in wage agreements. A number of recent negotiations, including those in the above-mentioned industries, have sought to include clauses aiming to provide additional compensation for the effect of the GST on the cost of living, over and above the compensation already provided for by income tax cuts and increased benefit payments. Approaches to this issue have varied quite widely, with some unions seeking specific compensation for CPI movements in excess of stipulated benchmarks, while others have sought a general right to re-open negotiations in the event that the GST impact on the CPI is larger than anticipated. The number of agreements containing clauses that could be triggered by GST-related price increases appears, at this stage, to be relatively small. However, there are signs that claims for such clauses to be incorporated in agreements will become more common in the coming months, hence adding to the degree of uncertainty in the outlook for wages growth over the next one to two years.
In its Safety Net Review decision, announced on 1 May, the Australian Industrial Relations Commission granted a flat increase of $15 a week in all award wage rates. This amounts to an increase of 3.9 per cent in the federal minimum wage. The increase is somewhat higher than those granted under last year's decision, which was for an increase of $12 for award rates below $510 a week, and $10 for those above that level.
Inflation expectations
Survey-based measures of inflation expectations continued to rise in the early part of 2000. This increase has partly reflected the impending introduction of the GST, which is expected to have a significant once-off effect on the price level, but may also reflect expectations of generally rising inflation in the context of a strongly growing economy. Rising global oil prices over much of the past year are also likely to have had a noticeable effect on inflation expectations, although more recently oil prices have been easing.
Consumers' year-ahead inflation expectations, as recorded by the Melbourne Institute survey, have increased during the past year, though the survey results have displayed considerable volatility at times (Graph 52). The median inflation expectation increased particularly sharply in the early months of 2000, reaching a peak of around 7½ per cent in February and March, before declining in April to 5.6 per cent. The recent volatility in the median expectation is partly a result of the clustering of consumer responses around whole numbers of 0, 2, 3, 5 and 10 per cent; this pattern has led to large shifts in the median stemming from some relatively small changes in the number of consumers reporting a 10 per cent expected inflation rate. Nonetheless, looking through the volatility, the general trend over the past year has been towards higher inflation expectations. While it is difficult to distinguish the expected effect of the tax package from other influences (petrol prices, for example), the generally increasing number of 10 per cent responses (currently around one-fifth of the sample) may reflect uninformed expectations on the part of some consumers of prices increasing by the full GST rate. This expectation, of course, takes no account of the offsetting effect of the abolition of the Wholesale Sales Tax and some other indirect taxes.
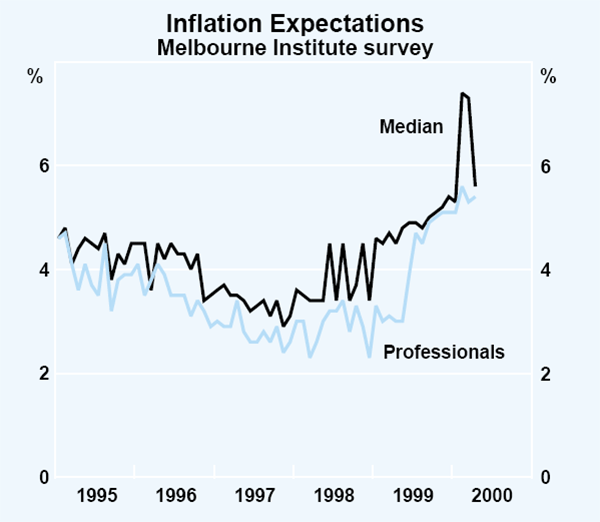
Business expectations for increases in costs and final product prices have generally picked up recently. The NAB business survey has in recent quarters reported a rise in the expected rates of increase in costs and prices, though the overall level of near-term inflation expectations implied by these measures is still quite low (Graph 53). The ACCI-Westpac survey of manufacturing firms shows a more pronounced pick-up in actual and expected output prices (Graph 54), consistent with the trend in producer price indices reported above. In the March quarter, the net balance of firms expecting to raise prices was close to its previous peak in early 1995. The same survey also reports an increase in expected production costs, though to a lesser extent. The Colonial State Bank survey reports similarly strong cost and price pressures in the NSW manufacturing sector.
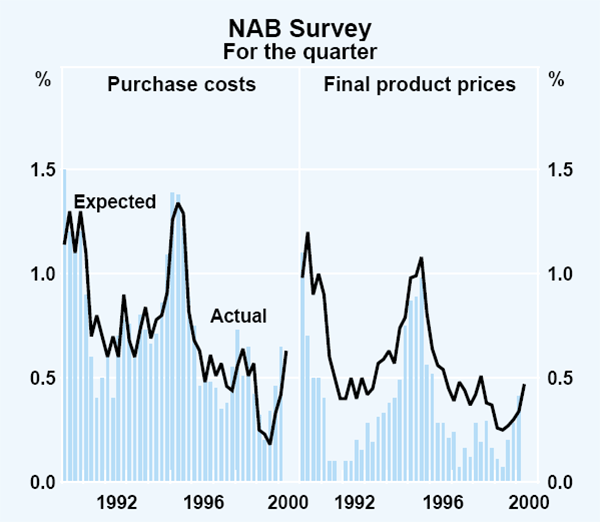
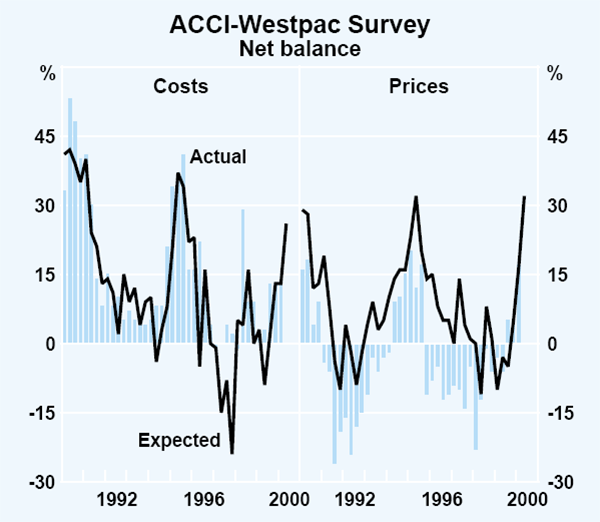
The inflation forecasts of financial market economists, as surveyed by the Bank following publication of the March quarter CPI, indicate some upward revisions, particularly for the year to June 2000 (Table 18). The median forecast for inflation over the current financial year is now 3.0 per cent, with the upward revision likely to have partly reflected the effect of recent increases in petrol prices. The forecast for inflation (excluding the GST) over the year to June 2001 was also revised up further to 2.6 per cent. Forecasts of the effect of the GST centre around 2¾ per cent, unchanged from the previous survey.
| Year to June 2000 | Year to June 2001 | ||||||
|---|---|---|---|---|---|---|---|
| October 1999 | January 2000 | April 2000 | October 1999 | January 2000 | April 2000 | ||
| CPI | 2.6 | 2.7 | 3.0 | 4.9 | 5.2 | 5.3 | |
| – Excluding GST | 2.4 | 2.5 | 2.6 | ||||
|
Source: RBA survey |
|||||||
Longer-term inflation expectations of financial markets, implied by the difference between nominal and indexed 10-year bond yields, have shifted quite markedly in recent months. The implied 10-year inflation expectation increased to a peak of around 3¾ per cent in mid January, but has since declined to an average of around 2¾ per cent in the past month, primarily reflecting movements in nominal bond yields. Given financial market volatility and the differing liquidity of nominal and indexed bonds, not too much significance should be attached to short-term fluctuations in this indicator. Nonetheless, despite their recent decline, the inflation expectations embedded in these markets remain clearly higher than they were a year ago.
Inflation outlook
The sharp increase in CPI inflation in the March quarter was widely expected, and owed much to two factors – the dropping out of the impact of the health insurance rebate (which had reduced the CPI in the March quarter 1999) and the recent increases in petrol prices. Nonetheless, abstracting from volatile influences, a more gradual rise in inflation has been evident for some time. Underlying inflation is currently around 2¼ per cent, up from a trough of around 1½ per cent two years ago.
One factor behind the gradual increase in underlying inflation has been the strength of domestic demand. The economy has for some time been growing more quickly than the growth of productive capacity, posting average annual growth of more than 4½ per cent over the past three years. With strong demand conditions, businesses have found it easier to increase their prices, and there has been some increase in inflation expectations of consumers and businesses, which appears to be only partly related to the expected impact of the GST. A particular area of demand pressure over the past year has been in the market for housing, but a range of underlying inflation measures indicate that price increases have been more broadly based.
At this stage there is no evidence of the economy encountering widespread capacity constraints, although supply bottlenecks have clearly emerged in parts of the housing industry recently (partly related to the bringing forward of demand ahead of the GST). More generally, measures of capacity utilisation for the economy have increased over the past couple of years and, although they have eased more recently, they remain at relatively high levels.
Recent developments in the exchange rate may have an important influence on the inflation outlook. In import-weighted terms the currency is around 7 per cent lower than its average in 1999. There is considerable uncertainty in assessing the likely impact of this currency depreciation on inflation. The longer-term history of the relationship between the exchange rate and import prices would suggest that, were the exchange rate to remain around these levels, there would be some significant upward pressure on inflation during the year ahead. This expectation is tempered to some extent by the experience of the past two years, when a substantial currency depreciation in the wake of the Asian crisis had a much smaller than anticipated effect on import prices. On the other hand, the currency depreciation on that occasion was accompanied by strong global disinflationary pressures which are no longer present. Indeed, the global economy is now stronger than at any time in the past three years. On balance, it would be surprising if, in the event of the recent currency depreciation being sustained for a significant period, this did not add noticeably to domestic inflationary pressures. The inflation outlook will therefore depend importantly on how long the lower exchange rate is sustained.
Another important influence on prospective inflation will be developments in wage-setting. As has been noted above, available indicators of aggregate wages (mainly covering the period up to the December quarter) continue to point to wages growth being well contained, although there are a few recent signs that wage pressures may be starting to increase. Labour market conditions have been tightening over the past year, and businesses have been reporting increased difficulties in obtaining suitable labour. In these circumstances, some upward pressure on wages growth might be expected to develop in the period ahead. The risk of a significant acceleration in wages could be heightened by increased inflation expectations, and by the high headline inflation figures that will be associated with the implementation of tax reform. One mechanism by which this might generate additional wage increases is through renegotiation clauses in wage agreements that could be triggered by the GST; there are signs that claims for these types of clauses to be incorporated into agreements may become more prevalent in the months ahead. It is also possible that high CPI outcomes might trigger a more general increase in ongoing price and wage expectations.
The Bank currently expects that in mid 2000, the year-ended rate of CPI inflation is likely to be around 3 per cent, with underlying measures of inflation generally around 2½ per cent. The introduction of the GST will then temporarily push inflation a good deal higher. The exact effect is uncertain, but based on the Government's published modelling of the tax package, the net impact of the GST and the removal of other taxes is expected to add around 2¾ per cent to the CPI over the year to June 2001. The effects of the elimination of wholesale taxes will probably take a little time to flow through completely, given that some of these taxes are levied at intermediate stages of production and will be embedded in production costs when the new system is introduced. Hence the very short-term impact of the GST could be expected to be somewhat larger than the 2¾ per cent expected by the end of the first year. If this is the case, the CPI rises in ensuing quarters would be relatively small, and the annual rate of CPI increase would be expected to decline gradually, though it would remain high during the first year. In the September quarter of 2001, it would then decline sharply as the GST initial impact dropped out of the calculation. The negative impacts of the reductions in other taxes flowing through to prices could then continue to hold down the CPI inflation rate for one or more quarters.
These effects will mean that it will, for some time, be difficult to discern the ongoing inflation rate by looking at the CPI – possibly until the first half of 2002. Existing measures of underlying inflation will also be affected by the GST. As a result, careful interpretation of the data will be required.
On present assumptions, inflation on a year-ended basis, and net of tax effects, is projected to be between 2 and 3 per cent in the second half of 2001, though possibly rising towards the higher end of that range. The assumptions underlying this projection include no second-round effects of the GST on wages and prices, and an average exchange rate around recent levels.
In the event that second-round effects on wages did occur to a significant degree, inflation would be higher than the forecasts envisage and there would be an increased risk of ongoing inflation exceeding the target. The extent of this risk would partly depend on how community expectations respond during the implementation of the tax package. It will be important for the community to recognise that a significant part of the initial price impact is temporary, and that the overall effect of the tax package is more than fully compensated by other changes to taxes and benefits. Similar considerations apply to the assumption of the exchange rate remaining around recent levels. In the event of a further sustained depreciation of the exchange rate, the forecast would be subject to upward revision.
Footnote Box A
In Canada a 7 per cent goods and services tax (GST) was introduced in January 1991, in Japan a 3 per cent value added tax (VAT) was introduced in April 1989, and in New Zealand a 10 per cent GST was introduced in October 1986. [1]