Reserve Bank Bulletin – May 1999 Semi-Annual Statement on Monetary Policy
Download the complete Statement 309KB
The Australian economy has performed impressively over the past year. The expansion, now nearly through its eighth year, is the longest since the 1960s. Growth last year again exceeded 4 per cent, which is above the trend experienced during the previous 20 years, at a time when the global growth environment has been anything but strong. The resulting moderate growth in employment has seen a further gradual decline in the rate of unemployment, which over recent months has been at its lowest for nearly a decade.
This outcome has been better than either the Bank or other forecasters had foreseen. The impact of the Asian crisis, and the associated global economic slowdown, had been expected to lead to some decline in Australia's overall growth rate, despite the evident strength in private domestic expenditure underpinning aggregate demand. As it has turned out, overall growth has declined by a good deal less than those forecasts envisaged, and the risks of a sharp decline in the near future have lessened.
At the same time, inflation has picked up slightly, but more slowly than the Bank's forecast a year ago. Over the year to March, inflation in underlying terms was 1¾ per cent. A key reason for the very low results recently has been that few tangible effects have so far emerged of the depreciation of the exchange rate which occurred between mid 1997 and the end of 1998. This is an experience shared by some other countries whose currencies have declined, in a world environment of generally very low inflation and highly competitive pricing. Domestic pressures for higher prices generally remain reasonably subdued as well. The Bank expects inflation in underlying terms to be about 2 per cent during 1999, the same as its forecast in February, and a continuation of Australia's excellent inflation performance during the 1990s. CPI inflation will remain below that over the coming year, as a result of the recent changes to health insurance arrangements.
This combination of strong growth and exceptionally low inflation is quite unlike the experience of the preceding thirty years. That such a performance has been maintained, almost two years after the Asian crisis first broke in Thailand, is indicative of the extent to which the Australian economy's underlying strength and resilience have been improved over time. These changes have included better arrangements for macroeconomic management, but also extensive improvements in the economy's structural features. Some importance must also be attached to the way in which the international economy has changed over recent years, particularly the increasingly competitive environment in a number of important global industries. Nonetheless, as yet we have only an incomplete understanding of these phenomena, and particularly of the extent to which they make for a persistent change in the economy's growth potential, as opposed to a temporary one.
International economic conditions continue to disappoint. Growth remains elusive in Japan, and weakened in Europe late last year. Such growth as there is on a global basis remains heavily dependent on the continuing strength of the US economy. Commodity prices, despite some recent gains, remain low, and it is still a difficult environment for those Australian producers who earn their incomes through exports. The effect of this is clear in Australia's declining terms of trade, and a widening in the current account deficit.
There are, however, some encouraging signs in Asia, where the contractions in economic activity in several of the initial crisis countries have ended, and where Korea in particular is recovering faster than expected. In addition, international financial markets have recovered from the sharp dislocations experienced in the second half of 1998, and have taken on a more positive tone, helped by significant easings of monetary policy in the major countries over the past six months. Share markets in many countries have reached new highs, debt markets are again accommodating substantial new issues by major corporations, and capital has begun to flow back into some emerging markets. The change in sentiment has affected currency markets as well, and the Australian dollar has risen.
The buoyancy in asset markets, together with a quite pronounced lift in measures of business and household confidence, is a noticeable feature also of the Australian scene. It is widely thought that factors such as the gains made by investors in privatisations and demutualisations helped to sustain household confidence and spending in 1998. But general asset market gains have continued since then. In the five months since the Bank eased monetary policy in December, the Australian share market has risen by over 10 per cent. Housing prices in the two largest cities are rising at a rate well in excess of the general rate of inflation.
In light of the weak world economy and the current subdued state of investment intentions in Australia, it is still reasonable to expect somewhat lower GDP growth during 1999 than the very strong growth recorded in the two preceding years. The risks of a larger decline in growth have diminished, however, since late last year. Indeed, the current buoyancy of asset markets, and business and household confidence, point to the possibility that this forecast, like earlier ones, could turn out to be too pessimistic. This shift in the balance of risks on the growth outlook, and the inflation forecast suggesting outcomes consistent with the target over the coming year, have been the key elements in the Bank maintaining an unchanged stance of policy over recent months.
Financial Markets
International markets
The past six months have seen a remarkable recovery in world financial markets from the events that followed the default by Russia last August. Concerns about a worldwide credit crunch and deflation have been replaced by a surge in credit, greater optimism about the world economic outlook, and new records in many share markets. An important part of this transformation has been easings of monetary policy by central banks in all developed countries, led by the US Federal Reserve.
The Federal Reserve reduced the Fed funds rate from 5.5 per cent to 4.75 per cent in three steps in September, October and November, largely to prevent a credit crunch from developing. Interest rates in the euro area were reduced by member central banks to 3 per cent in December 1998, and again by 0.5 per cent in April, as evidence of continued sluggishness in growth in the core of the euro area accumulated. Japan cut its target call rate from 0.25 per cent to 0.15 per cent in February and subsequently guided overnight interbank interest rates to (fractionally above) zero. Switzerland, the United Kingdom, Canada, Denmark, Sweden and Norway have also cut their benchmark interest rates; in the last four cases, reversing or partially reversing rises earlier in 1998.
The Fed's action ensured that the financial market fragility in the United States and in most other developed countries that became evident in the September quarter last year did not persist for long. Conditions in some emerging countries took longer to settle, particularly in Latin America where concerns about credit risk were particularly highlighted by the Russian default because of their chequered financial past. Credit spreads remained very wide and eventually took their toll on Brazil, where persistent capital flight caused the authorities to devalue, and then float, the exchange rate in January. While this caused some hiccups in other emerging markets, the flow-on effects were relatively mild, helped by the easier monetary policy stance in developed countries and the fact that, by then, the economies in some of the Asian countries had already showed signs of stabilising.
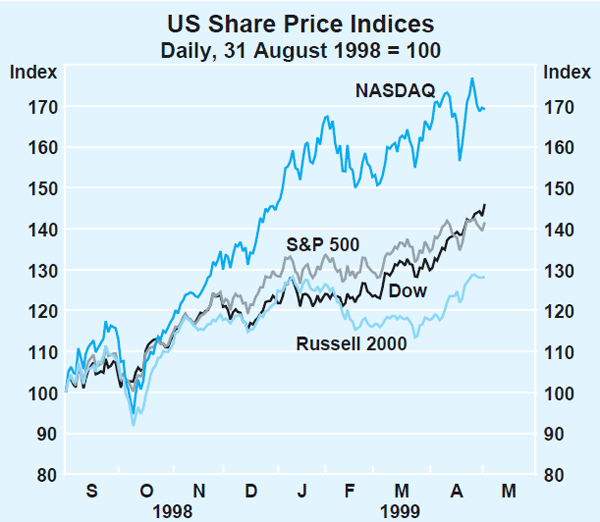
In developed countries, the recovery in financial markets over the past six months or so is most obvious in the sharp rally in US share prices. The Dow Jones index has risen by over 40 per cent since its trough last year, breaking 10,000 in late March and reaching a new high above 11,000 in early May (Graph 1). Other indices – which are either more broadly representative (like the S&P 500), have a higher technology weight (like NASDAQ), or have a higher small-firm weight (like the Russell 2000) – also show that share prices have risen strongly since the trough last year (Graph 1). Many commentators now regard at least some parts of the US share market as being in a financial ‘bubble’, leading to concerns that a share market correction could have a substantial negative impact on US economic growth and, consequently, the world economic outlook.
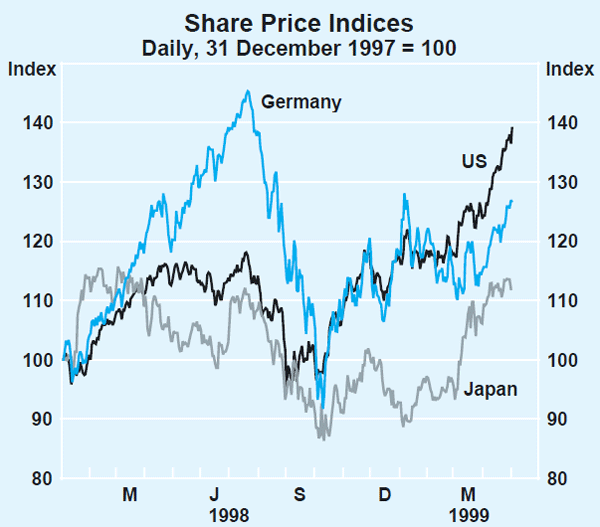
Share prices in other countries also rose, mainly in response to US developments but domestic factors also played a role (Graph 2). In Europe, increases over the past six months have been similar to those in the US, although share prices in Germany have not recovered to their mid 1998 peak. In Japan, share prices are about 30 per cent higher than six months ago, with most of the rise taking place in the past month or two, as markets have anticipated the start of a recovery in the Japanese economy. Bank stocks have rallied by over 65 per cent since plans to inject public funds of about 7.5 trillion yen (US$63 billion) and private funds of about 2 trillion yen (US$17 billion) into banks' capital were announced last October.
In bond markets, yields have generally risen after monetary policy was eased, a sign that those easings were successful in dispelling concerns about deflation (Graph 3). Over the past half year, US bond yields have risen in net terms by over 100 basis points, to 5.3 per cent. They were higher at one point but the outbreak of the Balkan war caused some ‘safe-haven’ buying of US securities. European bond yields have risen only marginally from their January lows; falls in inflation to below 1 per cent and sluggish economic activity have limited the rise. In Japan, bond yields rose more than elsewhere in late 1998, even though the Japanese economy remains the weakest among industrial countries. The reason for the sharp rise was perceptions about supply pressures in the Japanese government bond market following the announcement that the Trust Fund Bureau – a public body – would be curtailing previously large purchases of bonds in the market. Yields rose from a historical low of about 0.7 per cent in early October to over 2.5 per cent in January. This rise in government long-term interest rates – a benchmark against which many private loans are priced – raised fears that it might stifle the provision of credit in the economy, and various steps were taken to massage the yields down again, including the resumption of purchases by the Trust Fund Bureau. These measures have seen bond yields fall back to around 1.4 per cent.
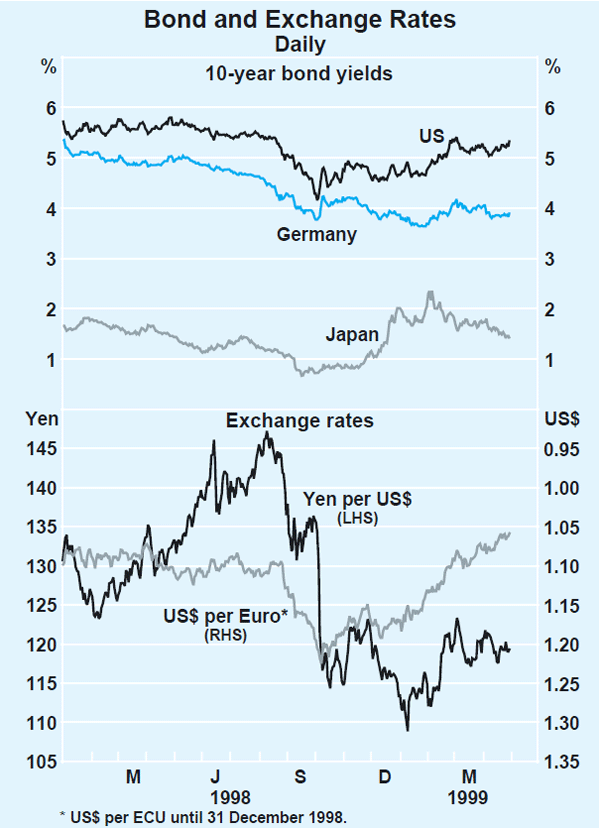
Foreign exchange markets in recent months have reflected the much stronger cyclical position of the US economy vis-à-vis Europe and Japan. The US dollar has strengthened by 11 per cent against the euro since the latter was introduced on 1 January, and by 6 per cent against the yen, at around the 120 yen level.
All in all, the major currency markets have been less volatile lately – a development which may reflect the reduced position-taking by hedge funds following the losses they suffered in late 1998 and the subsequent tightening of credit standards by the banks that had been funding them. This may, however, prove to be only a temporary respite. While data only cover a proportion of the industry and are not subject to due diligence, market reports indicate that investment flows into hedge funds have resumed in February after three months of substantial outflows. Moreover, there are reports that traditional investors such as pension/superannuation funds and US university endowments are shifting a portion of their investments into hedge funds as a form of diversification.
The so-called ‘emerging’ markets, which had been shunned by investors during 1998, have recovered even more strongly than developed markets over the past six months. In November, the IMF announced a US$41.5 billion restructuring package for Brazil. Compared to previous IMF programs, the package was not only better directed to the problem at hand – fiscal policy – but was also more pro-active and front-loaded. It did not, however, dispel market doubts about the ability of the Brazilian Government to meet the conditions and, as noted, the authorities were ultimately forced to devalue. But the crisis passed quickly and, more importantly, showed few signs of spreading to other emerging markets.
Exchange rates in Asia showed little impact from the Brazilian devaluation and, more recently, have risen. Some of these countries have used the improved sentiment and the foreign exchange inflows associated with current account surpluses as an opportunity to boost foreign exchange reserves and repay debt. Korea's usable foreign exchange reserves are now over US$50 billion, up from a trough of US$8 billion, and they have repaid US$4.8 billion of the US$28.6 billion disbursed under the IMF program. The impact of events in Brazil on other Latin American countries was more severe but, even there, there has been a noticeable recovery in financial markets in recent months.
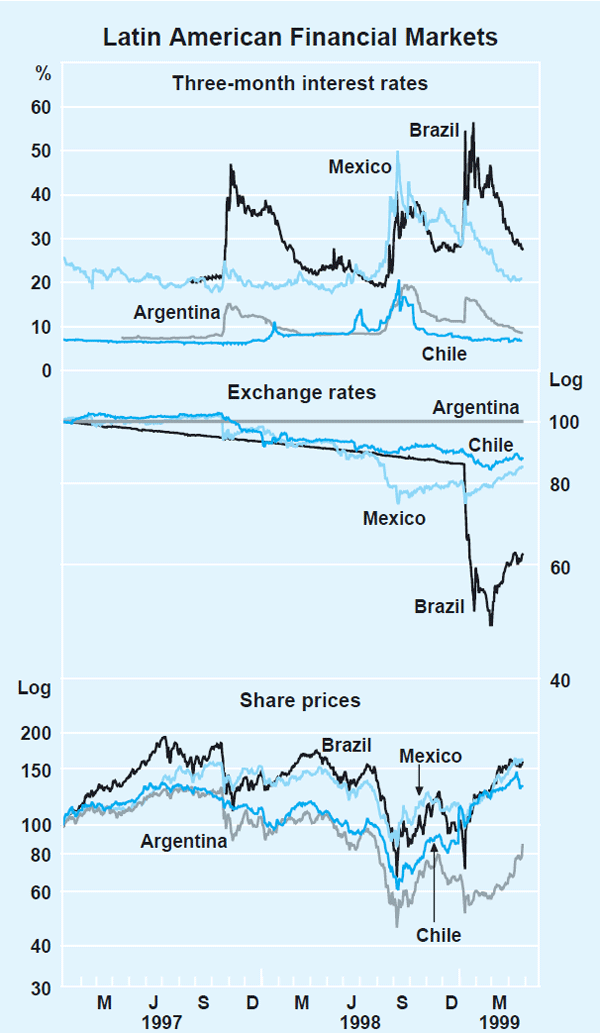
The strengthening in exchange rates has allowed the authorities in all emerging markets to cut interest rates. Interest rates are now at below-crisis levels in east Asia, apart from Indonesia where interest rates still remain high (though off their peaks) (Graph 4). In Latin America, apart from Brazil, interest rates have generally returned to pre-crisis levels (Graph 5).
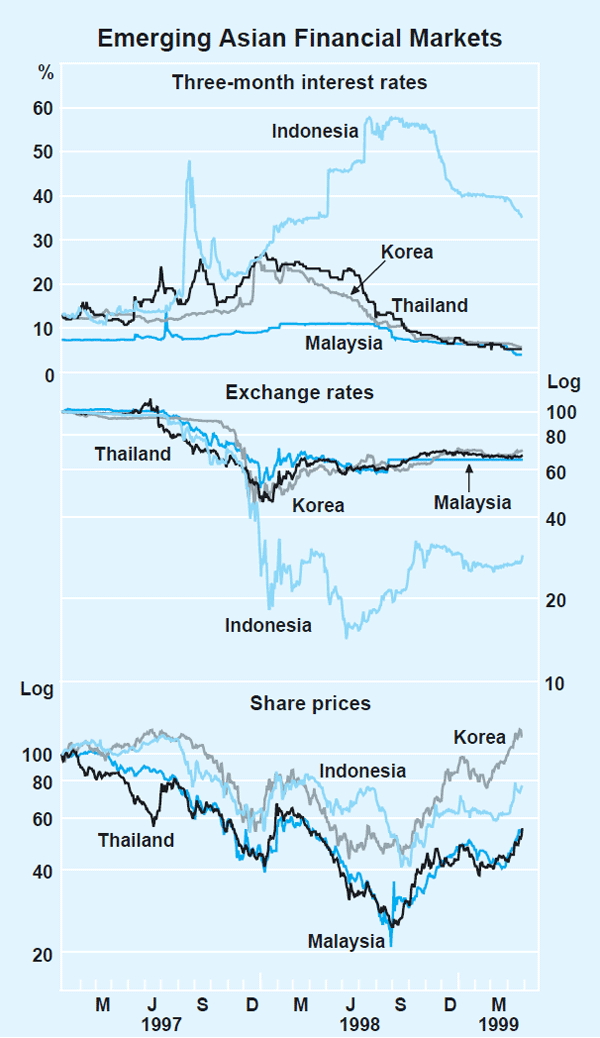
Lower interest rates have resulted in a more supportive climate for the financial restructuring that is underway in east Asia. Progress has been made in the initial crisis east Asian economies in closing or merging non-viable financial intermediaries and recapitalising banks; Korea and Malaysia in particular have shifted non-performing loans off bank balance sheets to asset management vehicles (Box A).
Share prices in most Asian and Latin American countries have risen sharply in recent months as foreign investors, sensing a turning point in these economies and fearing that they have missed the bottom of the market, have resumed substantial investment into these regions. In some countries, share markets have returned to mid 1997 levels.
Australian financial markets
Australian markets have been very much part of the world trends: monetary policy was eased, bond yields and share prices have risen. The exchange rate has also strengthened.
The easing in monetary policy took place on 2 December 1998, when the Bank announced a cut of 0.25 of a percentage point in the cash rate, to a new target of 4.75 per cent. This move brought the cut in the cash rate since July 1996 to 2.75 percentage points, and returned it to the same level as at its previous cyclical low of 1993/94. Short-term market interest rates had moved down to near the new cash rate target in anticipation of the policy announcement and subsequently remained near this level, consistent with the expectation that monetary policy would remain unchanged in the near term. The current level of the cash rate is similar to that in other English-speaking countries: rates in the US and Canada are also at 4.75 per cent, while in the UK and New Zealand they are at 5.25 per cent and 4.5 per cent, respectively.
In the bond market, yields had fallen sharply in late 1998 to 4.72 per cent, their lowest level since 1964, due largely to events in global markets at that time. As elsewhere, yields have subsequently risen as those global concerns diminished. The rise was helped by a run of continued strong data on the domestic economy, and 10-year bond yields reached about 5.75 per cent by early March. Yields declined for a time, but again moved higher following the news that domestic inflation, in underlying terms, was higher than markets had expected and US economic growth continues to surprise on the upside. By early May, the yield on 10-year bonds in Australia had returned to a level of 5.7 per cent, a net rise of 1 percentage point from the low point of mid December, but still low by historical standards. In the second half of the 1980s, the yield on 10-year bonds averaged 13.2 per cent, and even as recently as late 1994 they had been as high as 10.7 per cent.
Some of this fall in yields reflects overseas factors: the structure of long-term yields has fallen globally. But this does not explain all of the fall in the yield curve in Australia, as the spread between Australian and US bonds has narrowed from around 400–500 points in the early 1990s to around 20–40 points at present. Domestic factors have been important in this, the main one being the fall in inflation and the widespread confidence among investors that Australia will sustain low inflation. This is reflected in a narrowing of the gap between the nominal yield on conventional bonds and the real yield on indexed securities from about 5 percentage points in 1994 to 2 percentage points at present.
Improvement in the budgetary position, which has already seen a contraction in the supply of bonds and improved perceptions of the country's credit standing, has also been a significant factor in the narrowing of the spread between yields in Australia and the US.
Equity market
Share prices in Australia have increased by 26 per cent since their 1998 lows, less than the rise in the United States market in the same period. In recent months, the All Ordinaries Index moved through a series of record highs, and is currently about 3,100. The gold sector aside, each of the major sectors of the share market has moved up. Initially, the recovery was in share prices of banks (which have increased by an average of 40 per cent) and industrial companies (up by 21 per cent). More recently, the rise has been in resource companies (excluding gold producers), the average share price of which has risen by 31 per cent over the past couple of months. This rise is a reflection of the brighter outlook for commodity prices, and the greater confidence in the world economy.
While confidence has generally been high in the equity market, the rise in share prices in Australia has been concentrated among larger companies. Since the trough in the All Ordinaries Index last October, an index of the share prices of the 20 most-highly capitalised companies in Australia has increased by more than 30 per cent, whereas for other companies the rise was about 18 per cent. Within the group of large companies, banks have been strongest.
The Australian dollar
After recovering during September and October 1998, as hedge funds were forced to cut their short positions, the Australian dollar has been relatively stable over the past six months. For most of this period it traded in a range from US61 to US65 cents, but rose to higher levels more recently (Graph 6). Movements within this range have reflected the ebb and flow of expectations about world growth and commodity prices, changing views on the strength of the Australian economy and the prospective stance of monetary policy.
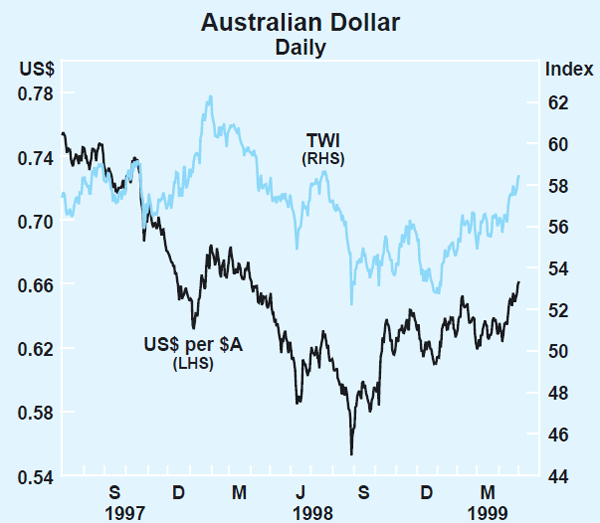
The expectation and then the reality of the monetary easing in December (combined with weaker commodity prices) contributed to a decline in the currency through late November and early December. With markets anticipating for a time that there would be an additional easing in monetary policy early in 1999, the dollar fell further to a low of around US61 cents in late December. Subsequently, better-than-expected domestic economic data and a rally in commodity prices (spurred by continuing strong US growth) took the Australian dollar to around US65 cents in early February – a rise that was partially reversed by the end of February as some of the bullishness about commodity prices receded and the trade account deteriorated.
Through March and April the dollar settled in the US62 to US64 cent range, before moving higher again in April, to break US66 cents. This rise reflected a number of factors, but in most part was due to firmer commodity prices, particularly base metal prices.
In the light of the greater stability in the market and the higher average level of the exchange rate, the Bank in mid April resumed its normal practice of covering the Government's foreign exchange needs by purchasing foreign currencies in the market. In the period since mid 1997, the Bank had met these needs directly from its foreign currency reserves.
Box A: Financial Restructuring in East Asia
The Asian financial crisis has shown, among other things, that healthy financial intermediaries are essential to the efficient operation of an economy. Many of the east Asian countries that experienced financial difficulties – Indonesia, Korea, Malaysia and Thailand – have begun a process of restructuring and repairing their financial systems: closing unviable institutions, removing the burden of non-performing loans (NPLs) from remaining banks and other financial intermediaries, and recapitalising viable institutions. There has been significant progress even though the methods of intervention and resolution, and the stage of progress, vary between countries.
Table A1 shows official estimates of non-performing loans at financial institutions following the Asian crisis. The size of the problem is large, although cross-country comparisons are complicated by different reporting and provisioning requirements. In Korea and Malaysia, non-performing loans in late 1998 were estimated at 23 per cent and 19 per cent, respectively, of total loans outstanding. In Thailand, they were more than double this. Official estimates are not currently available for Indonesia but market estimates of NPLs mostly range between 65 and 75 per cent of total loans.
| Indonesia | Korea | Malaysia | Thailand | |
|---|---|---|---|---|
| Non-performing loans | ||||
| Local currency | .. | W130 trillion | Rn71 billion | B2.7 trillion |
| US$ billion | .. | 107 | 19 | 74.5 |
| Per cent of total loans | .. | 23 | 19 | 46.5 |
| Asset management | ||||
|
Asset management vehicle (AMV) |
Asset Management Unit (part of IBRA) |
Korean Asset Management Corporation |
Danaharta |
Asset Management Company for NBFIs; individual bank AMVs |
|
Amount transferred (US$ billion) |
.. | 36.3 | 5.3 | 4.4 |
|
Estimated cost to public sector in restructuring (% to GDP) |
29 | 18 | 18 | 32 |
|
Sources: Fiscal cost estimates are from the IMF's December 1998 World Economic Outlook and International Capital Markets Interim Assessment. Other information is from: Korea – Financial Supervisory Commission, figures include precautionary loans (loans where interest has not been collected for between 1 and 3 months); Malaysia – Pengurusan Danaharta Nasional, figures for banks only; Thailand – Bank of Thailand; figures include NBFIs. Data are end-December 1998 but end-January 1999 for Thailand. |
||||
In some countries, non-bank financial institutions (NBFIs) play an important part of the intermediation process and official estimates of NPLs are predominantly for that sector. In Korea, for example, the figure of 23 per cent of total loans relates to the financial sector as a whole, including NBFIs. The Financial Supervisory Commission has announced that only 8 per cent of loans at banks are non-performing.
Countries have adopted a variety of methods in dealing with weak institutions (Table A2). In some cases, the authorities have focused on closing unviable institutions; for example, there has been substantial closure of private banks and mergers of state banks in Indonesia. In other cases, the authorities have preferred to retain existing institutions but substantially restructure, merge and recapitalise them, as in Malaysia. In Korea and Thailand, the authorities have closed non-viable NBFIs but have chosen to merge or nationalise banks rather than close them. In all cases, the authorities expect further mergers to take place.
| Indonesia | Korea | Malaysia | Thailand | |
|---|---|---|---|---|
| Banks | ||||
| Closed | 64 | 0 | 0 | 1 |
| Absorbed | 4 | 5 | 2 | 3 |
| Nationalised | 68(a) | 2 | 0 | 2 |
| NBFIs | ||||
| Closed | 0 | 87 | 0 | 56 |
| Absorbed | 0 | 6 | 16 | 0 |
| Nationalised | 0 | 0 | 2(b) | 12 |
|
(a) Includes 54 under IBRA direction. (b) Under the direction of Danamodal. |
||||
To enable banks and other financial intermediaries to resume lending, it is necessary to write off bad loans or remove impaired assets from their balance sheets. To this end, all countries have set up asset management vehicles (AMVs) which acquire NPLs and then sell them to the market, typically over a period of time to avoid ‘fire sale’ values. Generally, there is one AMV in each country, apart from Thailand which has provided for each bank to set up its own AMV (although it has one AMV for finance companies). Progress is most advanced in Korea and Malaysia (in the latter case, the process is expected to be complete by mid 1999). Some sales of distressed assets by AMVs have been made, but recovery rates are generally low, ranging between 12 and 48 per cent to date. Funds for AMVs are provided by deposit insurance corporations, the sale of distressed assets, bond issues and direct government or central bank funding.
Another focus of policy is to restore capital to international standards, but typically in graduated steps. Recapitalisation is being effected through different mechanisms. In all cases, public funds are being used – directly (Indonesia and Thailand), through the deposit insurance corporation (Korea) or through a special purpose vehicle (Danamodal in Malaysia) – often leaving the Government as majority owner of the banking system. In Indonesia, Korea and Thailand, use of foreign capital is part of the recapitalisation plan. Provisioning and reporting rules have also been generally tightened although they are not uniform between countries.
Financial restructuring has come at substantial fiscal cost. Fiscal costs are difficult to estimate: current IMF estimates range from 18 per cent of GDP in Korea and Malaysia to 32 per cent of GDP in Thailand, but market estimates are higher in some cases. In Scandinavia, the gross fiscal cost reached 17 per cent of GDP in Finland and 6 per cent in Sweden; in the United States, resolving the savings and loan crisis cost 2.4 per cent of GDP.
International Economic Developments
Growth of world GDP is estimated to have been about 2¼ per cent in 1998. Most forecasts for 1999 are generally for a similar outcome, with some pick-up forecast in 2000. Downside risks to those figures, which seemed considerable late in 1998, have lessened significantly in recent months, to the point where the IMF now characterises the risks to its own forecast as evenly balanced. As noted above, sentiment in financial markets has changed even more significantly, in anticipation of stronger global economic performance.
The Americas
The United States continues to be the mainstay of world economic activity, with the US economy now experiencing its longest continuous expansion since the 1960s. Moreover, for much of the current expansion (particularly the past three years), growth has outstripped most estimates of potential, without as yet sparking inflationary pressures.
After very strong growth in 1998, most forecasters had been expecting some slowing early in 1999. On the whole, however, the economy has continued to expand rapidly, with first quarter growth estimated at 1.1 per cent. Most of the strength in the March quarter was driven by consumption, which recorded its fifth successive quarter of growth over 1 per cent. The sustained strength in consumption reflects a combination of rising real wages and a historically high stock market, which together have resulted in record levels of consumer confidence and rising wealth.
The strong growth has not been distributed evenly across the whole economy. Weak external demand, combined with strong import penetration, has contributed to a decline in growth of manufacturing production to an annual rate of around 2¼ per cent, from 7 per cent at the end of 1997. Nevertheless, confidence in the manufacturing sector has recovered some ground over the past few months and sentiment about export orders, in particular, has picked up.
The economy has also benefited from the easing of the strains evident in US financial markets toward the end of last year. According to a survey conducted by the Federal Reserve, the proportion of banks tightening lending standards applied to businesses has fallen significantly. Spreads on corporate bonds over US Treasury bonds continue to decline towards their 10-year average, so that, while Treasury bond yields have increased by almost 1 percentage point since their lows late last year, interest rates on most categories of corporate debt have risen by a much smaller amount.
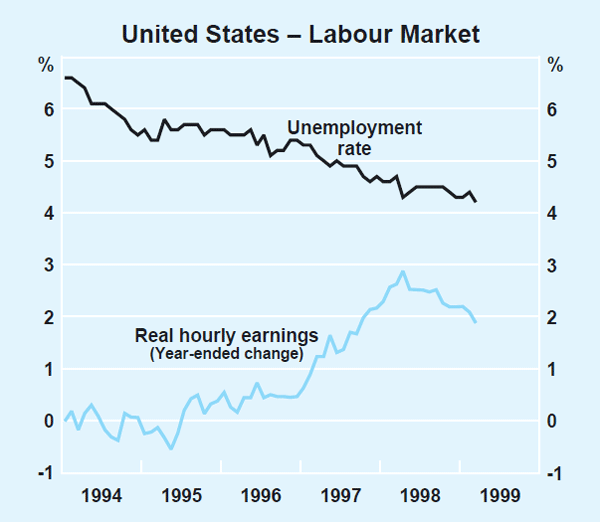
A feature of the current expansion has been the relatively strong growth in productivity. Non-farm business sector productivity rose by 2¾ per cent over the past year, more than double the average rate of productivity growth since 1980. Strong productivity growth has allowed for higher output growth and the associated low unemployment rate of 4.2 per cent – the lowest rate in almost 30 years – without generating inflationary pressures. Indeed, ‘core’ consumer price inflation (which excludes energy and food costs) in March remained at its lowest rate this cycle, 2.1 per cent. This behaviour contrasts with past experiences of low unemployment. Also surprising is that wage pressures have abated over the past year. Although real wages are still growing, their rate of growth peaked in April last year, and has consistently fallen since (Graph 7).
Benefiting from the strong economy of its major trading partner, the Canadian economy grew by 2.8 per cent over the year to December. The unemployment rate has fallen to 7.8 per cent, its lowest level in more than eight years, but with inflation around 1 per cent, the Bank of Canada reduced the overnight target interest rate to 4.75 per cent at the end of March. This completed the unwinding of the 1 percentage point increase in interest rates the Bank of Canada undertook last year when the currency was under downward pressure.
In Latin America, Brazil has, to date, weathered its currency crisis more successfully than many expected. Economic activity across the region has fallen sharply since the onset of the crisis, reflecting the high levels of interest rates aimed at resisting capital outflows during late 1998 and early 1999. There are tentative signs, however, that output is stabilising.
Asian region
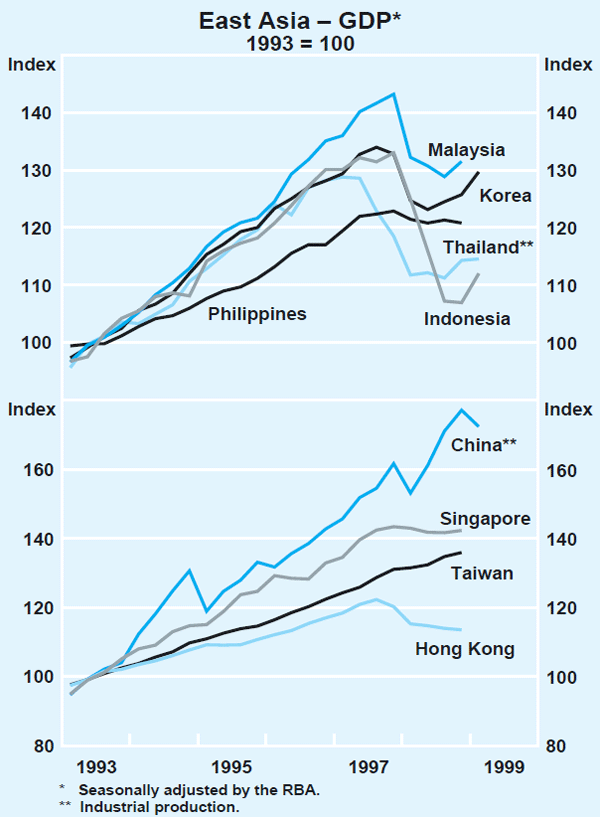
Economic conditions over much of east Asia have improved in recent months (Graph 8). In most of the countries which first entered the financial crisis in 1997, activity has generally stabilised, aided by lower interest rates and, more recently, expansionary fiscal policies. However, despite the large exchange rate depreciations experienced by these countries, to date there has not been any sustained pick-up in export demand – export volumes in Thailand have at best been flat, and have fallen in Indonesia; export growth in Korea has continued, but at a declining pace over the past year, after the strong initial boost in the wake of the 1997 currency depreciation.
The absence of a general export-led recovery in the initial crisis economies partly reflects the inadequacy of global demand for their products, the United States being the only major export market with strong growth at present. Another factor is that there has been some tendency (as discussed below) for exporters in these countries to absorb part of the impact of exchange rate depreciations in higher domestic currency prices, probably reflecting a need to rebuild profitability. More generally, recovery is being impeded by the poor state of financial and corporate sectors. While a number of reforms have been carried out and repair of financial and corporate balance sheets will be a long and arduous process, financial intermediation is yet to resume in any significant sense. Box A (above) discusses financial restructuring in detail.
Korea has seen a stronger economic recovery so far than the other initial crisis economies, and a stronger one than was generally anticipated. Real GDP reached a low point in the middle of 1998 and has since grown at an annualised rate of around 7 per cent (Table 1). While exports have made some contribution to growth in recent quarters, growth has been mainly driven by consumer spending. Spending by businesses on investment goods is weak, and may remain so for some time, given the prevalence of excess capacity in Korean industry. An increase in the pace of corporate restructuring may also have a negative impact on economic activity in the short term.
| Mar 98 | Jun 98 | Sep 98 | Dec 98 | Mar 99 | |
|---|---|---|---|---|---|
| Private consumption | −10.3 | 0.4 | 2.4 | 0.8 | .. |
| Public consumption | −1.2 | −0.8 | 1.4 | 0.2 | .. |
| Fixed investment | −17.8 | −3.7 | 3.1 | 0.6 | .. |
| Change in inventories(b) | −6.3 | 1.3 | −0.1 | 2.6 | .. |
| Net exports(b) | 11.4 | −2.7 | −0.2 | −2.6 | .. |
| – Exports | 7.9 | −3.0 | 0.2 | 3.7 | .. |
| – Imports | −26.0 | 5.4 | 1.1 | 15.4 | .. |
| GDP | −6.1 | −1.2 | 1.1 | 1.0 | 3.1(c) |
|
(a) Seasonally adjusted by the RBA. (b) Contribution to GDP growth; percentage points. (c) Preliminary estimate released by the Bank of Korea. |
|||||
The other east Asian economies – China, Hong Kong, Taiwan and Singapore – have been adversely affected because of their interdependence with the initial crisis economies, both as trading partners and competitors. This has been exacerbated to varying degrees by stresses in their domestic financial systems. In the case of Hong Kong and Singapore – which experienced recessions during 1998 – falling asset prices have had quite pronounced effects on activity. In China, there has been a slowdown in consumption growth, in part reflecting concerns over unemployment due to job losses associated with the reform of state-owned enterprises. To counterbalance these contractionary forces, government spending programs have been increased and monetary policy loosened.
Activity has begun to recover in New Zealand. After contracting by 1.6 per cent in the first half of 1998, GDP increased by 1.3 per cent in the second half, underpinned by strong consumption growth. Underlying consumer price inflation is at its lowest rate in a decade; prices increased by 0.2 per cent in the March quarter to be 1.0 per cent higher over the year.
Japan
Most indicators of the Japanese economy remain very weak, though there are some signs that activity may have reached a trough. The rapid contraction in industrial production evident through early 1998 appears to have been arrested towards the end of the year, with production remaining virtually unchanged since.
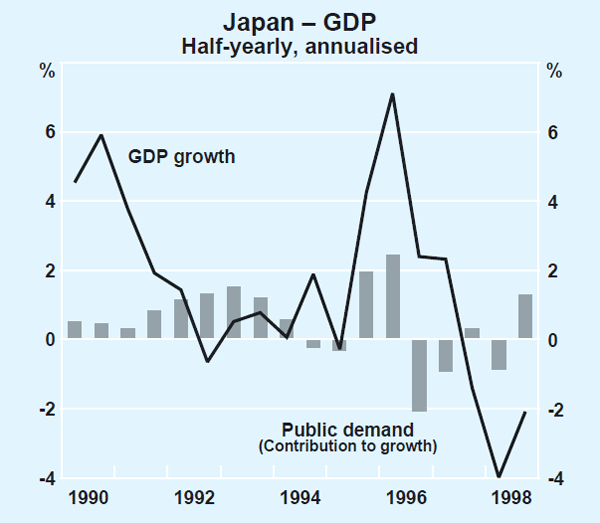
Part of this stabilisation probably reflects the impact of higher public spending, which partially offset the weakness in the rest of the economy in the second half of 1998 (Graph 9). However, it is not clear yet whether the fiscal stimulus will result in a lasting boost to private spending. Consumer spending has been stagnant since the April 1997 consumption tax increase. A series of income tax cuts in 1998 has failed to induce consumers to increase spending, in the face of falling wage incomes, and the impact on confidence of worsening employment prospects. Rising excess capacity, disruption in the process of financial intermediation, and record low levels of business sentiment have combined to depress business investment.
The extent of spare capacity in the Japanese economy is exerting downward pressure on prices; consumer prices declined by around half of a per cent over the year to March. The Bank of Japan allowed short-term money-market interest rates to fall to an effective rate of zero in March, although the efficacy of monetary policy in the current financial environment remains somewhat limited – Japan has had record low interest rates for some years now, with little obvious stimulus to aggregate demand.
Progress continues to be made in the reform of the Japanese financial system. The newly established prudential regulator, the Financial Revitalisation Agency, has approved applications from banks for infusions of public capital amounting to 7.5 trillion yen (US$63 billion). While this represents a take-up of only one-third of the funds set aside for capital injections, a further round of applications for public funds is expected later this year. Japanese banks have also benefited from recent strength in the Japanese share market; banks are currently allowed to count 45 per cent of the value of gains on their shareholdings as capital. This means that credit conditions may become increasingly supportive of growth. Signs that a trough has been reached in east Asia (which accounts for around half of Japan's exports) suggest that the external sector may be less of a drag on growth in the period ahead, but is unlikely to be strong enough to fuel an export-led recovery.
Europe
Activity generally slowed across the 11 euro area countries in the latter stages of 1998, principally reflecting a deterioration in export demand. The weakness in exports is evident in both intra-European trade and exports outside Europe and, in part, may reflect a loss in the market share of European producers. Consumer spending has supported growth, in line with very high levels of consumer confidence. In contrast, business sentiment continues to weaken, in part reflecting the weaker external environment. Among the larger euro economies, activity in France has been stronger than that in both Germany and Italy. The smaller euro area economies have experienced faster growth than the large countries, a trend likely to be accentuated by the significant decline in their interest rates that has occurred over the past year. Inflation across the euro area remains particularly low. The harmonised measure of inflation, which calculates price movements across countries on a consistent basis, is around 1 per cent. Inflation in the smaller euro countries has generally been running at a higher rate, in line with their stronger economic growth.
World inflation developments
Inflation has been unexpectedly low in a number of countries over the past year. In the United States, as discussed above, inflation has continued to decline, despite the expansion of the economy beyond previous estimates of sustainable capacity. In a number of east Asian countries, where high rates of inflation had been expected to ensue following their sharp currency depreciations, the actual increases in inflation were quite limited and temporary. There are also a few economies in the region – Japan, Singapore, China and Hong Kong – where consumer prices have been declining, either as a result of economic recessions or sharp reductions in import prices from the rest of the Asian region.
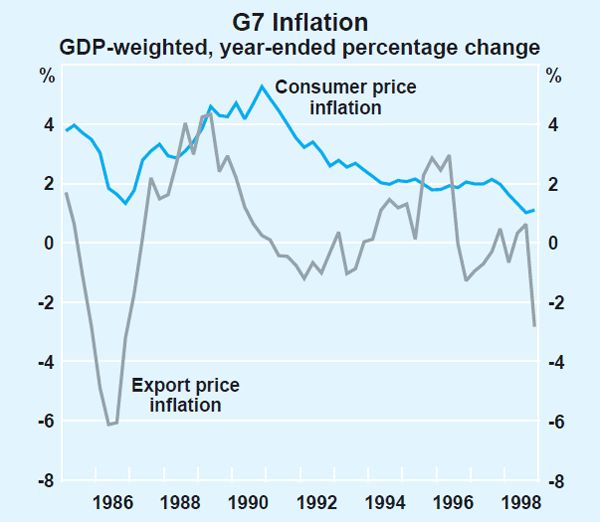
For the major industrial countries as a group, consumer price inflation is currently running at an average rate of just over 1 per cent, its lowest since the early 1960s. Export prices of these countries (in original currency terms) have been flat or declining over the past two years and, over the year to December 1998, they declined by around 2½ per cent (Graph 10). This difference between consumer and export price movements does not appear significantly out of line with past experience: export prices for industrial goods have typically increased by a few percentage points less than consumer prices each year, reflecting the faster average productivity growth in the traded goods sector.
Against this background, the question arises as to whether the east Asian currency depreciations are providing a source of additional disinflationary pressure at the global level. There are two aspects to this: the direct price effects flowing from these currency movements, and the broader impact of the Asian financial crisis through its effects on global activity.
In principle, currency movements do not in themselves create either inflation or disinflation at the global level, but redistribute inflationary pressures. In current circumstances, this would be expected to boost inflation among the crisis-affected Asian economies and to restrain inflation in the major industrial countries through lower import prices. This is broadly what has been observed although, as noted above, the effect on Asian inflation has been less than anticipated. Export price data suggest that the impact of depreciations has been partly taken in the form of higher domestic currency prices for Asian exporters, and partly as lower foreign currency prices for the foreign purchaser. Since June 1997, the average price of exports from east Asia has declined in US dollar terms by just over 10 per cent, compared with a decline of 1¼ per cent in the average price of exports from the G7 economies. In Korea and Thailand for instance, local currency export prices have risen by around 20 per cent over the same period, accounting for around two-thirds of the impact of their currency depreciations. Thus, price developments in the Asian economies are exerting some downward pressure on world traded goods prices (in US dollar terms), but not as much as might be suggested by the size of their exchange rate movements.
More generally, the Asian financial crisis, coupled with the pronounced weakness of the Japanese economy, has contributed to a decline in global GDP growth from over 4 per cent in 1996 to an estimated 2¼ per cent in 1998. This decline in growth implies an increasing degree of global excess capacity in the recent period, which can be viewed as the more basic source of global disinflationary pressures. When global growth picks up sufficiently, this excess capacity will be gradually absorbed, but some degree of disinflationary pressure may persist in the near term.
Domestic Economic Activity
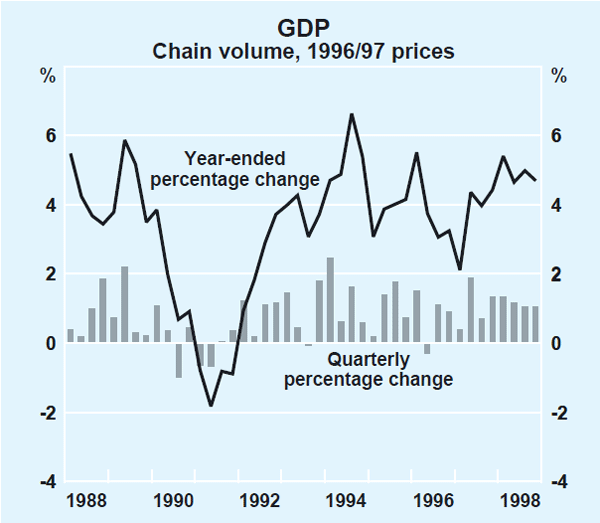
The Australian economy continued to grow strongly during 1998, despite the weakness in trading partner growth (Graph 11). Real GDP increased by 4.7 per cent over the year, and preliminary indications are that growth may have continued at only a slightly reduced pace in the early part of 1999. The overall growth in GDP has been sufficient to generate a continued decline in the unemployment rate, to a current level of 7.4 per cent. There has, however, been a notable change in the composition of growth, with private demand growth declining over recent quarters, to an annual rate of just under 3 per cent, from rates of around 6 per cent a year ago. Growth in public expenditure has increased sharply (Table 2).
| Six months to: | Year to December 1998 |
||
|---|---|---|---|
| June 1998 | December 1998 | ||
| Expenditure | |||
| Private final demand(a) | 2.7 | 2.9 | 2.8 |
| Consumption | 2.4 | 5.5 | 4.0 |
| – Goods | 3.0 | 3.1 | 3.0 |
| – Other(b) | 2.0 | 8.2 | 5.1 |
| Dwelling investment | 17.6 | −10.0 | 2.9 |
| Business fixed investment(a) | −2.5 | −2.9 | −2.7 |
| – Equipment(a) | −12.9 | −11.5 | −12.2 |
| – Non-dwelling construction(a) | 12.4 | 18.3 | 15.3 |
| Public final demand(a) | 5.7 | 10.0 | 7.8 |
| Change in inventories(c) | 2.3 | −1.0 | 0.6 |
| Net exports(c) | −0.5 | −0.5 | −0.5 |
| Gross domestic product | 5.1 | 4.3 | 4.7 |
|
(a) Excluding transfers between the public and private sectors. (b) Excluding dwelling rent. (c) Contributions to growth in GDP. |
|||
Business investment and housing investment both declined in the December quarter, while the pace of growth in consumer spending has picked up strongly. Favourable financial conditions and rising asset prices have played an important role in supporting consumption growth, and should continue to do so in 1999. These factors also appear to be giving renewed support to other areas of private spending. Despite some downward revisions to investment intentions reported earlier in the year, overall business confidence is at high levels, and finance for both housing investment and businesses is growing strongly at present.
Household income, wealth and expenditure
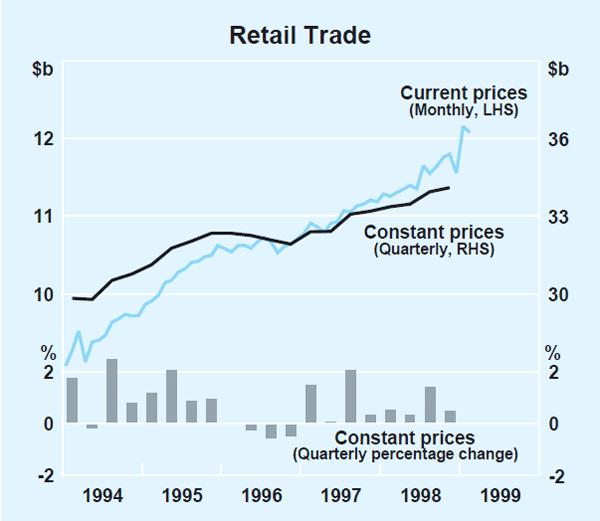
Consumption growth picked up to an annual rate of 5.5 per cent in the second half of 1998 from a rate of 2.4 per cent in the first half. The renewed strength in consumption was especially apparent in the services sector, with spending on recreation and other services growing particularly quickly. The strong momentum of retail spending continued in the early part of 1999. After falling by around 2 per cent in December, the estimated value of retail trade increased by more than 5 per cent in January in seasonally adjusted terms, and only retraced a small part of that gain in February (Graph 12). The monthly volatility probably reflects the difficulty associated with removing the seasonal element during the Christmas period as shopping patterns change. Looking through the volatility, growth between November and February averaged just under 1 per cent per month, a pick-up from the already strong growth through the second half of 1998.
An improvement in consumer confidence has been apparent since the middle of 1998. In the first half of the year, consumers had generally reported that their personal financial situations were reasonably good, but their assessments about the prospects for the Australian economy deteriorated sharply. In this environment, consumers may have felt it prudent to curtail expenditure on discretionary items or to delay the purchase of major household appliances. In the second half of the year, as the domestic economy continued to expand at a healthy rate and the unemployment rate edged down, consumers became increasingly optimistic that this good performance could be sustained. Currently, the Westpac-Melbourne Institute index of consumer sentiment is well above its decade average, and higher than the levels prevailing prior to the onset of the international financial crisis.
Spending on motor vehicles has evolved somewhat differently to other areas of consumption. Prompted by low interest rates and competitive pricing, sales of motor vehicles increased by 26 per cent between the start of 1997 and mid 1998, despite the weakening in consumer confidence towards the end of that period. For some households, spending on motor vehicles may have contributed to reduced growth in other areas of spending over that period. More recently, there has been some reversal of this pattern. Motor vehicle purchases have been roughly flat since the middle of 1998, while, as noted above, spending on other discretionary items has picked up markedly.
The growth of consumer spending has continued to outpace the growth of household disposable income, implying a further decline in the household saving ratio over the past year (although broader measures of saving have not fallen to the same extent – see Box B). According to the national accounts, real household disposable income increased by 2¼ per cent over the year to the December quarter, with relatively strong growth in wage incomes being offset by higher tax payments and slower growth in other income components. While recorded income growth has been quite modest, strong increases in household wealth have been an important factor contributing to the recent performance of consumption. Since the asset price increases associated with this are not counted as income in the national accounts, the process has contributed to the overall decline in recorded household saving.
Growth in household wealth has been particularly robust since the end of 1995, with both physical and financial assets increasing (Table 3). Dwellings are by far the largest portion of household wealth, and house prices have increased steadily in recent years, including a 10 per cent increase in Sydney and Melbourne over the year to December 1998. In previous episodes of rapid house price increases, such as the late 1980s, the effects of the expansion of wealth on consumption were probably quite small. However, the increased availability of home equity lines of credit in recent years has made this wealth much more accessible and, since these products carry a lower interest charge than unsecured personal lending, borrowing against this expansion in wealth to fund consumption is more attractive.
| Level $b | Share of total wealth |
Year-ended growth |
Average annual growth since December 1995 |
|
|---|---|---|---|---|
| per cent | ||||
| Dwellings | 1,370 | 54.4 | 8.6 | 10.7 |
| Consumer durables | 117 | 4.6 | 4.4 | 2.9 |
| Financial assets | 1,033 | 41.0 | 10.0 | 11.6 |
| of which: – Equities |
175 | 6.9 | 28.5 | 20.5 |
| – Superannuation and life offices | 546 | 21.6 | 7.6 | 12.3 |
| – Other | 313 | 12.4 | 5.7 | 6.5 |
| Total wealth | 2,520 | 100.0 | 8.9 | 10.7 |
|
Sources: ABS and CBA/HIA Housing Report. |
||||
The other main contributing factor to the rise in wealth has been the increase in share prices. Increasingly, households are seeking higher rates of return than are available on deposits, and are turning to the share market and managed funds with exposure to equities. Accordingly, household direct holdings of equities, while only a small proportion of total wealth, are rising strongly, both through net new purchases and increases in the price of existing holdings. The proportion of households owning shares is higher than in a number of comparable countries (see ‘Australian Financial Markets’, Reserve Bank of Australia Bulletin, March 1999). The increasing propensity to own shares has also been encouraged by a marked reduction in the costs of trading in shares due to the introduction of on-line services for this purpose. Some part of the increase in share ownership is also accounted for by holdings of a small number of high-profile stocks such as Telstra and AMP. The capital gains on these shares may have underpinned the recent pace of consumption growth.
The strength in consumption has also been encouraged by the low cost of borrowing. As nominal interest rates have fallen, households can manage the interest payments on larger loans, and more households can afford to borrow. Contributing to this effect, competition among financial intermediaries has generated larger interest rate reductions on home equity lines of credit than the fall in cash rates over the same period. Moreover, as mentioned above, the increased use of such products has further reduced average borrowing costs.
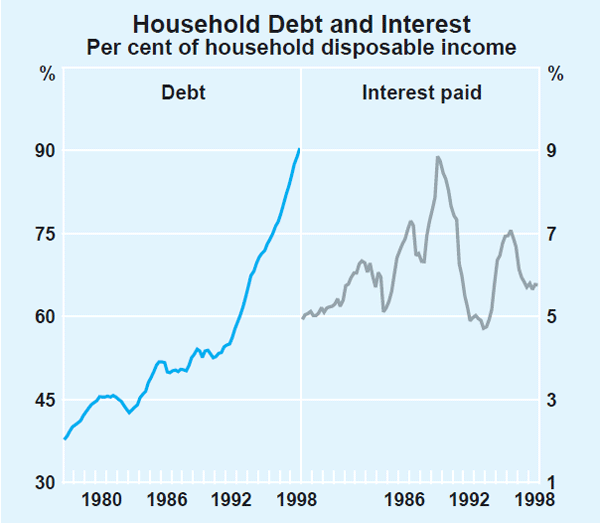
The above developments have resulted in relatively rapid growth in household debt, which increased by over 13 per cent in the year to March (Graph 13). Financial deregulation and a shift to low inflation have brought about a similar expansion in household indebtedness in other comparable countries. Indeed, as a ratio to income, the indebtedness of Australian households is about average compared with other countries, after starting from a relative low point in the early 1990s. Nevertheless, a continued period of rapid growth in household credit could generate concern, given that households will have to service their higher debt levels out of nominal incomes that are growing at a much slower rate than in the higher-inflation era of the 1970s and 1980s.
The housing market
One of the factors contributing to weaker overall growth in private demand in the second half of 1998 was a decline in dwelling investment. After a couple of years of strong growth, housing investment activity reached a peak in the middle of 1998 and tailed off in the second half of the year. Over the year as a whole, dwelling investment rose by around 3 per cent, compared with growth of 16 per cent in 1997.
This pattern of growth was consistent with indicators of building approvals, commencements and finance commitments, which also weakened in the second half of the year (Graph 14). More recently, however, these forward indicators of housing activity have partly reversed those declines. After falling by around 7 per cent over the second half of 1998, the number of local building approvals has picked up in recent months. In the three months to February, building approvals were about 5 per cent higher than in the previous three months, with approvals for both houses and medium-density dwellings rebounding. The value of approvals for alterations and additions, while volatile, has picked up by almost 7 per cent over the same period. Housing loan approvals have also shown renewed strength, with the value of loan approvals rising by 6 per cent over the three months to February.
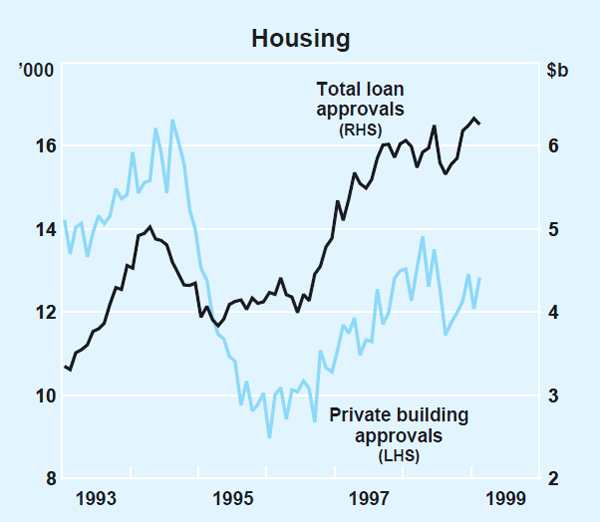
These signs of firmer demand appear to reflect the significant shift in the interest rate environment since mid 1998, with speculation about a possible interest rate increase around that time eventually giving way to the reduction in interest rates that occurred in December. Greater borrower confidence in the outlook for continued low interest rates is signalled in a switch back towards greater use of variable-rate housing loans, after a sharp swing towards fixed-rate loans in mid 1998, as borrowers sought to lock in what they saw as a trough in interest rates. Taken together, the recent pick-up in the forward indicators points to some increase in housing investment activity in the near term after the decline recorded in the second half of 1998 although, to keep this in perspective, the level of building approvals is still below the mid-1998 peak.
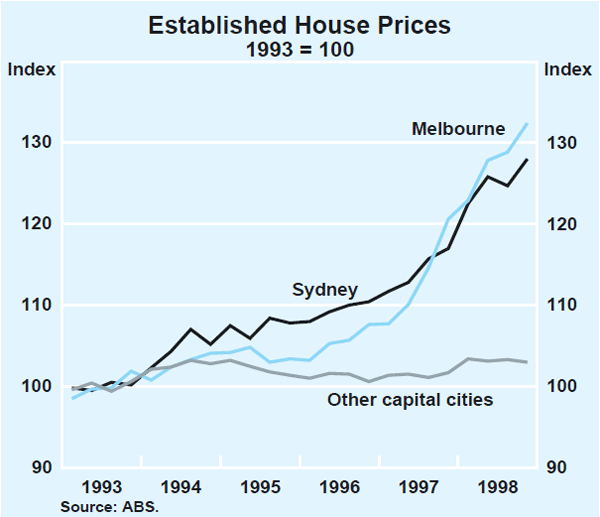
The recent strengthening of housing demand, and the more favourable credit conditions, have been reflected in higher house prices in a number of cities, as discussed above. This is particularly apparent in Sydney and Melbourne, where house prices have increased by around 10 per cent over the past year (Graph 15). In the March quarter, dwelling rents rose modestly in all capital cities except Brisbane, where they were unchanged. Over the past year, rents have increased by 3 per cent, slightly faster than the overall inflation rate, with increases being recorded in all capital cities. The continued increase in rents gives support to the view that the decline in housing activity in the second half of 1998 was not symptomatic of any generalised excess supply.
The business sector
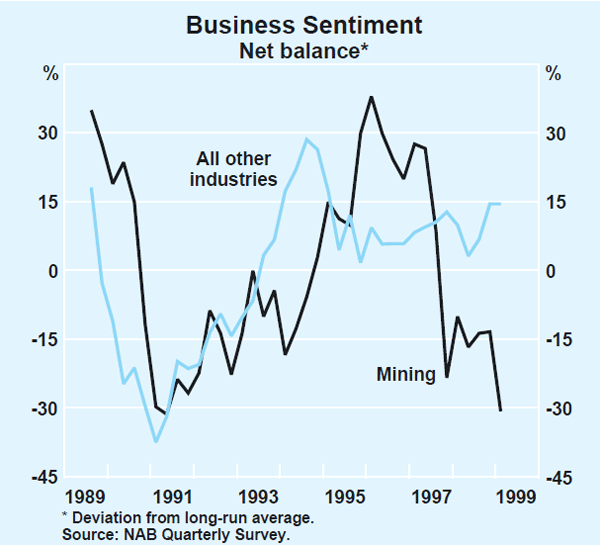
Businesses are experiencing favourable conditions overall, with most surveys showing that confidence has remained at high levels in the early part of 1999, following a sharp rebound at the end of last year (Graph 16). There are, however, some significant disparities in conditions across industries. In general, those industries whose business is mainly reliant on domestic demand are experiencing robust trading conditions. This includes much of the services sector such as property and business services, the communications industry and retailing. More difficult conditions are being experienced by those firms more exposed to foreign markets. This applies particularly to the mining industry, where output has been declining over the past year, and to tourism. In the manufacturing sector, sentiment has recovered strongly in the past six months, based on stronger expectations for new orders, exports and output.
Aggregate corporate profits, as measured by gross operating surplus, rose by 2½ per cent in the December quarter and by more than 13 per cent over 1998. This follows a period of weaker growth in 1996 and 1997. Corporate profits now stand at 15.4 per cent of GDP, a historical high, and well above the decade average of 14.2 per cent. In line with the strength in economic activity over the past year, profits growth has been concentrated in the services sector in 1998, with the construction and the transport and storage industries experiencing particular strength. Manufacturers' reported profits have rebounded from their lows in 1996. However, profits in the mining sector fell sharply in the December quarter, and in 1998 were at their lowest level in ten years as a share of GDP. There is some evidence that profitability has been relatively stronger for larger firms. Both the company profits survey, which excludes some smaller businesses, and the half-yearly reporting round for listed companies, suggest that profits growth in 1998 was stronger for these firms than indicated by aggregate data on gross operating surplus.
The overall strength in profitability means that businesses have been well placed either to fund investment, or build their financial assets, from retained earnings, their primary funding source. External funding has also continued to expand, although there has been some change in its composition. Business credit has picked up in the past two quarters to grow at an annual rate of 10.2 per cent in the three months to March. In contrast, there were net redemptions of securities issued by non-financial firms directly into capital markets in the December quarter, although indications are that funding from this source has subsequently resumed. Equity issued by non-financial firms has remained at a high level, increasing from $5.8 billion in the September quarter to $8.8 billion in the December quarter, with overseas investors taking much of the increase.
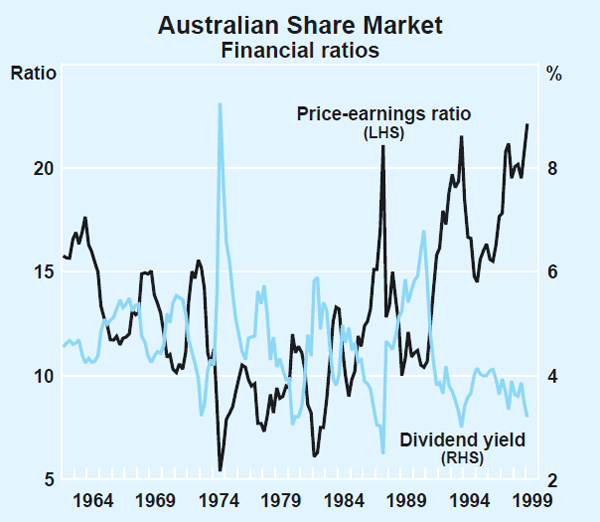
Sustained low inflation and heightened competition between financial intermediaries have brought about lower nominal interest rates on business loans. This has contained the servicing costs of corporate debt, despite steadily rising debt levels. Currently, net interest payments are absorbing around 20 per cent of operating profits; this ratio has shown little change over the past few years, but is well below the levels typical a decade ago. Equity raisings have also been relatively inexpensive: the price-earnings ratio is around its peak over the past 40 years (Graph 17).
The underlying strength in gross profitability and the low cost of finance implies that the business sector is not presently constrained by the availability of funds for investment. Nonetheless, and despite the recovery in business sentiment towards the end of 1998, recorded business investment declined sharply in the December quarter, to a level almost 3 per cent below that of a year earlier. The overall weakness in investment in the December quarter was concentrated in machinery and equipment spending, although buildings and structures investment also declined a little. Machinery and equipment investment has now fallen by more than 12 per cent over the past year.
There has also been a general downward revision to the investment outlook as recorded in recent surveys of business investment intentions. Private business surveys, although giving quite volatile results recently, have generally been pointing to a weaker investment outlook, despite showing a recovery in overall business sentiment. These results appear broadly consistent with the ABS Capital Expenditure Survey for the December quarter, conducted in the January/February period (Graph 18). Based on average realisation ratios, the survey implies that nominal investment spending in 1998–99 as a whole will be marginally lower than in the previous year. This expectation has been progressively revised down over the past three surveys. However, given the size of the actual decline in investment in the December quarter, this expectation would still imply a modest rebound in the short term. The Survey also contained the first estimate of investment in 1999/2000. It suggests a broadly stable level of investment for the year ahead, although it needs to be kept in mind that the first estimate of investment is not particularly reliable.
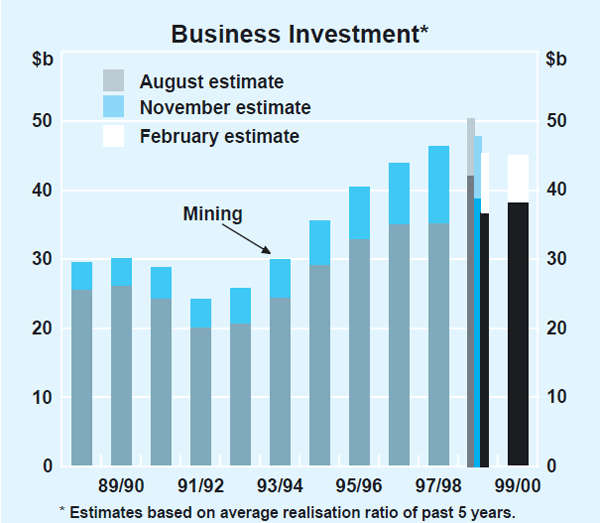
Most of the overall weakness in expected investment is accounted for by the mining industry, although intentions have been revised down, to a lesser extent, in most other industries, with the transport sector being the notable exception. The weaker outlook for mining investment follows a period of exceptionally rapid growth. Between 1995 and 1998, the level of mining investment increased over 50 per cent, with a number of large projects in base metals, coal and gas being undertaken. The sharp anticipated decline in mining investment over the next year reflects the completion of some of these large projects, which is occurring at a time of low commodity prices, weak export demand and declining profits in the industry. In addition, many Olympic-related projects (such as hotels), which have supported construction investment over the past few years, will be approaching completion over the coming year (see Box C). Non-residential building approvals weakened somewhat in the second half of 1998 and, although they have recovered in the first couple of months of 1999, the current level of approvals would not be sufficient to sustain activity at its current rate.
The overall softness of the forward indicators of investment contrasts, at present, with the sizeable quantities of funds apparently being raised by businesses. This could be partly related to takeover activity, but it may also be indicative of some pick-up in business investment plans that is not yet evident in the conventional surveys of investment intentions. While profits in most areas remain in good shape, funding costs low, and confidence in the economy's performance high, it seems unlikely that the flat spot in overall investment will prove other than short-lived.
The labour market
Reflecting the strength of output growth over the past year, employment has continued to increase at a pace sufficient to generate a steady reduction in unemployment. Total employment increased by 2.1 per cent over the year to March, although growth over the past few months was a little slower than that recorded in the second half of last year. There has been some easing in full-time employment growth since mid 1998, while the part-time component has continued to increase at a more rapid pace, continuing the longer-term trend towards a greater share of part-time employment in the economy. The unemployment rate averaged 7.4 per cent in the March quarter, over half a percentage point lower than it was six months earlier (Graph 19). Participation in the labour force by both males and females over the past year or so has been somewhat weaker than suggested by their typical cyclical behaviour. In previous economic cycles, strong growth in the economy tended to draw people into the labour force; in contrast, the participation rate has declined slightly over the past year.
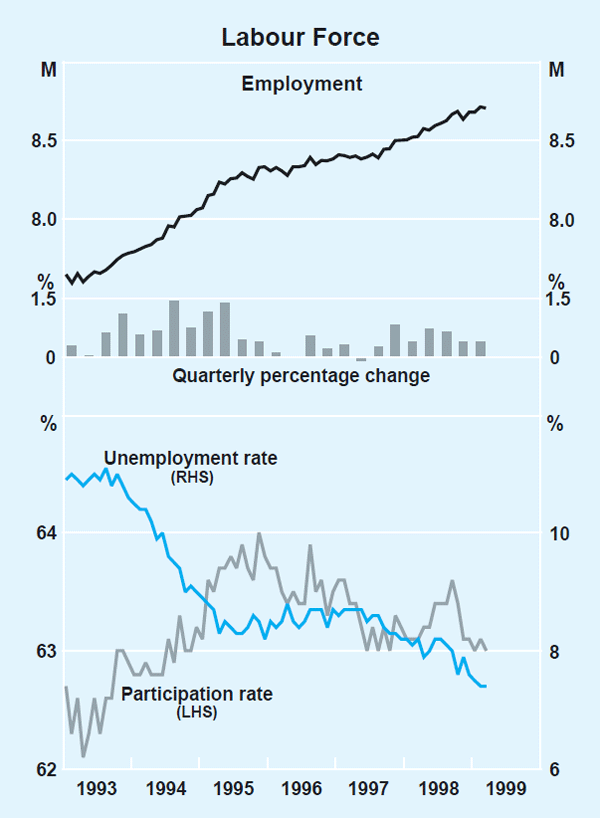
Employment growth over the past year has been strongest in the public sector and a range of private-sector service industries which, as discussed above, have generally been the industries showing the strongest performance in terms of output growth and reported business conditions; retail trade, property and business services, health and community services, and transport and storage accounted for most of the increase in total employment over the year. Employment in the construction sector was also significantly higher in the March quarter than a year earlier, but has fallen appreciably since the end of 1998, reflecting the completion of some Olympics-related projects and the temporary slowdown in housing construction in the second half of last year. Manufacturing employment continues to decline, despite the pick-up in manufacturing output over the second half of 1998; this continues the long-run trend in employment in that industry.
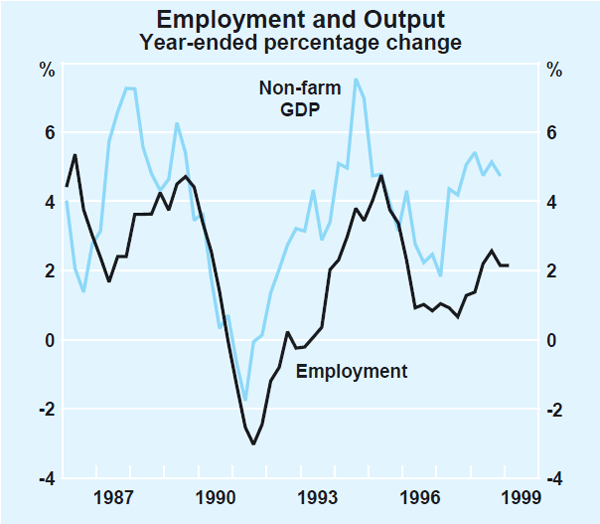
While the labour market has clearly benefited from the overall strength of the economy over the past two years, employment growth appears to have lagged the growth in output a little more than usual (Graph 20). This may be related to a degree of caution on the part of employers during 1998 in the face of uncertainties about the international outlook, as well as the possibility that the strength of the domestic economy was underestimated by many employers. With output growth running ahead of employment, the result has been a very rapid increase in labour productivity, which rose at a rate of 3¼ per cent during 1998. This could be indicative of a further step up from the already-high average rates of productivity growth which have been maintained through the 1990s economic expansion. More likely, it is indicative that further expansion in employment will follow the strong output growth of last year.
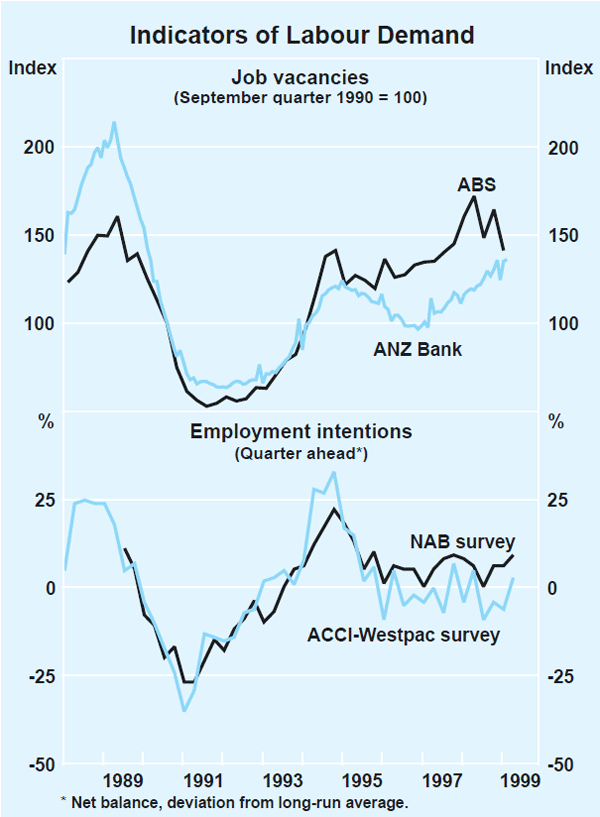
Most forward-looking labour-market indicators continue to point to firm labour demand in the near term. Vacancies data have been volatile in recent months; in March, the ANZ Bank and the Department of Employment, Workplace Relations and Small Business measures both reached their highest points in nine years, although the latter measure fell back in April. The ABS measure of vacancies declined in the three months to February and is 12 per cent lower than its level a year earlier. This series has, however, displayed considerable volatility in recent quarters and become more difficult to interpret; relative to previous cycles, the series remains at a level consistent with continued employment growth. Hiring intentions, as measured by the major business surveys, have been firmer recently. They were initially dampened by the effects of the Asian economic crisis, but have picked up in the past quarter in line with the overall improvement in business confidence (Graph 21).
The rural sector
Farm output rose by about 3¼ per cent in 1998. The winter grain crop, at about 32 million tonnes, was 9 per cent larger than in the previous year, but late frosts and persistent heavy rains adversely affected grain quality and yields. The summer crop is forecast by ABARE to yield a record 4.4 million tonnes, following a significant increase in the area sown and generally favourable seasonal conditions. This year's winter grain crop is forecast to be around 3 per cent larger than last year.
Wool production is forecast by ABARE to drop to 605,000 tonnes in 1999/2000, the smallest wool clip in more than 20 years, reflecting a switch by farmers into other activities; wool prices have recovered from their lows of October, but demand for wool has been weak, and is expected to remain so, reflecting both the weakness in Asia and the continued competitive pressures from synthetic fibres. The Federal Government has introduced legislation to create a new body, WoolStock Australia, which will take control of the official wool stockpile.
Good spring rainfall has contributed to excellent pastoral conditions in most of Australia's cattle-producing regions. However cattle slaughterings have increased, rising by 7½ per cent in the year to the second half of 1998. This has kept meat exports strong over that period. ABARE expects some herd re-building to occur over the next couple of years which could result in reduced slaughterings.
Box B: Developments in Household and National Saving
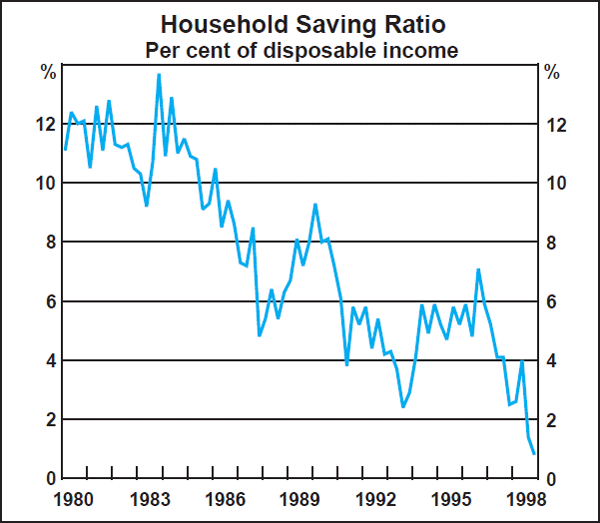
Australia's household saving ratio, as measured in the national accounts, has declined substantially over the past two decades. In the December quarter, it reached 0.8 per cent, its lowest recorded level and well below the average of around 12 per cent prevailing in the early 1980s (Graph B1). Despite the severity of this longer-term decline, movements in broader measures of saving have been much less pronounced. Much of the recorded drop in household saving in recent years has been offset by increased saving by enterprises and governments, with the result that total national saving has been relatively stable. This Box provides further details.
Household, enterprise and government saving
Saving can be defined either in gross or net terms (that is, before or after deduction of depreciation from the measure of income). Differences between the trends in saving derived from the two concepts arise because depreciation has generally accounted for an increasing proportion of gross saving over time; net saving measures have therefore declined by more than gross measures. The most commonly cited indicator of saving in Australia, the household saving ratio shown in Graph B1, is a net measure. However, the difficulties of accurately estimating depreciation are such that gross measures are often used when making broader sectoral comparisons, as below.
Trends in the gross saving rates of the household, enterprise and general government sectors are summarised in Graph B2. Over the past two decades, gross household saving has approximately halved, from around 14 to around 7 per cent of GDP. After a period of relative stability during 1995 and 1996, the downward trend appears to have resumed in recent quarters. One of the contributing factors to the recent decline has probably been the impact of rising asset prices on household wealth. Since capital gains tend to stimulate consumption growth, but are not counted as income in the national accounts, a period of relatively strong growth in asset prices can contribute to a decline in recorded saving.
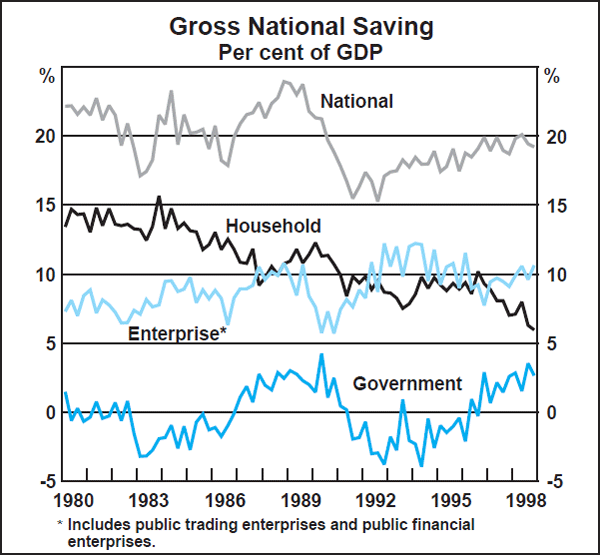
Enterprise saving (which represents the retained profits of businesses), has increased over the medium term, and has tended to move in a fashion that has partly offset movements in household saving. To some extent, this is likely to reflect the ownership link between the two sectors: households are the ultimate owners of much of the enterprise sector, and increases in retained earnings of businesses may act as a stimulus to household spending. For many purposes, therefore, it makes sense to think of household and enterprise saving as an aggregate. The total of household and enterprise saving has declined gradually in recent years, with the recent pick-up in enterprise saving insufficient to offset declining saving in the household sector.
The third component of aggregate saving, that of the general government sector, has increased strongly in recent years, reflecting a combination of cyclical and structural improvements in government fiscal positions. This has more than offset the recent net decline in the overall saving of households and enterprises, so that total national saving has increased steadily since the trough reached in the early 1990s recession. National saving as a proportion of GDP nonetheless remains about 2 percentage points lower than the average of the 1980s.
Saving, investment and the current account
Movements in the current account deficit can in principle be attributed to movements in the national saving-investment balance: a larger current account deficit results from a decline in aggregate saving relative to aggregate investment. The existence of statistical discrepancies in the accounts, however, means that an exact reconciliation of these concepts is not possible; in the recent period, this measurement problem has been quite severe. Australia's current account deficit as a proportion of GDP was about 1½ percentage points higher in the December quarter 1998 than its average in 1996 (Table B1), yet national saving is estimated to have shown little change over that period, while aggregate investment increased only modestly. The increase in the current account deficit is mainly accounted for, in these estimates, by the movement in the statistical discrepancy.
| 1996 average | December qtr 1998 | Change | |
|---|---|---|---|
| Investment | 22.6 | 23.3 | 0.7 |
| Saving | 19.1 | 19.2 | 0.1 |
| Statistical discrepancy | 0.4 | 1.4 | 1.0 |
| Current account deficit | 3.9 | 5.4 | 1.5 |
| Note: The change and statistical discrepancy are subject to rounding errors. | |||
This result suggests an important point of caution in interpreting the recent trends in estimated national saving. Assuming the current account balance to be the most reliable component of these calculations, eventual reconciliation of the accounts would imply a larger net widening of the saving-investment gap over the recent period. This may mean that the underlying trend in national saving has been less favourable, or that investment has been higher, than is implied by current estimates.
Box C: The Economic Effects of Staging the Olympic Games
Investment
Investment expenditure associated with the Olympics includes that on venues (such as Stadium Australia) and related facilities (such as the Olympics Village) and that on projects indirectly linked to the Olympics, such as hotels. The total construction cost of Olympic venues and related facilities is expected to be around $3½ billion, two-thirds being funded by the public sector (Table C1). This amount, equivalent to a little over half of one per cent of annual Australian GDP, is spread mainly over a period of five years beginning in 1995/96, with privately funded construction mainly concentrated in the current financial year. The greatest stimulus to growth probably occurred in 1996/97.
| Estimated total expenditure |
Expenditure to 1995/96 |
1996/97 | 1997/98 | 1998/99 | 1999/00 | Later | |
|---|---|---|---|---|---|---|---|
| Public funding(a) | 2,185 | 154 | 637 | 586 | 491 | 317 | – |
| (% of public investment) | (12.6) | (0.7) | (2.9) | (2.8) | (2.3) | (1.5) | – |
| Private funding(b) | 1,209 | – | 132 | 254 | 541 | 197 | 85 |
| (% of private investment) | (1.5) | – | (0.1) | (0.2) | (0.5) | (0.2) | – |
| Total | 3,394 | 154 | 769 | 840 | 1,032 | 514 | 85 |
| (% of Olympic spending) | (4.5) | (22.7) | (24.8) | (30.4) | (15.1) | (2.5) | |
| (% of GDP) | (0.61) | (0.03) | (0.14) | (0.15) | (0.18) | (0.09) | |
| (a) 1996/97, 1997/98, 1998/99 NSW Budget Papers. (b) Estimates from the Olympic Co-ordination Authority |
|||||||
The prospect of increased tourist numbers, including in the period after the Olympics, has also boosted private investment in other infrastructure. For example, work done on hotels in NSW has increased strongly since 1995, albeit from a very low level, whereas such activity has shown no net increase in the rest of the country. Upgrading of facilities at Sydney Airport is also proceeding. The anticipated boost to tourist arrivals has also been one motivating factor behind some public infrastructure spending, such as the rail link to Sydney Airport and some upgrading of Sydney's roads. The NSW government expects the rail link – a joint public/private venture over four or so years – to cost a total of $730 million. Other infrastructure spending is estimated to be around $400 million.
Quantifying the effects of the Olympics itself is difficult, however, since some other activities which might have occurred (including elsewhere in Australia) could have been displaced by Olympics-related work, and some Sydney-based infrastructure investment might have occurred in the absence of the Olympics anyway.
Balance of payments
While many tourists will come to Australia specifically to view Olympic events, tourism is thought likely to benefit more generally from the publicity Australia receives from hosting the Olympic Games. The Tourism Forecasting Council (TFC) expects that the staging of the Olympics will boost the number of overseas arrivals by around 340,000 over each of the next few years, about 110,000 of which will come solely for the Olympics, and by 1.6 million in total.[1] The average foreign tourist in 1998 spent about $2,100 in Australia, suggesting the boost to tourism from the Olympics would add around $700 million a year to tourism revenue over the next three years if the TFC projections were met.
The Olympics will also boost other types of service exports. Sponsorship fees received from overseas will be strong in the period leading up to the games, while revenue from broadcast rights (which are worth almost $1 billion) will likely be recorded as exports in the September quarter of 2000. Tickets sold to overseas visitors will also be recorded in September 2000 and, the TFC estimates, will provide an additional boost to service exports of up to $100 million. The overall boost to export receipts in the September quarter will be equivalent to around 1 per cent of GDP and will be associated with a near-commensurate temporary reduction in the current account deficit.
Consumption
Ticket sales to Australians for Olympic events will also be recorded in the September quarter 2000 and are expected by SOCOG to total around $500 million, an amount equivalent to about ½ a per cent of quarterly consumption expenditure. However, the net increase in consumption is likely to be less than this amount as households may curtail expenditure on other forms of entertainment.
It is also possible that the staging of the Olympics will boost consumption indirectly by improving consumer sentiment. It is, however, difficult to find much evidence that this has been particularly important at an aggregate level in other countries that have hosted the Olympic Games. In the US, for example, there was no pronounced improvement in consumer sentiment leading up to, or during the Olympic Games held in Los Angeles and Atlanta.
Employment
The additional investment activity has contributed to expanded employment in recent years, mainly in the construction industry in NSW. The Olympic Co-ordination Authority (OCA) estimates that approximately 24,000 construction jobs are associated with Olympics-related activities over the four years to 1999/00.[2] This is equivalent to about 10 per cent of total employment in the NSW building industry, although the net addition to employment over the duration of the construction period may be considerably less than this. Most employment created during the period of the Games itself is likely to be voluntary or temporary in nature, as has been the case in previous Olympic Games. Furthermore, given that the Games only lasts two weeks, paid employment is likely to rely heavily on overtime hours, and rather less on the creation of new positions.
Some other business activities could conceivably be reduced or possibly even shut down for the Olympics period, so that the impact on recorded employment and output is difficult to predict with any accuracy.
Balance of Payments
The economic problems in the Asian region, and the slowdown in global growth, have had a marked impact on Australia's external accounts (Graph 22). Although export earnings initially continued to grow in the face of the weakening external environment, they have turned down quite sharply since around the middle of 1998. In the March quarter, export earnings declined by 2½ per cent, following a decline of just under 4 per cent in the previous quarter. These declines mainly reflected falling export prices, although there was probably some decline in volume terms in the March quarter. The weak performance of exports in the recent period contrasts with average annual growth (in both volume and value terms) of 8–9 per cent over the 1990–97 period.
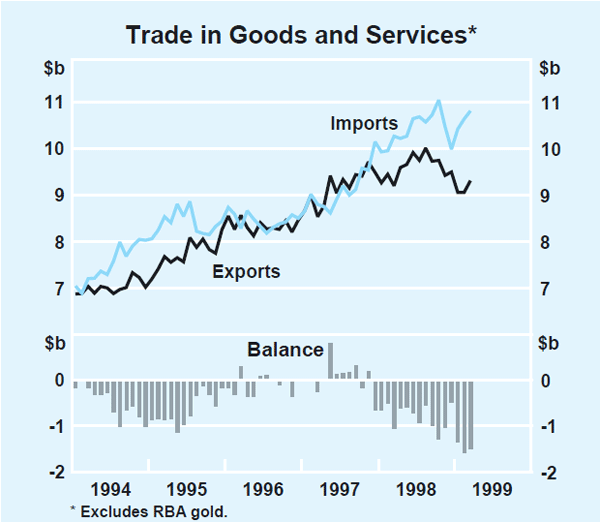
Much of the recent decline in export earnings has been concentrated in the resources sector, which accounts for around 40 per cent of total exports. After growing strongly until mid 1998, resource exports have since fallen by a total of 14 per cent (Graph 23), reflecting a combination of weaker commodity prices and reductions in volumes. Demand for resources from Japan has weakened considerably, and price declines may have encouraged some cutbacks in Australia's minerals production. In contrast, rural export earnings have picked up over the past year from the trough reached in early 1998. The increase reflects substantial increases in volumes as a result of favourable domestic production conditions, and some recovery in demand from east Asian markets, although declining rural commodity prices have limited the overall rise in earnings. Of the other components of exports, manufactured exports – previously the fastest growing component – have remained weak for much of the past year. Service exports picked up in the March quarter, reflecting some recovery in tourism.
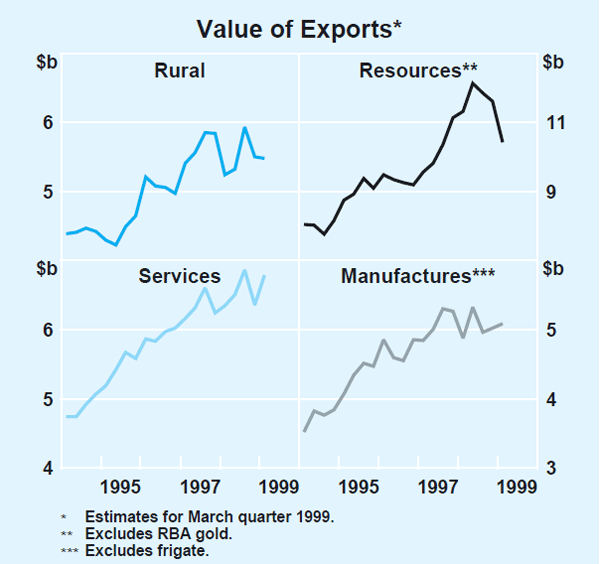
The weakening in Australia's export performance in the recent period suggests that the scope for further rapid diversion of exports to the faster-growing regions of the world may be limited. In the early period following the onset of the Asian crisis in mid 1997, the loss of exports to the crisis-affected economies had, to a significant degree, been offset by stronger growth in sales to the US, Europe, and other markets (Table 4). This trade diversion was particularly evident for resource exports, where commodities are relatively homogeneous and can in many cases be sold in alternative markets at prevailing world prices. The recent indications, however, suggest that this has not continued. After growing strongly up until around the middle of 1998, aggregate exports to the US and Europe levelled out in the second half of the year and appear to have declined in the March quarter 1999, with much of the fall accounted for by resource exports. There are now some signs that demand for Australia's exports from the initial crisis-affected countries, particularly Korea, is beginning to recover. At the same time, however, a significant further deterioration of conditions in Japan has seen the value of Australian exports to that destination fall by around 8 per cent over the past year. Reductions in contract prices of bulk commodities, which are taking effect from April, will exert a further dampening influence on export revenues in the current quarter.
| Jun qtr 1997 | Jun qtr 1998 | Mar qtr 1999 | |
|---|---|---|---|
| US and EU | 14.8 | 39.1 | −0.3 |
| Japan | −1.0 | 9.3 | −7.6 |
| Initial crisis Asia | 3.4 | −33.0 | 17.1 |
| Other east Asia | 9.8 | 2.9 | −0.1 |
| Rest of world | 17.4 | 4.0 | 4.9 |
| Total | 8.8 | 3.9 | 1.6 |
| (a) Excludes RBA gold transactions, and re-exported gold. | |||
Import values have shown considerable volatility in recent months but increased by around 5½ per cent over the year to the March quarter. Preliminary indications are that growth in volume terms was a bit higher: the import deflator fell slightly over the year, declining significantly in the two latest quarters after substantial increases in the wake of Australia's currency depreciation. In the March quarter itself, import values were little changed, with increases in consumption and capital goods imports being offset by weaker imports of intermediate goods.
The overall pace of growth in imports during the past year has been slower than has been typical in recent years, and slower than might have been expected given the strong growth in domestic expenditure. The impact of the currency depreciation may be part of the reason for this. Despite the recent unwinding of part of the import price increases flowing from the depreciation, import prices are still around 10 per cent higher than they were in mid 1997, which may have helped to restrain import demand in some areas. In the case of consumption imports, however, this explanation is at odds with the fact that import prices to the consumer have continued to decline (see the chapter on ‘Inflation Trends and Prospects’).
Continued growth in import values coupled with falling exports has seen a widening of Australia's current account deficit. In the December quarter, the deficit reached a level of 5.4 per cent of GDP. Monthly trade data suggest that the trade component of the deficit widened further in the March quarter, by perhaps around ½ per cent of GDP. Assuming the net income deficit remains roughly unchanged as a proportion of GDP (as it has done over the past year), this would imply a current account deficit of around 6 per cent of GDP in the quarter.
Australia's net foreign liabilities increased by $8.6 billion in the December quarter, raising the stock of net foreign liabilities to nearly 60 per cent of GDP. This increase was accounted for by rising net foreign equity liabilities; net foreign debt fell a little in the quarter. Australia's ability to service its net foreign liabilities is little changed from recent levels. The ratio of Australia's net income payments to exports, at 17.3 per cent, remains near its historical average, and well below the 1980s peak. Both net interest payments and net equity income payments have been declining relative to exports in recent years. The net income deficit rose by just over 2 per cent in the December quarter to $4.8 billion, 3.2 per cent of GDP, mainly reflected rising dividend payments to foreign holders of Australian shares.
Commodity prices
In aggregate, commodity prices in SDR terms appear to have stabilised since the beginning of the year but remain more than 13 per cent lower than their levels of a year ago (Graph 24). The recent stabilisation reflects, in part, some improvement in market sentiment about the outlook for the world economy, but also reflects cuts in the production of a number of resource commodities. For Australian exporters, recently negotiated cuts to bulk commodity prices (iron ore and coal) of between 10 and 20 per cent (in US dollar terms) are taking effect from April. These price reductions will be reflected in measures of Australia's terms of trade from the June quarter.
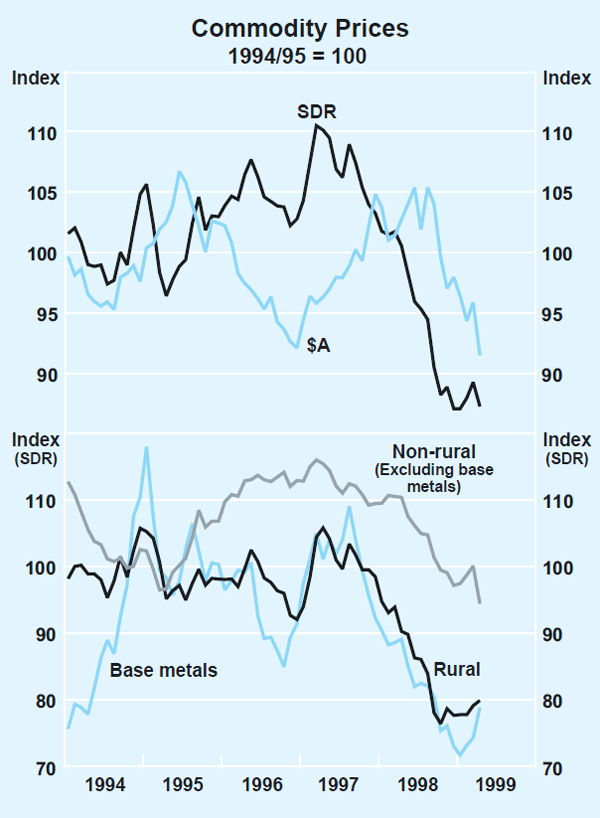
Base metal prices have risen somewhat from their trough at the beginning of the year. There have been substantial improvements in zinc and nickel prices largely as a result of announced mine closures, both domestically and overseas. Following weakness over the first few months of 1999, aluminium and copper prices have also increased strongly in April in anticipation of cutbacks in production. Gold prices have softened, however, following a decision to end the legal backing of the Swiss franc by gold, and with an increase in the likelihood of gold sales by the IMF to finance debt relief for poor nations. The recent announcement from OPEC countries that oil production will be cut by some 7 per cent has seen the price of oil rise sharply, from just under US$11 a barrel, to over US$18 a barrel. While this has reversed all of the decline in oil prices since the beginning of 1998, the real price of oil remains very low by historical standards (Graph 25).
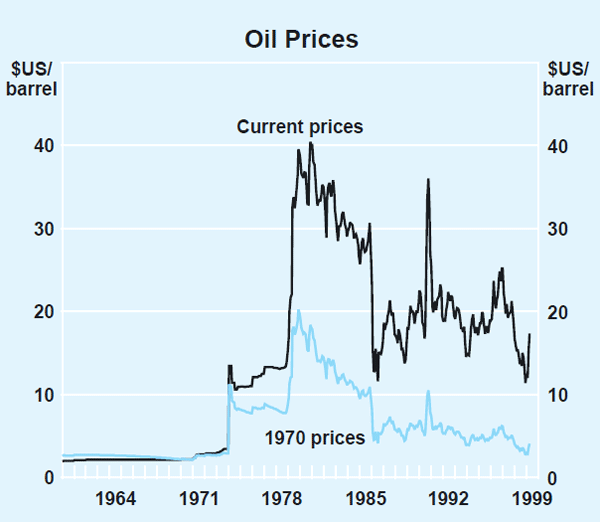
The prices of some rural products have shown tentative signs of recovery, with solid increases (3–6 per cent) in the prices of wool, beef, rice and barley; sugar prices, however, fell by a further 14 per cent in the March quarter, and are now some 37 per cent lower than the March quarter of last year. The recent fall in sugar prices reflects expectations of lower US dollar prices from Brazilian producers following the depreciation of the real since January, as well as strong prospects for sugar crops elsewhere and weak demand from non-Asian importers.
Financial Intermediation
Intermediaries' interest rates
Financial intermediaries' variable-rate lending rates were reduced after the 2 December monetary policy easing. As discussed in ‘The Economy and Financial Markets’, published in February, the extent of the cuts to intermediaries' lending rates varied among intermediaries and from product to product, but were broadly in line with the reduction in the cash rate. They were also passed on to borrowers more quickly than in the five easings of 1996–97. Since the reductions associated with the easing, intermediaries' variable lending rates have been largely unchanged (Graph 26). The movements in intermediaries' rates, and their current level are summarised in Table 5. A longer-term perspective is contained in ‘Recent Developments in Interest Rates on Bank Lending’ in the Reserve Bank's Bulletin of April 1999.
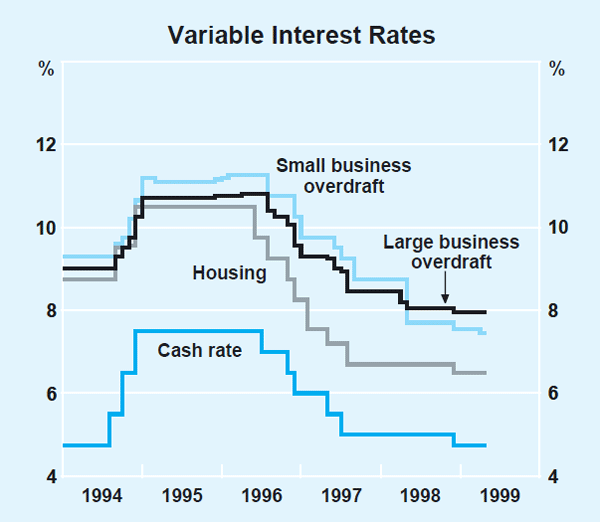
| Product |
Movement since December easing |
April 1999 |
|---|---|---|
| Household | ||
| Housing | ||
| Standard variable | −0.20 | 6.50 |
| Basic | −0.20 | 5.90 |
| Personal | ||
|
Residential-secured overdraft |
−0.30 | 6.60 |
|
Credit card (with interest-free period) |
0.00 | 15.30 |
| Business | ||
| Small business | ||
| Residential-secured | ||
| – Overdraft | −0.25 | 6.95 |
| – Term | −0.25 | 6.65 |
| Other(a) | ||
| – Overdraft | −0.25 | 7.45 |
| – Term | −0.40 | 7.05 |
| Large business | ||
| – Overdraft | −0.10 | 7.95 |
| – Term | −0.15 | 7.90 |
| (a) Both secured by other assets and unsecured. | ||
Interest rates on fixed-rate loans have declined in recent years, as rates in capital markets – where banks fund such loans – have fallen (Graph 27). The average rate on new housing loans for terms fixed for three years is currently about 6.6 per cent, up slightly from the trough of 6.4 per cent reached in early 1999, but considerably lower than in earlier years. Similarly, indicator rates on three-year fixed small business loans are currently around 6.7 per cent. As Graph 27 shows, these interest rates move in parallel with interest rates in swap markets.
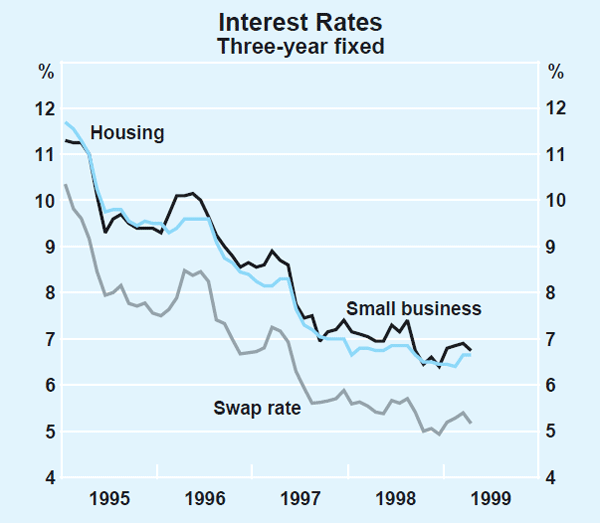
Real interest rates
Measures of real interest rates (defined using a range of indicator rates and alternative measures of inflation expectations) have declined slightly over the past six months, from levels that were already below historical averages. As discussed above, cash rates declined by 25 basis points following the December easing in monetary policy, leading to similar cuts in intermediaries' lending rates. There has also been a small increase in the Melbourne Institute measure of inflation expectations recently (discussed in more detail in the chapter on ‘Inflation Trends and Prospects’), which reduces the measures of real interest rates calculated using that series. The measures shown in Table 6 suggest that real interest rates on standard variable-rate loans for both small business and housing are now well below the levels reached in the early 1990s. The real cash rate is currently close to its trough in the early 1990s. Real interest rates as measured by yields on indexed (inflation-adjusted) bonds are also close to historical lows, although they have increased slightly in the past couple of months.
| April 1999 | Early 1990s trough |
5-year average |
|
|---|---|---|---|
| Calculated using underlying inflation(a) | |||
| Cash rate | 3.0 | 2.5 | 3.9 |
| Housing loan rate | 4.7 | 6.4 | 6.2 |
| Small business variable rate(b) | 5.7 | 7.0 | 7.4 |
| Large business variable rate(c) | 6.1 | 6.7 | 7.2 |
| Calculated using Melbourne Institute survey(d) | |||
| Cash rate | 0.2 | 0.2 | 2.0 |
| Housing loan rate | 1.9 | 4.1 | 4.3 |
| Small business variable rate(b) | 2.8 | 4.6 | 5.5 |
| Large business variable rate(c) | 3.3 | 4.3 | 5.2 |
| Indexed bond yield | |||
| 6-year | 3.6 | 3.2 | 4.6 |
| 11-year | 3.6 | 3.1 | 4.5 |
| (a) Underlying inflation over the year to March quarter. (b) Overdraft, not residentially secured. (c) Overdraft. (d) Median measure of inflation expectations. |
|||
Financial aggregates
Credit growth has picked up in the past six months to an annual rate of around 12 per cent, more than reversing the brief slowdown in growth seen in mid 1998. Underpinned by stronger business confidence, business credit growth has increased from an annual rate of around 7 per cent in the three months to October, to grow by an annual rate of just over 10 per cent in the three months to March (Table 7). The acceleration in personal credit has been even more marked. The strength in December and January has boosted the annualised growth rate of personal credit to 19 per cent in the six months to March. While increased usage of credit cards for transaction purposes has contributed to this growth, much of the growth is accounted for by residentially secured lines of credit to households. As discussed in the chapter on ‘Domestic Economic Activity’ above, the increasing affordability and access to this form of credit appears to have been a factor supporting the growth in consumer spending in the recent period. Housing credit growth has remained strong in recent months, although growth in lending for investment purposes has eased a little since mid 1998.
| Year to March 1999 |
Three months to: | ||
|---|---|---|---|
| December 1998 | March 1999 | ||
| Total credit | 11.5 | 12.7 | 12.7 |
| – Personal | 15.3 | 18.5 | 19.6 |
| – Housing | 12.9 | 11.2 | 14.1 |
| – Business | 9.7 | 12.7 | 10.2 |
| Currency | 8.2 | 5.5 | 8.4 |
| M1 | 8.1 | −3.0 | 14.0 |
| M3 | 8.3 | −0.4 | 11.0 |
| Broad money | 7.8 | 3.0 | 8.0 |
The strong rate of credit growth since the middle of 1998 has been funded, in part, by increases in deposits, and also offshore borrowing. Rapid growth in credit to the private sector has also been offset to some extent by relatively weak lending to the public sector over recent months. Growth in the monetary aggregates slowed in the second half of 1998, but in the first few months of 1999 this appears to have reversed, with faster growth in fixed deposits. Currency growth has declined in recent months, but still is faster than growth in nominal income.
Strong growth in the community's holdings of other types of financial assets has continued. Funds under management rose by 3 per cent in the December quarter, in line with the rebound in domestic and overseas share markets. Over the year to the December quarter the value of managed funds rose by over 12 per cent, well in excess of growth in alternative savings vehicles such as deposits. Cash management trusts continued to record the fastest growth, but they remain a small share of total funds under management (Table 8). Of the assets held by fund managers, overseas assets increased strongly during the December quarter, rising by 7½ per cent despite the negative valuation impact of the appreciation of the $A against the US dollar in the quarter. Holdings of domestic equities rose by 5 per cent in the quarter. Funds' holdings of cash and bank deposits declined by 3¾ per cent from the high levels of the September quarter.
|
Percentage change; year to December |
Share of total at December 1998 |
|||
|---|---|---|---|---|
| 1996 | 1997 | 1998 | ||
| Cash management trusts | 34.7 | 42.8 | 44.5 | 4.4 |
| Unit trusts | 23.9 | 35.3 | 17.0 | 16.7 |
| of which: – Property trusts |
13.8 | 26.5 | 21.0 | 6.9 |
| – Equity trusts | 29.3 | 36.7 | 14.5 | 7.5 |
| – Mortgage Trusts | 35.9 | 40.6 | 16.7 | 1.1 |
| Life insurance offices | 7.1 | 11.8 | 8.9 | 32.5 |
| Superannuation funds | 15.5 | 19.7 | 11.0 | 43.4 |
| Total | 13.1 | 19.3 | 12.2 | 100.0 |
|
Sources: ABS Cat. Nos 5655.0 and 5645.0. |
||||
Inflation Trends and Prospects
Recent developments in inflation
Consumer prices
The Consumer Price Index (CPI) fell by 0.1 per cent in the March quarter, but rose by 1.2 per cent over the year to the March quarter (Graph 28). The March quarter outcome reflects, in part, the introduction of the Government's 30 per cent private health insurance rebate, which led to a sharp reduction in the price of hospital and medical services in the quarter and contributed 0.7 percentage points to the fall in the CPI. Further falls in automotive fuel, clothing and communication services were also recorded. These movements were only partially offset by seasonal price increases for Pharmaceuticals, domestic holiday travel and education.
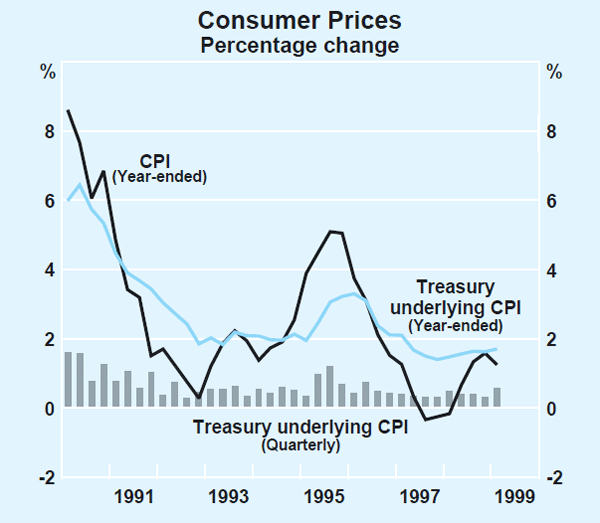
Abstracting from these transitory influences, measures of underlying inflation suggest prices increased by around ½ to ¾ per cent in the March quarter and by 1½ to 2 per cent over the year (Table 9).Within the underlying CPI basket, motor vehicle prices continued to decline, falling by 0.5 per cent in the March quarter and by 5.3 per cent over the past year. Motor vehicle prices have subtracted an average of 0.5 percentage points from the underlying inflation rate in each of the past three years. The price of household equipment also fell in the March quarter. Offsetting these falls were higher-than-average increases in the prices of many food items and a 1.5 per cent rise in ‘house purchase’ costs; the latter contributed 0.2 percentage points to the increase in the underlying CPI in the March quarter. The rise in the house-price component occurred despite lower building-materials prices, and may reflect higher growth in construction labour costs than in other sectors.
| Quarterly | Year-ended | ||||
|---|---|---|---|---|---|
| December 1998 |
March 1999 |
December 1998 |
March 1999 |
||
| CPI inflation | 0.5 | −0.1 | 1.6 | 1.2 | |
| Treasury underlying inflation | 0.3 | 0.6 | 1.6 | 1.7 | |
| Private-sector goods and services inflation | 0.4 | 0.6 | 1.5 | 1.5 | |
| Median price change | 0.3 | 0.7 | 1.5 | 1.9 | |
| Trimmed mean price change | 0.2 | 0.5 | 1.3 | 1.4 | |
Private-sector goods prices have continued to increase at a noticeably slower pace than the price of private-sector services (Graph 29). The difference is mainly accounted for by the prices of imported goods in the CPI which, contrary to most expectations, have continued to decline (see below). In the March quarter the price of imported goods fell by 0.4 per cent, to show a decline of more than 2 per cent over the past year. Within that category, prices of imported motor vehicles fell only slightly in the quarter but, after earlier rapid declines, are now 8.8 per cent lower than a year earlier; the price of other imported goods fell by a greater extent in the latest quarter. In contrast, the rate of increase in prices of domestically produced goods has picked up over the past year, to a rate of 1.9 per cent. With service prices rising somewhat more quickly than that, overall domestically sourced inflation in goods and services prices is running at a little over 2 per cent.
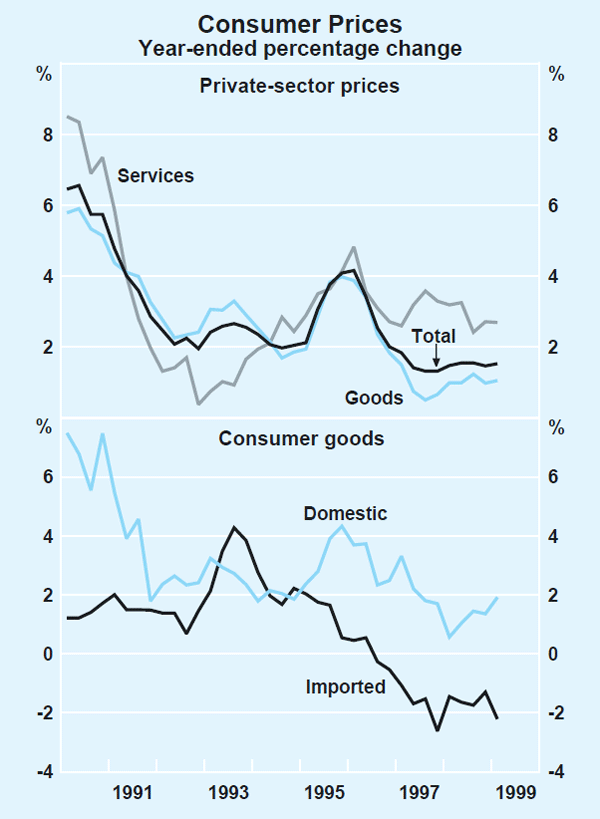
The exchange rate and import prices
In contrast to the continued decline in import prices at the consumer level, noted above, import prices as recorded at the docks are substantially higher than they were two years ago. In broad terms, the movement in dock prices of imports has reflected developments in Australia's exchange rate. The Australian dollar depreciated by about 12 per cent in import-weighted terms between the first half of 1997 and the December quarter 1998, and by almost 20 per cent against the currencies of the major industrial countries. The difference between these two summary measures reflects the disparities between Australia's exchange rate movements against the currencies of the major countries and those of crisis-affected Asia in particular. Given these disparities, there was always some uncertainty about the size of the total impact of Australia's currency depreciation on import prices at the docks. It now appears that this impact reached its peak in the September quarter 1998, when dock prices were 13 per cent higher than their level in mid 1997. Declines in these prices in the December and March quarters have subsequently unwound about 3 percentage points of that increase.
The overall increase in import prices at the docks over the recent period appears to have been limited by the extremely competitive conditions prevailing in world product markets. As discussed in detail in the chapter on ‘International Economic Developments’, prices of exports of the major industrial countries (which are the main sources of Australia's imports) declined by around 2½ per cent in original currency terms during 1998. An additional factor in the December quarter may have been the strengthening of the $A against the US dollar in the quarter, which may have had a temporary downward impact on prices to the extent that imports were invoiced in US dollars. More recently, there has been a more broadly based strengthening of the Australian dollar, in terms of both the import-weighted index and the major industrial countries' currencies. This has yet to have its full effect on import prices at the docks, but may have contributed to the decline in dock prices recorded in the March quarter.
Notwithstanding the most recent declines in dock prices of imports, they remain around 10 per cent higher than their level of mid 1997. The continued decline in import prices at the consumer level is therefore quite unusual in light of previous experience (Graph 30). On the face of it, this lack of pass-through of price rises from the docks to consumers would suggest that importers' or retailers' margins are being heavily squeezed, with price rises at the docks being absorbed over a much longer period than usual. Another part of the explanation, with somewhat different implications, may be that effective prices offered by foreign suppliers have not risen by as much as official data suggest, as a result of rebates or incentives offered direct to the final purchaser.
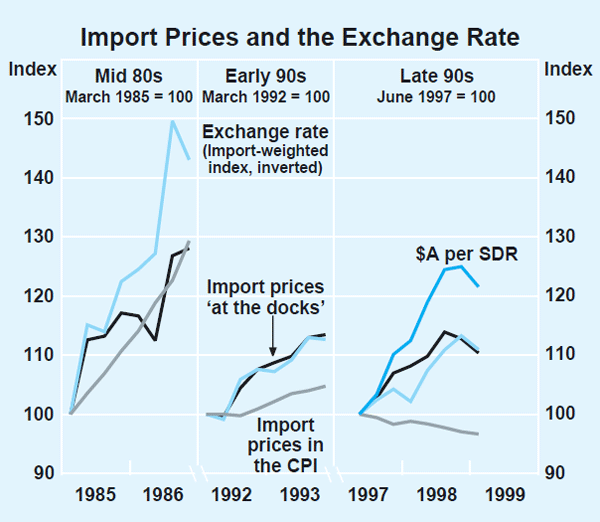
Motor vehicles, which have accounted for more than half of the overall decline in import prices at the consumer level over the past two years, provide an interesting case study of these issues (Box D). There the evidence suggests that both of the factors discussed above have been at work in the recent period. There appears to have been some reductions in wholesalers' margins in the car industry, while rebates initiated by foreign suppliers also appear to have contributed to price reductions at the retail level. The process appears to have been stimulated by lower prices on Korean cars stemming from the Korean currency depreciation. To the extent that importers' margins have been significantly reduced over the recent period, it may suggest some pressure for margins to be rebuilt at a later date.
Producer prices
Producer price indicators for the manufacturing and construction industries suggest that price pressures have continued to ease over the recent period (Table 10). Final prices of manufactured goods (excluding petroleum) declined by 0.4 per cent in the March quarter and were unchanged over the latest year, having risen at an annual rate of just under 2 per cent a year earlier. The weaker trend in manufacturers' output prices mainly reflects some significant falls in their input costs that have resulted from declining commodity prices over the past year. Prices of domestically sourced inputs fell by 2.6 per cent over the latest year, and imported input prices also declined, after some earlier sharp increases flowing from the currency depreciation. The largest falls in manufacturers' output prices in the March quarter were for petroleum and basic metal products (particularly aluminium), in line with declining prices in world markets. However, the recent rebound in oil prices, and the firmer tone in a number of other commodity markets, points to some pick-up in manufacturers' input costs in the period ahead. Prices of building materials showed little movement in the March quarter and have increased by ¾ to 1 per cent over the past year.
| March quarter 1999 |
Year to March 1999 |
||
|---|---|---|---|
| Manufacturing | |||
| Input prices | −1.5 | −1.9 | |
| – Domestic | −1.4 | −2.6 | |
| – Imported | −1.8 | −0.8 | |
| Final prices(a) | −0.4 | 0.0 | |
| Construction | |||
| Input prices | |||
| – Materials used in house buildings |
−0.2 | 0.7 | |
| – Materials used in other buildings |
0.0 | 1.0 | |
| Merchandise trade | |||
| Export prices | −3.9 | −6.3 | |
| Import prices | −2.1 | 2.1 | |
| (a) Excludes petroleum. | |||
Labour costs
The Wage Cost Index (WCI) for total pay, excluding bonuses, rose by 3.1 per cent over the year to the December quarter 1998, down slightly from the previous reading of 3.3 per cent (Table 11). While this index has only a short history, it is conceptually the best indicator of wage rates for a basket of constant-quality jobs, and suggests that the underlying growth in wages remains subdued. Average weekly ordinary-time earnings (AWOTE), which is a ‘wages bill’ rather than a ‘wage rate’ concept, was for some time growing at annual rates of just over 4 per cent. However, preliminary data indicate that AWOTE increased by only 0.1 per cent in the three months to February, and by 3 per cent over the latest year, bringing the annual rate into line with the latest annual increase in the WCI.
| Sep 1998 | Dec 1998 | Mar 1999 |
Year to latest |
|
|---|---|---|---|---|
| Quarterly | ||||
| Wage cost index (total pay, excluding bonuses) | ||||
| Private | 1.1 | 0.6 | .. | 3.0 |
| Public | 1.5 | 0.6 | .. | 3.6 |
| Total | 1.2 | 0.6 | .. | 3.1 |
| AWE survey | ||||
| AWOTE | ||||
| – Private | 1.5 | 0.0 | .. | 3.6 |
| – Public | 2.1 | 1.5 | .. | 6.0 |
| – Total | 1.5 | 0.5 | 0.1 | 3.0 |
| AWE | 1.2 | 0.0 | −0.1 | 1.8 |
| Annualised | ||||
| New enterprise agreements | ||||
| Private | 4.3 | 3.9 | .. | |
| Public | 3.4 | 3.8(a) | .. | |
| Total | 3.9 | 3.8(a) | .. | |
| Year-ended | ||||
| Executive remuneration(b) | ||||
| Executive base salaries | 5.0 | 4.8 | 4.7 | |
|
(a) Excludes the South Australian Department of Education agreement, which was certified
in the December quarter 1998 but negotiated two years earlier. (b) Mercer Cullen Egan Dell Quarterly Salary Review. |
||||
Both measures of wages growth suggest that wages have been increasing more quickly in the public sector than in the private sector. Private-sector AWOTE increased by 3.6 per cent over the year to November 1998, compared with an increase of 6 per cent recorded for the public sector. The latter figure appears unrealistically high, given the size of the increases being yielded by public-sector enterprise agreements, and may be affected by compositional changes in public-sector employment. The WCI suggests a smaller gap of around half a percentage point between public- and private-sector wages growth over 1998.
The expansion in the demand for labour over the past year does not seem to have put any general upward pressure on wages growth in the enterprise-bargaining stream. New enterprise agreements in the December quarter yielded average annualised wage increases of 3.8 per cent, much the same as have been recorded throughout the past year, although down from the levels that were typical 18 months ago (Graph 31). The construction industry remains the main area where stronger wage pressures are evident, with recent agreements yielding increases of the order of 7 per cent. In contrast, increases negotiated in the manufacturing industry have generally eased over the past year, to rates that are now around the economy-wide average.
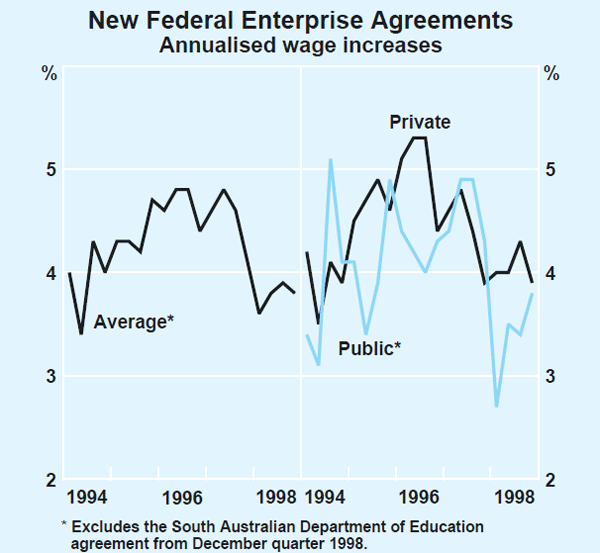
Recent business surveys confirm the absence of any general upward pressure on wages growth. The March quarter NAB survey indicated that for the third consecutive quarter, expectations of increases in labour costs were around 0.5 per cent for the quarter ahead. The ABS survey of business expectations, also taken in the March quarter, suggests some downward revision to expected wages growth.
There are signs that the pace of growth of executive remuneration is now easing. According to the Mercer Cullen Egan Dell survey, the rate of increase over the year to the March quarter was 4.7 per cent, the lowest reading in over 4½ years, although still well above the growth of average wages.
The Australian Industrial Relations Commission announced its decision on the Safety Net Review on 29 April, which will determine increases in award wages over the next year. The Commission granted an increase of $12 per week in award rates up to and including $510 per week and an increase of $10 per week in award rates over $510 per week. The federal minimum wage was raised by 3.2 per cent to $385.40. This compares with the increases granted by the Commission last year, which were between $10–$ 14, with an increase in the minimum wage of 3.9 per cent.
Inflation expectations
Recent indicators of inflation expectations present rather disparate results across the community. Consumers' expectations of inflation have increased in recent months, as well as showing greater volatility. Business expectations of inflation, in contrast, remain very low.
Business surveys indicate that firms expect only small increases in their selling prices in the near term. According to the March quarter NAB survey, firms expect to increase prices by only a ¼ per cent in the next three months, down from around a ½ per cent a year ago. The ABS survey of business expectations indicated that firms expect no change in selling prices over the year to the March quarter 2000; this is almost 1 percentage point lower than their average expectation over the past year, and the lowest reading since the inception of the survey over five years ago. The survey suggests that small and medium-sized businesses expect prices to fall over the year ahead. The March quarter ACCI-Westpac survey of manufacturers reported that a greater number of firms expected to decrease than to increase prices in the June quarter. The generally low inflation expectations among businesses could be explained by a number of factors, including the fact that they are referring mainly to producer rather than consumer prices, the weaker-than-anticipated pass-through of the effects of currency depreciation in the recent period, continuing moderation in wage outcomes, and the general absence of inflationary pressures internationally.
Forecasts of inflation by financial-market economists, as surveyed by the Bank following the release of the March quarter CPI, have not markedly changed since three months ago (Table 12). An underlying inflation rate of 1.8 per cent is expected over the year to June 1999. Expectations for the headline CPI over the year to June 1999 have been reduced because the impact of the health insurance rebate in lowering the price of health services in the March quarter is now more accurately understood. For the year to June 2000, market economists forecast an inflation rate of 2.1 per cent in both headline and underlying terms. The longer-term expectation for inflation by financial-market participants remains low. Inflation expectations as implied by the difference between the 10-year bond yield and the indexed bond yield of the same maturity are now just under 2 per cent, having increased slightly since the start of the year.
| Year to June 1999 | Year to June 2000 | ||||
|---|---|---|---|---|---|
| Jan 1999 |
April 1999 |
Jan 1999 |
April 1999 |
||
| Market economists(a) | |||||
| Headline | 1.6 | 1.2 | 2.2 | 2.1 | |
| Underlying | 1.7 | 1.8 | 2.1 | 2.1 | |
| Union officials(b) | |||||
| ‘Inflation’ | 1.8 | 1.5 | 2.3 | 2.0 | |
|
(a) RBA survey of financial-market economists. (b) ACIRRT survey of trade union officials. This survey does not explicitly distinguish between underlying and headline inflation measures. |
|||||
By contrast, consumers' expectations of inflation for the coming year are significantly higher than a year ago (Graph 32). The median response from the Melbourne Institute survey of inflation expectations has fluctuated quite widely in recent months, but has clearly increased, averaging 4.6 per cent thus far in 1999, compared with an average of 3.8 per cent in the second half of 1998. The volatility in this measure appears to be explained partly by the fact that responses tend to be concentrated on particular whole numbers (especially 0, 2, 3, 5 and 10) combined with uncertainties about higher inflation – perhaps induced by currency weakness – leading respondents to change their expectations in discrete jumps. In order to abstract from some of this volatility, a ‘trimmed mean’ is calculated as the average of the middle 80 per cent of responses. This suggests an increase in expected inflation of a little under ½ a percentage point since late 1998.
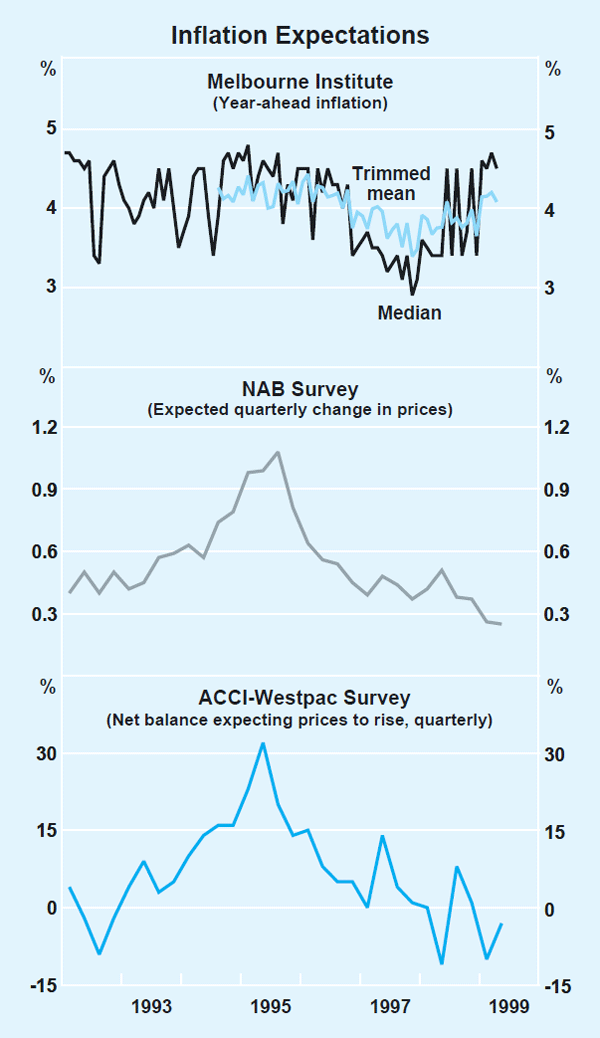
Inflation outlook
As noted above, consumer prices for goods and services sourced domestically have risen by just over 2 per cent over the past year. Overall inflation has been held down to a surprising degree by declining import prices. Even so, the underlying inflation rate has tended to drift up, to its current level of 1.7 per cent. While there may be some element of noise in the latest, relatively large quarterly increase in the underlying CPI, the latest two quarters taken together still suggest a slight pick-up in the inflation rate.
The prospective behaviour of import prices represents an important source of uncertainty for the inflation outlook. It is clear that there are significant disinflationary pressures operating in international traded goods markets at present, with prices of traded industrial goods declining noticeably in foreign currency terms over the past year. With the global economy growing at a below-trend rate, there is every prospect that these disinflationary pressures in international markets will persist in the near term. In the Bank's judgment, however, it remains more likely than not that some of the import price increase seen at the docks will show up eventually in consumer prices. If consumer import prices were merely to stop falling, that would contribute to some further pick-up in the inflation rate. While some increase in import prices in the near term remains the most likely outcome, however, some further downward pressure cannot be ruled out if international competitive pressures were to intensify further. Such pressure would be more likely to be transmitted were the exchange rate to appreciate significantly.
Part of the recent containment of inflation has presumably reflected lower raw materials prices, driven by declines in commodity prices, most prominently oil. This process now looks to have run its course. Oil prices have increased sharply in recent months, and this should soon begin to have an effect on input prices and on the headline CPI (its direct effect is excluded from underlying measures). More generally, many commodity markets have taken on a firmer tone after the sharp price falls seen during 1998. Taken together, these developments suggest that commodity prices are unlikely to exert the same disinflationary effect this year as they did in 1998.
Domestic cost pressures remain well contained. The most plausible indicator of wage costs, the wage cost index, is currently increasing at just over 3 per cent. Total labour costs, including on-costs, are probably increasing slightly more quickly but, given strong productivity growth, unit labour cost growth is quite subdued. The labour market appears to be showing greater flexibility than in previous business cycles, with no evidence at this stage of any general upward pressure on wage settlements despite the continuation of strong economic growth and declining unemployment. These outcomes suggest that the economy has scope to continue expanding at a good pace over the next year without generating a significant pick-up in domestic cost pressures. Inflation expectations of businesses remain low, but there has been a noticeable increase in consumer inflation expectations over the past six months.
On balance, the Bank's assessment is that underlying inflation will gradually increase to around 2 per cent by the end of 1999, and remain at around that level into the following year. The CPI will show a lower annual rate until early next year, reflecting the reduction in health costs associated with the health care rebate in the March quarter, although increasing petrol prices are likely to partly offset this in coming quarters. For the purposes of evaluating inflation relative to the target, the Bank will, of course, abstract from the health care effect. From the September quarter 2000, both the headline and underlying measures will be increased noticeably by the introduction of the proposed GST. As explained previously, the Bank will look through the direct effect of the GST in assessing inflation for monetary policy purposes.
Box D: The Price of Motor Vehicles
Despite the large depreciation of the Australian dollar since the middle of 1997, prices for motor vehicles, particularly imported motor vehicles, have continued to decline. That car prices have declined to some extent is not unusual internationally over recent years (Graph D1). What is striking is the extent of the decline in Australia, particularly given the extent of currency depreciation.
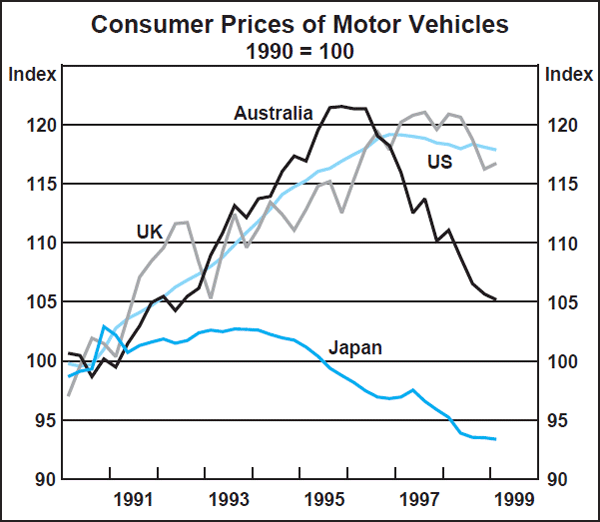
The fall in prices at the retail level also stands in contrast to the rise of about 14 per cent in the price of imported cars as measured ‘at the docks’ (Table D1). There appear to be both international and domestic forces at work in producing this outcome. In explaining the divergence between dock and retail prices, two factors are probably important: coverage differences and price determination, including discounting, at the domestic level.
|
Share of the imported component of the CPI |
Percentage change since June 1997 to: |
|||
|---|---|---|---|---|
| Dec 98 | Mar 99 | Mar 99 | ||
| Import price deflator |
Import price index (IPI) |
Import prices in the CPI |
||
| Total | 100 | 8.9 | 10.4 | −3.1 |
| – Motor vehicles | 16 | 10.9 | 13.6 | −12.1 |
| – Other goods | 75 | 7.0 | 9.9 | −1.2 |
| – Overseas travel | 9 | 11.5 | .. | −0.9 |
The CPI coverage of imported motor vehicle prices reflects the objective of measuring prices paid by households, and thus has a relatively high weight on the lower-priced vehicles from Asia, whereas measures of dock prices are intended to cover all imported vehicles, including more expensive European cars. In the past, prices for the two broad groups of cars rose at similar rates so this sampling difference did not drive a wedge between dock and retail price increases.
Over recent years, however, Asian car manufacturers have cut their export prices in US dollar terms. This was occurring prior to the onset of the Asian crisis, and has continued since then. Detailed ABS data on import values and volumes by origin measured ‘at the docks’ suggest that the average price of Korean cars fell by 18 per cent, in $A terms, between mid 1997 and March 1999. Over the same period, the average price of cars from the US and Germany rose by around 20 per cent. A higher weight on Korean cars and lower weight on American and German cars in the CPI, compared with measures of dock prices, will thus have contributed to the recorded difference between movements in the two price series.
Discounting refers to cash-back offers/ rebates, free accessories and ‘on the road’ features such as extended warranties and free insurance. If the foreign supplier offers discounts to the importer, who in turn passes them on to the consumer, then the dock price, as well as the retail price, is in principle adjusted downwards. However, discounts in the form of free accessories still tend to cause a divergence between movements in dock and retail prices, since the domestic markups forgone on these accessories are typically much greater than those forgone by the foreign supplier.
If the exporter offers rebates directly to the consumer, or the importer initiates discounts, then only the retail price is affected and a divergence between movements in dock and retail prices arises. Anecdotal evidence suggests importers are responsible for the bulk of discounts. In particular, Japanese car prices have risen at the docks, but fallen at the retail level. These prices have a substantial weight in the CPI. Consistent with this, the available evidence on profit margins for wholesalers in the motor vehicle industry suggests they have fallen over the past few years. However, these falls may well have been less than that suggested by the fall in retail prices alone; cost cutting appears to have helped prevent too large a fall in overall margins.
A number of other explanations have been advanced for the divergence between dock and retail prices. For example, hedging by importers in 1997/98 may have delayed the need to increase prices. It seems likely, however, that hedging contracts of typical length for the industry would have expired some time ago. Reductions in car tariffs, which affect retail but not dock prices, will have contributed to downward pressure on car prices over time, although that appears to be insufficient to explain the emergence of a sharp discrepancy between retail and dock prices over the past year.
These explanations of the gap between measured import prices at the docks and those at the retail level still leave, however, the question of why some foreign suppliers have reduced their foreign currency price to Australian distributors and/or consumers. The global oversupply of small, low-priced cars, occasioned at least in part by the expansion of Asian manufacturers in the mid 1990s, is the most likely reason for general downward pressure on car prices. The currency depreciations in Asia have allowed some producers in that region to cut their foreign currency prices more aggressively than producers elsewhere. Both these factors would help to explain why importers, especially those that are linked to foreign suppliers, may have cut their gross margins. The fact that the Australian market is characterised by a much higher degree of importation than the United States – imports make up about half of vehicle sales in Australia, versus less than 20 per cent in the US – also does much to explain the bigger impact of international price cutting here.
It is likely, however, that some domestic factors have contributed. Despite price reductions, the share of Asian manufactured cars in the Australian market has barely increased since the middle of 1997. This suggests that domestic manufacturers, with improved productivity resulting from investment in new plant and changed work practices, have been able to compete effectively in the past few years.