Reserve Bank Bulletin – August 2001 Statement on Monetary Policy
Download the complete Statement 935KB
The Australian economy resumed growth during the first half of 2001, after a small downward adjustment in the second half of 2000 associated with the transitional effects of the introduction of the GST. The rapid fall-off in dwelling construction came to an end around the turn of the year. With household consumption and government spending moving ahead, and the trade sector of the economy adding to production, real GDP recorded a solid rise in the March quarter, despite a substantial reduction in business inventories. On the basis of information currently available, it seems likely that further good growth occurred during the June quarter.
In the period immediately ahead, the housing sector will be recovering to more normal levels of activity, underpinned by the fact that the long-term requirement for new dwellings almost certainly exceeds the number of commencements currently occurring. In addition, lower interest rates, the subsidy for first-home buyers, and some moderation in construction costs are providing strong impetus to the upturn. On the basis of the leading indicators, this pick-up, which can be expected to get under way in the current quarter, could well be quite rapid. Non-residential building activity, which has been subdued for some time, is also likely to pick up over the coming year. These developments will translate into higher levels of activity in the manufacturing sector in due course.
The firmer short-term outlook has been reflected in higher levels of confidence. While businesses continued to report relatively subdued trading conditions in the June quarter, a significant lift in measures of confidence about the period ahead was apparent across a wide range of surveys. Consumer confidence has also recovered strongly.
As yet, there has been no improvement in the labour market, which is still showing the effects of the period of reduced growth last year. Employment has been static for some months, with the number of full-time jobs declining significantly. Vacancies data suggest little short-term improvement, though they appear to have stopped falling, and business surveys are signalling a firming in employment intentions. Labour markets in the construction and manufacturing sectors will enjoy firmer conditions during the coming year, while some areas of service sector employment, which have been strong up to now, show signs of weakening. The unemployment rate has risen by about a percentage point since mid 2000 and, even though economic activity has already picked up again, is likely to increase further before reaching a peak.
There is some risk that continued weakness in the labour market in the period immediately ahead will undermine household income and hence consumption growth. But upside influences on domestic demand growth can also be identified, given the possibility of a rapid run-up in housing construction. In addition, financial conditions are accommodative and, with the Australian share market performing much more strongly than overseas markets, there has not been the reduction in wealth as has occurred elsewhere.
In fact, the main downside risks to the Australian economy's growth prospects now come from abroad. Such risks have increased in recent months, as the global manufacturing slowdown which began in the United States last year has spread to Japan, most of the rest of Asia and Europe. US manufacturing is experiencing a contraction similar in intensity to that of a decade ago, though to date the willingness of US households to continue expanding their consumption spending – albeit at a reduced pace – has kept the US economy from encountering a general recession. Tax cuts and the substantial easing by the Fed so far in 2001 are supportive of the US economy, though the high level of the US dollar and continued weakness in share markets are working in the opposite direction.
In Asia, manufacturing production has fallen sharply in a number of countries which had hitherto been growing strongly. The global cycle in information technology is the key driver here. These economies benefited as suppliers to the information technology investment boom of recent years, but are equally exposed to the ensuing slump. Major Asian economies (and Australian trading partners) such as Japan and Korea are affected, as are Singapore, Malaysia, and Taiwan. To date, China's economy, which is less internationally exposed than most others in Asia, has continued to expand quite quickly. European growth has also slowed more than expected.
The tendency in the early part of the year for assessments of global growth to be marked down has continued over the past few months. Most observers still expect a pick-up in global growth in 2002, assisted by relatively easy global monetary policy settings, fiscal expansions in the US and Europe, and lower oil prices. To the extent that what is being observed is a relatively conventional business cycle, this appears to be a reasonable expectation. But there is always something unique in each cycle which means that average cyclical experience cannot be automatically assumed to apply. In the current episode, the very rapid pace of investment in information technology in recent years in the US (and to a lesser extent elsewhere) raises the question of whether there is an overhang of such capacity and, if there is, how long that will take to work off.
Hence the global scene warrants careful attention. A continued trend to simultaneous weakness in all the major regions of the world economy, if it occurred, could be expected to impart a disinflationary impulse to prices of traded goods and services. A number of commodity prices (though not those most important to Australia) have already weakened. There would also be, of course, impacts on the volume of business experienced by Australian exporters and import-competers, which would in due course feed through to weaker incomes and softer domestic demand conditions than otherwise.
The low level of the Australian dollar is, to a degree, insulating the domestic economy from external weakness. Net exports have continued to make a significant contribution to aggregate demand, and the current account deficit looks to have fallen to around 2 per cent of GDP in the June quarter, a level not seen for about two decades. The exchange rate has at times during recent months again come under downward pressure, though it has remained noticeably above its early April lows. The Bank has intervened in the market from time to time to provide support when market sentiment seemed to be unreasonably bearish.
The trend in inflation in Australia has been as hard to assess in the past year as that of economic activity because of the complexity of the effects on the price level of tax reform and changes in the exchange rate. A year ago, price data suggested a gradual but clear build-up in inflation had been under way for a year or so. At that stage, with the exchange rate low and growth robust (but with monetary policy having been tightened), the Bank expected inflation to be in the upper part of the 2–3 per cent target during 2001. Six months ago, that forecast looked too high, as the September and December quarter CPI results were both lower than expected, and in the February Statement, the Bank revised down its estimate of the then current rate of underlying inflation to around 2 per cent. As that and other Statements have explained, there were a number of difficulties in interpreting these data. Were the expected effects of the GST and other tax changes smaller than anticipated? Or was their timing simply delayed, with businesses temporarily absorbing cost impacts in their margins? And where were the expected effects of the low exchange rate?
Both the CPI results in 2001 to date, in contrast, have been a little higher than generally expected. For the year to June 2001, the CPI increased by 6.0 per cent. Of this, net tax effects may have contributed something approaching 3 percentage points, and the direct effect of rising petrol prices almost a further half a percentage point. This calculation, together with several measures of core inflation, suggests that underlying inflation net of tax effects was around 2¾ per cent for the year to June 2001 – in other words quite close to what was forecast a year ago. It appears that the temporary compression of margins in late 2000 is being gradually unwound, and that the effects of tax and exchange rate changes are being more fully passed on.
In the case of exchange rate effects in particular, these impacts are unlikely to be complete yet, so that somewhat elevated quarterly price rises might be observed for a while. Hence the Bank expects that underlying inflation will be around 3 per cent on an annual basis in the near term, before declining to around 2½ per cent through 2002. The fact that growth in labour costs has been well-contained, and is likely to remain so, underpins this forecast. Inflation as measured by the CPI will be affected by these same trends, but – assuming current oil prices and exchange rates – the decline in petrol prices currently being observed is likely to bring the annual CPI inflation rate down a little, to below the underlying rate of inflation during the next few quarters.
Since April, the Bank has not made any change to the stance of monetary policy, after three relatively rapid reductions in interest rates earlier in the year. With the change in the domestic economic news for the better and the resulting improvement in sentiment, the Bank judged that the stance of policy had been adjusted sufficiently to address the domestic downside risks to growth. In addition, current and near-term inflation is a little higher than it appeared a few months ago.
With a central forecast for inflation of around 3 per cent, as one-time influences on the price level are absorbed, it is quite possible that observed rates of inflation above that figure may be recorded. But provided that this is a temporary phenomenon – which would depend on inflation expectations remaining well-anchored, and wages growth remaining moderate – it would not call for a tightening of monetary policy. Policy must, instead, be set with a view to influencing the inflation outlook over the slightly longer term, beyond the period heavily affected by these short-term influences. The current stance of policy seems well-attuned to this task, but there are conflicting currents which could shift the balance of risks in either direction. The Bank is continuing to assess the outlook, including the effects of the recent improvement in domestic conditions and of the deterioration in the international environment. As always, the Bank is prepared to adjust monetary policy as required, in pursuit of sustainable growth consistent with the inflation target.
International Economic Developments
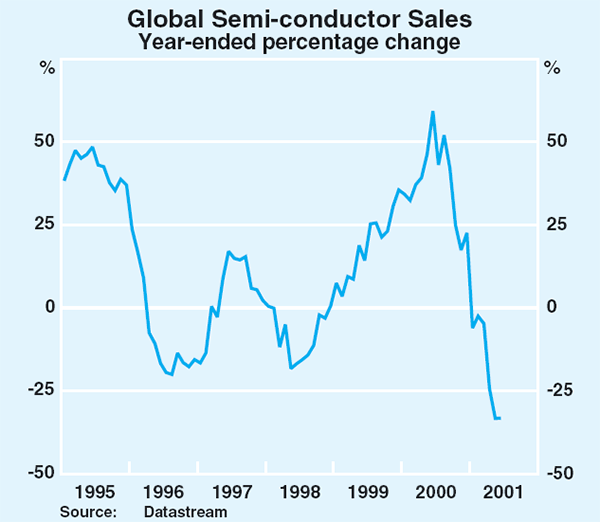
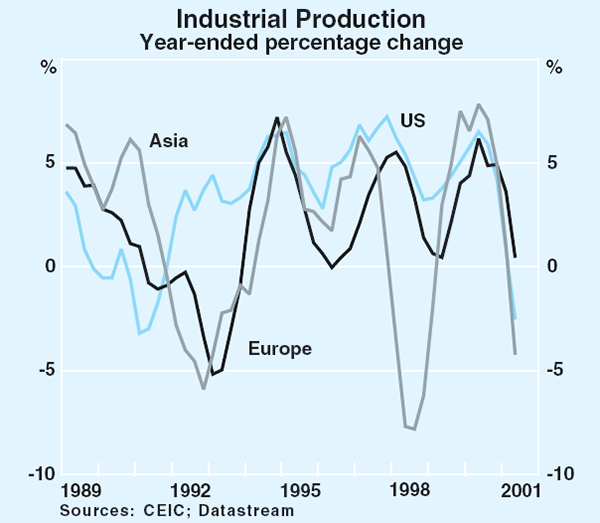
Conditions in the global economy have become more subdued over the past few months, with weaker-than-expected growth being recorded in the euro area and across most countries in Asia. In contrast to the Asian crisis, where the slowing in growth was concentrated in the emerging market economies, particularly in Asia, in this episode the slowing has been more widespread across both industrialised and emerging market economies. The slowdown in the US has clearly been central to these developments, as has the related contraction in the global information technology and communications sector, after several years during which this sector had underpinned strong growth across many countries (Graph 1). A feature of this slowdown has therefore been the significant and synchronised slowing in many countries' manufacturing sectors (Graph 2) and a contraction in global trade. In some cases this slowing has, in turn, been exacerbated by a weakening in domestic demand.
Although inflation concerns remain in some countries, wage growth has remained well contained, and there is some evidence that the weakening in global demand may be leading to a softening in global manufactured goods prices. Across the world, the inflationary effects of the earlier pick-up in oil prices are now starting to abate. In Europe, higher food prices and the inflationary effects of the lower euro have increased inflation more recently, although these effects should be temporary.
The Americas
The US economy grew by 0.2 per cent in the June quarter and by 1.3 per cent over the year to the June quarter (Graph 3). A sharp fall in business investment, combined with a considerable run-down in inventories, has driven the softening in growth over the first half of 2001, although this has been partly offset by continued resilience in consumer spending and a pick-up in dwelling investment.
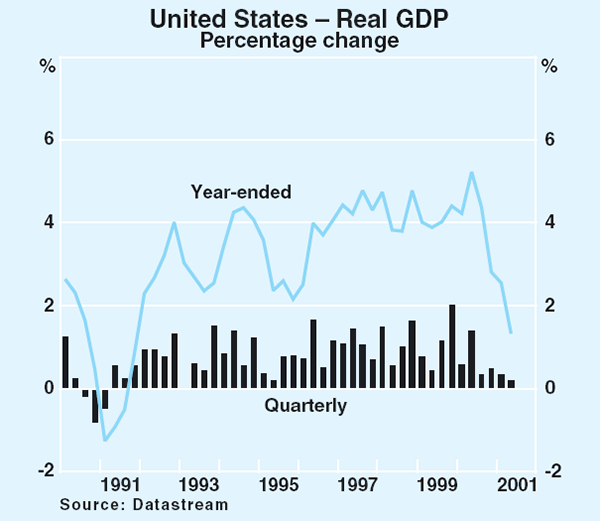
Although the weakness in US growth was initially concentrated in the traditional manufacturing industries, profits and production have now fallen across a wide range of industries including the information technology and communications (ITC) sector. Overall, industrial production has fallen by over 4 per cent since the peak levels recorded in September last year, and as a result capacity utilisation rates have fallen markedly. This, combined with the very high levels of investment that have occurred in recent years and the possibility that there has been some degree of over-investment, implies that business equipment investment may remain subdued for some time.
A broadly based weakening in employment growth is a further indication that the slowdown has now spread across the economy. The level of employment has fallen since the beginning of the year in the wholesale trade and manufacturing sectors, with the fall in the latter sector being by far the most severe. Reflecting the weakness of demand and falling production levels, the average number of hours worked in the manufacturing and wholesale trade sectors has also been lower, on average, this year than in the second half of 2000. The unemployment rate has gradually increased from its low point of 3.9 per cent in October last year to 4.5 per cent in July.
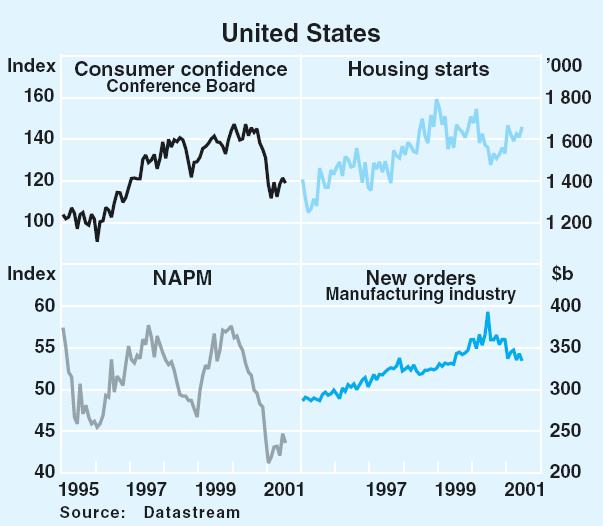
A range of indicators, however, suggest that the outlook for the US economy may be stabilising (Graph 4). In part, this may be attributed to the 275 basis points decrease in the Fed funds rate since January and the expansion of fiscal policy that has taken place via lower marginal tax rates and the one-off tax rebate paid mid year. Both manufacturing and other firms are beginning to show a little more optimism, as indicated by the NAPM index, and new orders in the manufacturing sector appear to be stabilising. Consumer sentiment has increased a little and remains above its long-run average level, and forward indicators in the housing sector point to continued growth.
Notwithstanding these developments, downside risks to the outlook remain. By most assessments the US stock market remains highly valued, despite the correction that has taken place since early 2000, and there is a risk that further adjustments of the share market will have contractionary effects. Combined with continuing weakness in the labour market, further corrections in household wealth holdings could dampen consumer spending. As mentioned above, it also appears possible that there will be a protracted period of low levels of investment, following the very high levels of investment of the past few years. On the other hand, the considerable correction in inventories that has taken place in the first half of 2001 would suggest that much of the production adjustment to the inventory overhang that developed last year has now occurred.
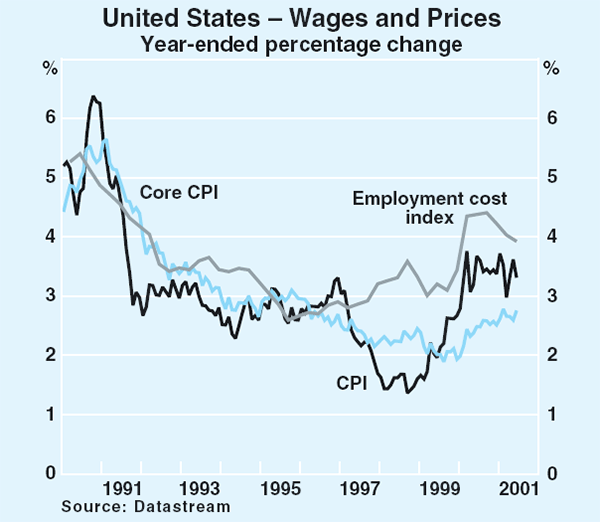
Both wage and consumer price inflation have increased over the past couple of years, although they have remained below previous cyclical peaks (Graph 5). Easing energy prices have exerted downward pressure on inflation in recent months, with consumer price inflation now at 3.3 per cent, and producer prices easing considerably. While core inflation has continued to drift up, to be running at 2.8 per cent compared with around 2½ per cent a year ago, growth in the wages component of the employment cost index (ECI) has remained around its level of the past year, at a little under 4 per cent, and growth in the benefits component of the ECI has eased a little.
The slowdown in the US has contributed to a slowing in growth in the rest of the Americas. In Canada and Mexico, real output growth began weakening towards the end of 2000 as US demand for these countries' exports declined. Year-ended growth of the Canadian economy has slowed from 5 per cent in March 2000 to 2½ per cent in March 2001. The Mexican economy has contracted sharply, with negative growth in output being recorded in both the December and March quarters and year-ended growth falling to 2 per cent, down from nearly 8 per cent a year earlier. The Argentine economy has experienced little growth in nearly three years and significant price deflation. In recent months this has been accompanied by a credit squeeze, as concerns have been raised about the country's ability to service its debt, leading to a significant increase in the interest rate charged on US dollar denominated Argentine debt. These problems have been exacerbated by Argentina's exchange rate regime; the Argentine peso is pegged via a currency board to the US dollar, with the strength of the US dollar in recent years resulting in a significant competitive disadvantage on the traded goods sector in Argentina. (Further details are provided in the ‘International and Foreign Exchange Markets’ chapter.) In Brazil and Chile, although growth has weakened it has remained positive, with a depreciation of each of these countries' exchange rates providing some offsetting stimulus. Financial markets in these countries, however, have been adversely affected by the problems in Argentina.
Asia-Pacific
Japan
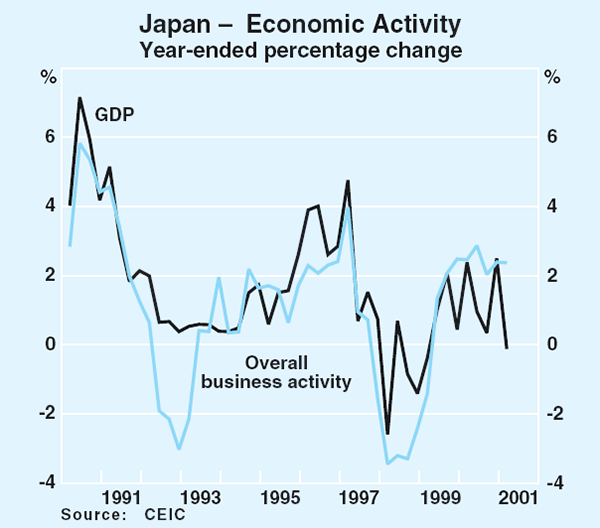
After recording strong growth in the last quarter of 2000, the national accounts suggest that the Japanese economy contracted slightly in the March quarter and indications are that conditions deteriorated further in the June quarter (Graph 6). In the March quarter, public investment offered the only substantial positive contribution to growth.
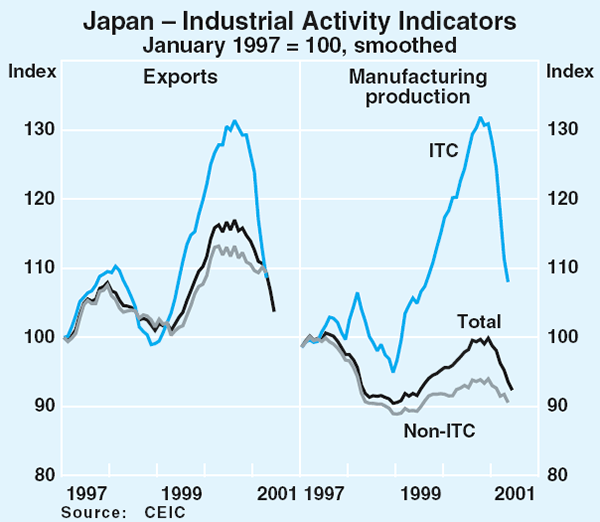
External demand and investment, which had been the significant drivers of growth during the preceding few years, weakened sharply in the first half of 2001. The weakening in global demand for ITC goods, particularly in the United States, has been especially important and has been translated into weaker export volumes (Graph 7). Exports have fallen by over 13 per cent since their peak in August last year, with exports of electronics goods being around 25 per cent lower. This has contributed to a sharp fall in industrial production and weaker equipment investment.
The weakening in activity has led to a deterioration in conditions in the labour market. Employment has fallen sharply over the past few months, more than unwinding the growth in the second half of 2000, and job offers are on a downward trend, suggesting the weakness in employment will continue in the near term. These developments, together with subdued income growth, have contributed to a softening in consumer sentiment to below the average level recorded in the 1990s. Consumer spending continues to be weak, particularly taking into account the temporary boost to spending that recent tax changes are likely to have caused in the March quarter. Against this background, prices continue to fall, with core consumer prices being 0.6 per cent lower in June 2001 than a year earlier.
Non-Japan Asia
The slowdown in non-Japan Asia that began towards the end of 2000 continued during the first half of 2001, with only the Chinese economy continuing to expand at a robust pace (Graph 8). The slowing has been most pronounced in those countries that had benefited most from the boom in global demand for electronic goods in recent years. In those countries, weakness in exports has generally been accompanied by a weakening in domestic spending. Overall, however, growth in the region during this year and the next is still expected to be well above growth rates recorded during the Asian crisis.
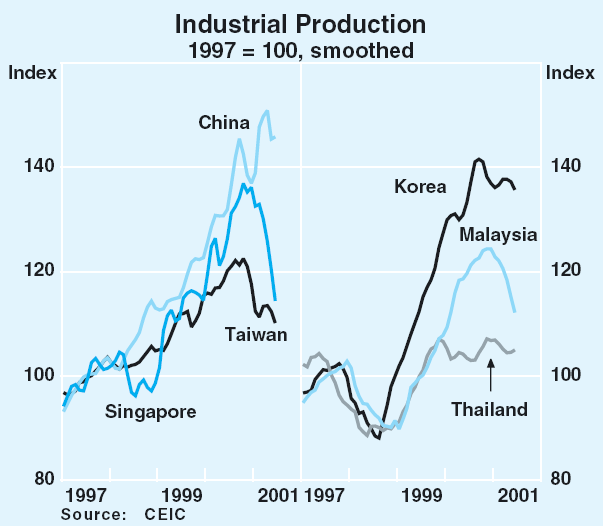
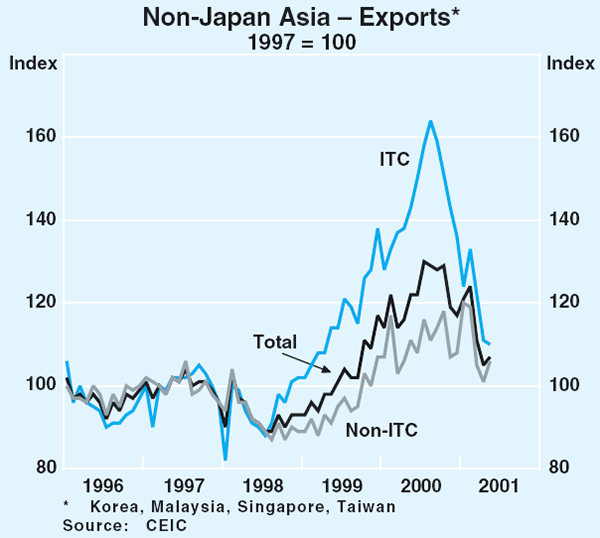
As in Japan, the speed and severity of the downturn in non-Japan Asia's exports and manufacturing production has been significant (Graph 9). After increasing by 27 per cent over the year to June 2000, the region's exports fell by 6 per cent over the year to May 2001. As mentioned above, the contraction in global demand for ITC equipment has been the major factor behind this turnaround, with exports of ITC equipment from the major electronics-producing countries having fallen by around 33 per cent since the peak recorded in August last year. The decline in exports has, in turn, led to falls in business confidence, industrial production, business investment and imports (reflecting the large imported component in the region's exports).
Consumer spending has also softened, after a couple of years of reasonably strong growth. Consumption is being affected by falling asset prices and declining consumer confidence in Taiwan, Hong Kong and Korea, with rising unemployment also being a factor in Taiwan and Hong Kong. In many of these countries, fiscal measures have been announced to provide support to domestic demand, and central banks in Taiwan, Korea and the Philippines have responded to the deterioration in external developments and weaker domestic spending by further easing monetary policy. Interest rates have also fallen in Hong Kong in line with US rates.
In contrast to much of the region, the Chinese economy has continued to grow strongly, as expansionary fiscal policy and high levels of foreign direct investment have supported robust domestic demand. While export growth has moderated in recent quarters in response to the global demand slowdown, with a buoyant domestic economy, relatively less exposure to the ITC sector and exports comprising around 25 per cent of GDP – a much smaller share than for most other countries in the region – the impact on overall growth has been minimal.
New Zealand
The New Zealand economy has slowed significantly over the past year; real output expanded by under 1 per cent over the year to the March quarter, down from 5½ per cent over the year to March 2000. Net exports have remained a source of growth, with the low New Zealand dollar offering some insulation from the slowdown in the world economy. Consumer spending has also held up well. Investment spending, however, has softened in line with weaker business confidence. The Reserve Bank of New Zealand reduced official interest rates by a quarter of a percentage point to 5.75 per cent in May, citing the further slowdown in world growth. Consumer price inflation remains marginally above the RBNZ's target band, although it has come down from its recent peak in December 2000.
Europe
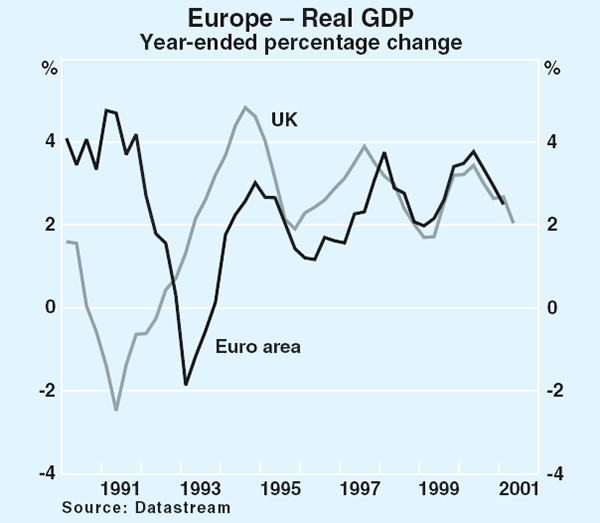
Growth in Europe eased a little over the six months to the March quarter, with domestic demand slowing quite sharply and exports weakening in some regions, although it has remained around the average level recorded over the second half of the 1990s (Graph 10). Indicators suggest that a further moderation in growth is likely to have occurred in the June quarter, given the further falls in industrial production and the weakening in retail spending that has taken place. Similar to developments elsewhere in the world, the manufacturing sector in Europe has slowed significantly more than the rest of the economy, with industrial production in both continental Europe and the UK experiencing declines from their peaks late last year. Across Europe, the manufacturing sector has experienced large falls in both domestic and foreign orders and confidence.
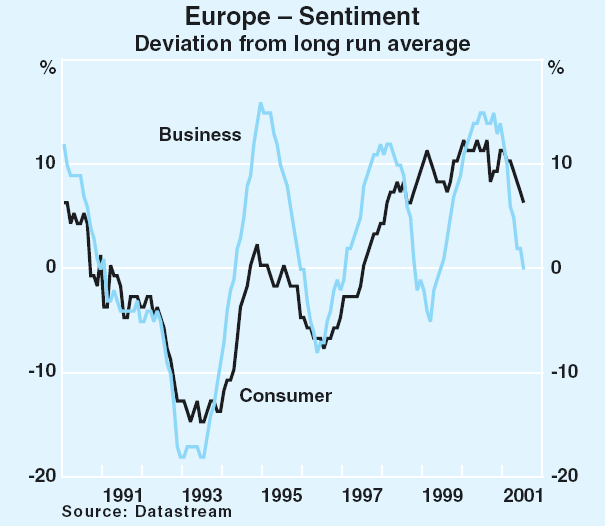
At this stage, Europe's prospects, however, remain relatively positive. Business confidence, for example, although having weakened significantly in recent months, has remained around levels of the mid-1990s slowdown, and well above levels reached in the early 1990s (Graph 11). Consumer confidence has also weakened a little, but remains well above the average level recorded in the 1990s. In part, the strength of consumer confidence may reflect the relatively stronger performances of the European labour markets to date. Although employment in the euro area as a whole fell in the March quarter, the unemployment rate has remained at its recent low. The UK labour market has recorded stronger growth, and the number of unemployed persons continued to decline in June. Fiscal policy has also been eased across many European countries during the past year, and although this has not yet had the expected stimulatory effect on consumer spending, it should provide some support to domestic demand in the period ahead.
Inflation in the euro area has risen in 2001 to reach its highest level since the introduction of the euro in 1999. It has been boosted by increases in food prices, related to livestock diseases and adverse weather conditions, and energy prices, due to the combined influences of higher global oil prices and the lower euro. Measures of core inflation have also increased steadily over the first half of 2001, from around 1.5 per cent to just over 2 per cent, possibly reflecting the second-round effects of earlier oil price rises and pass-through from the depreciation of the euro. In part as a result of these developments, the European Central Bank has eased monetary policy by only ¼ of one percentage point this year, although at 4.5 per cent, the policy rate is not high by historical standards. Inflation in the UK also increased strongly earlier in the year, reflecting food and energy price rises, but at 2.4 per cent remains within the Bank of England's target band. The Bank of England has cut interest rates by 1 percentage point this year, taking its policy rate down to 5 per cent.
The world economic outlook
Private-sector forecasts for world growth in 2001 have been revised down to 3.1 per cent in recent months, largely reflecting the weaker developments to date. For the industrialised countries as a group, the slowing is now expected to be close to that experienced in the early 1990s, though less protracted (Graph 12). Global growth is expected to pick up to around 4 per cent in 2002, on the back of a reasonable rebound in the US.
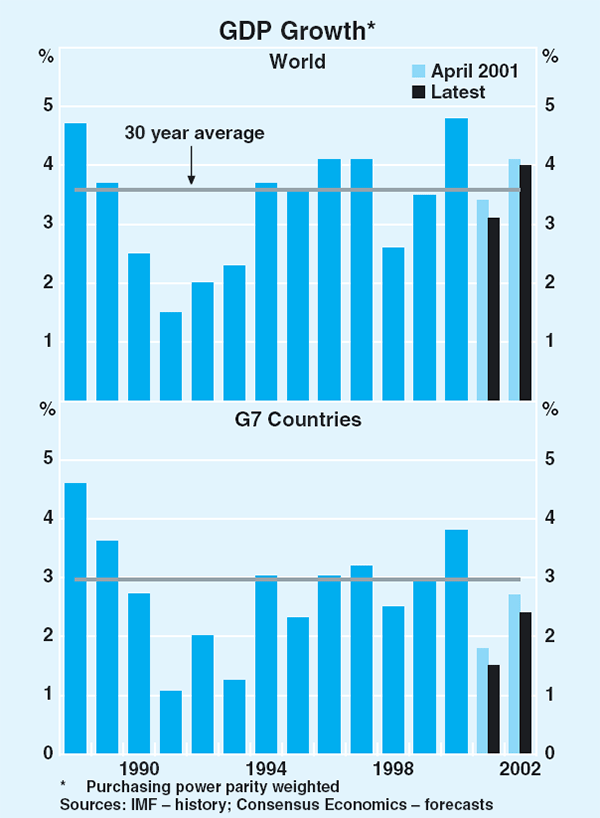
The widespread easing in both monetary and fiscal conditions around the world, and particularly in the US, since the beginning of the year should support such an outcome, although downside risks remain. A recovery in the US economy during 2002 is central to this outcome, but it is possible that the resolution of the remaining imbalances in that economy could constrain growth for a longer period. It is also possible that the synchronised slowing in growth across such a large number of countries will have self-reinforcing properties, through both trade channels and confidence, which will impede the recovery. On the other hand, the relatively benign inflationary environment and the reasonable state of most countries' fiscal balances should enable policy-makers to take further steps to support growth in the event that these risks were to be realised.
International and Foreign Exchange Markets
Short-term interest rates
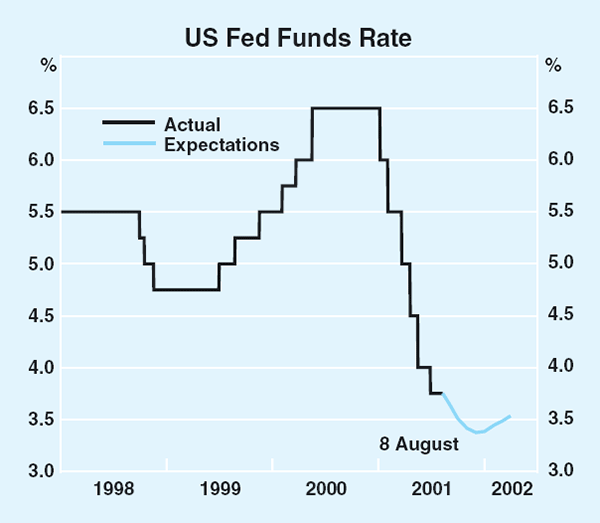
Central banks in most developed countries have continued lowering interest rates in recent months, though at a slower pace than earlier in 2001. In the US, the Federal Open Market Committee (FOMC) cut the Fed funds target by 25 basis points in late June, after five cuts, each of 50 points, earlier in the year (Graph 13). At that meeting the Fed maintained its easing bias, and later, Chairman Greenspan further reinforced market sentiment that another cut may be forthcoming when he gave evidence before the US Congress in July. He noted that the period of sub-par economic performance is not yet over and that further weakness may require some policy response from the Fed. Reflecting this assessment, markets are now expecting a 25 basis point reduction in the Fed funds rate at the meeting later this month and some likelihood that rates may be eased further later in the year.
Easings by other central banks continue to be less than those in the US. Among the English-speaking countries, aside from the easing in Australia, which is discussed in the chapter on ‘Domestic Financial Markets’, the Bank of Canada has cut the overnight cash rate this year by 150 basis points to 4.25 per cent, the Bank of England by 100 points to 5 per cent, and the Reserve Bank of New Zealand by 75 basis points to 5.75 per cent (Graph 14). All cited weakening prospects for world economy growth as a major factor behind the latest moves.
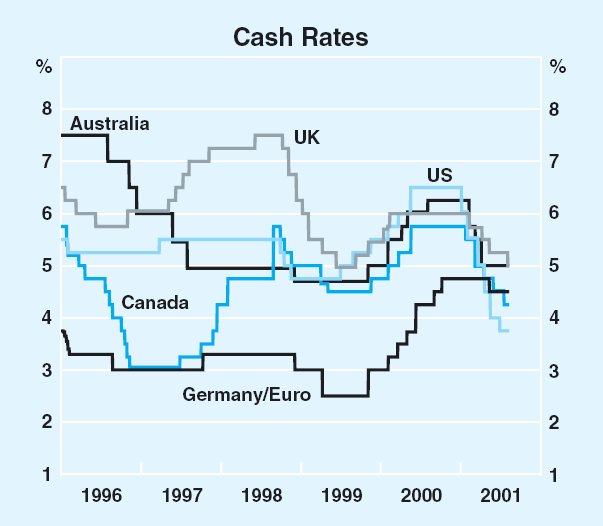
In Europe, the European Central Bank (ECB) eased rates by 25 basis points in May, to 4.50 per cent, its first easing this cycle. With inflation well above its 2 per cent target, the ECB has so far resisted calls for further cuts despite signs of a deterioration in the economic outlook. European rates are now above those in the US for the first time since late 1994. The Swiss National Bank cut rates by 0.25 per cent in March and has since left them unchanged at 3.25 per cent. The Swedish central bank moved against the global trend, increasing its policy rate by 25 basis points, to 4.25 per cent, in July as inflation breached the upper limit of its inflation target band (Table 1).
| 2001 | Cumulative changes since Jan 2001 |
Current level Per cent |
||||||||
|---|---|---|---|---|---|---|---|---|---|---|
| Jan | Feb | Mar | Apr | May | June | July | Aug | |||
| US | −100 | −50 | −50 | −50 | −25 | −275 | 3.75 | |||
| Australia | −50 | −25 | −50 | −125 | 5.00 | |||||
| Canada | −25 | −50 | −25 | −25 | −25 | −150 | 4.25 | |||
| NZ | −25 | −25 | −25 | −75 | 5.75 | |||||
| UK | −25 | −25 | −25 | −25 | −100 | 5.00 | ||||
| Japan | −10 | −15 | −25 | 0.00 | ||||||
| Switzerland | −25 | −25 | 3.25 | |||||||
| Euro area | −25 | −25 | 4.50 | |||||||
| Sweden | 25 | 25 | 4.25 | |||||||
The Bank of Japan (BoJ), having earlier reduced interest rates to zero, has changed its operating objective for monetary policy from an interest rate target to a quantitative target for bank reserves. Further deterioration in the Japanese economy recently has led to speculation that the BoJ may seek to ease monetary policy by increasing its reserves target from the current 5 trillion yen to 6 trillion yen over coming months. Concerns over the state of the banking sector once the mark-to-market accounting rules are implemented in September have also added to calls for a more expansionary policy. To date, however, the BoJ has resisted such calls.
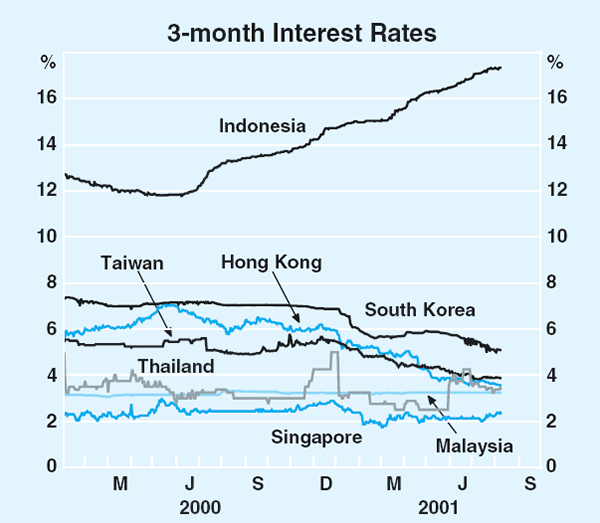
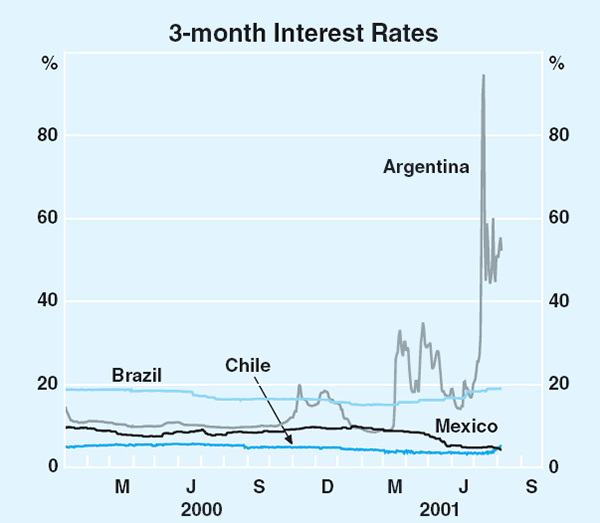
Many Asian economies, including Korea, Taiwan, the Philippines, and Hong Kong have eased monetary policy over recent months as the extent of the economic slowdown has become more apparent. However, several other emerging market economies have had to raise interest rates, despite slowing output growth, to counter exchange rate pressures. Included in this group are Indonesia, Thailand, Turkey and Brazil, but pressures were most acute in Argentina, where the government has had difficulty in rolling over maturing securities. Short-term interest rates in Argentina spiked to over 90 per cent, compared with around 10 per cent early in the year (Graphs 15 and 16).
Long-term interest rates
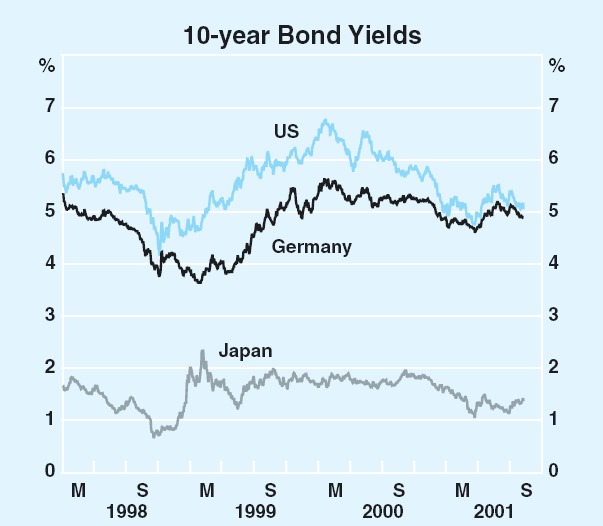
After falling from around 6.50 per cent in May last year to 4.75 per cent in late March 2001, yields on 10-year US Treasury bonds increased significantly over April and May, peaking at 5.50 per cent (Graph 17). The sharp increase seemed mainly to reflect confidence that the Fed's cuts to official interest rates would succeed in promoting a quick recovery in the US economy. As noted below, this sentiment was similarly reflected in a substantial recovery in US equity markets. Since late May, however, yields have fallen again, to around 5.00 per cent, as optimism regarding the economic outlook has dissipated in the face of continued weak economic data and disappointing corporate earnings results.
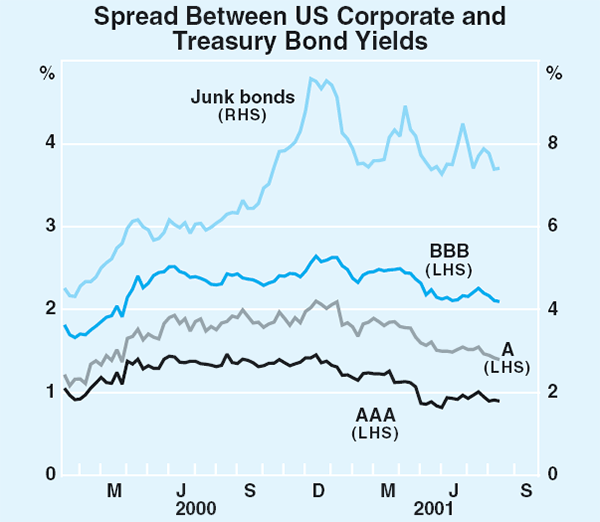
Changing views about the economic outlook have also been reflected in yields on corporate bonds. So far this year, the general trend has been for spreads to US Treasuries to fall, despite episodes when increases in risk aversion have temporarily pushed yields higher. Developments in Argentina in July, for instance, saw spreads across all risk classes move higher, as investors sought compensation for the increase in risk of holding corporate securities in such an environment (Graph 18). While spreads on the highest quality credits rose only marginally, yields on lower-rated corporate bonds have been much more volatile.
In European bond markets, yields have followed a similar, though more subdued, pattern. After falling steadily from around 5.30 per cent in the middle of last year to 4.60 per cent in late March 2001, yields on German 10-year government bonds increased significantly over April and May, peaking at 5.20 per cent. As in the US markets, however, bond yields have fallen somewhat since late May to their current level of around 4.90 per cent.
Yields on Japanese long bonds, having fallen to a low of almost 1.00 per cent in late March, rose to 1.50 per cent by mid April. This upward movement was in part driven by the improved financial market sentiment seen globally, but was also aided by increased political uncertainty ahead of the election for the President of the Liberal Democratic Party (Japan's dominant political party). Yields moved lower from late April, as the economic outlook deteriorated. The move was reinforced by expectations that the BoJ would increase its outright purchases of long-term government bonds and by confidence that the new Prime Minister Koizumi would tackle the country's entrenched economic problems. By early August, however, continued economic deterioration led markets to question the government's fiscal consolidation plans, pushing yields back up to around 1.35 per cent.
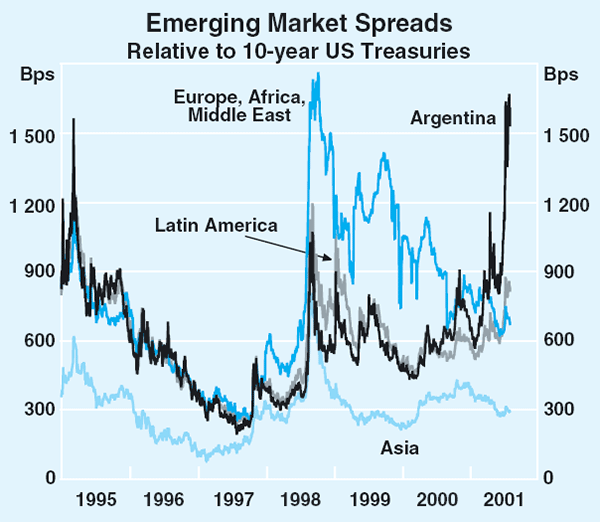
Developments in emerging markets have been dominated by events in Argentina, where concerns about the sustainability of exchange rate arrangements, and the ability of the government to meet debt repayments, have led to several large spikes in bond yields over recent months. The spread between Argentinian bonds and US Treasuries rose to over 16 percentage points at one stage in July, after averaging around 7 percentage points in the first half of 2001.
Contagion from events in Argentina resulted in rising yields throughout Latin America, particularly Brazil. A significant impact was also noticeable in European emerging markets but the contagion to emerging Asian markets has been relatively small, with spreads increasing by only around 20 basis points (Graph 19). Even though economic activity has been very weak in the Asian region over the first half of 2001, the finances of countries in this region, both public and external, generally remain in good shape and investors have seen little need to demand higher risk premia.
Equity markets
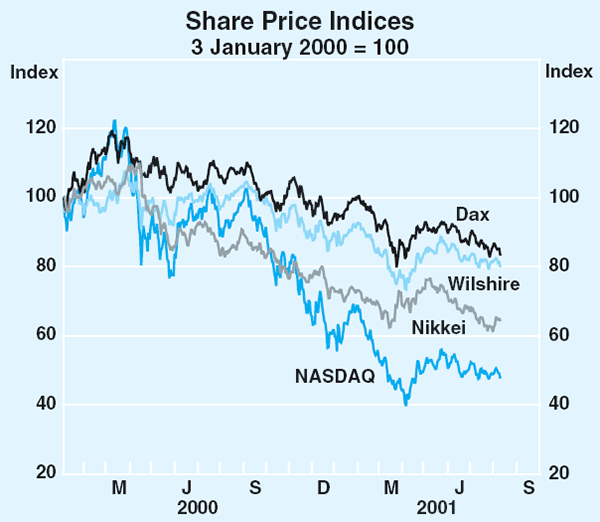
World share markets have been volatile so far this year, around generally declining trends. Having fallen sharply during the March quarter as the outlook for the global economy deteriorated and earnings expectations fell, markets rallied in April and May in response to falling interest rates. Markets assumed that this would lead to a quick recovery in economic activity and therefore company profits.
More recently, optimism about the rebound in economic activity, particularly in the US, has faded in the face of continued weak economic data. Together with a further deterioration in the corporate earnings outlook, this has caused equity markets to weaken significantly again. Earnings from companies in the S&P 500 index declined by around 17 per cent in the year to June 2001 with earnings growth expected to remain negative in the September quarter. This has seen share prices for companies in the Wilshire and S&P 500 fall on average by around 10 per cent since their recent highs in May, with the technology-rich Nasdaq companies down by around 15 per cent (Graph 20, Table 2). Compared with the record highs last year, US equity prices are down by around 25 per cent for broader-based indices and by 60 per cent for the Nasdaq.
| Change since 2000 peak |
Change over 2001 |
Change since May 2001 peak |
|
|---|---|---|---|
| United States | |||
| – Wilshire | −26 | −10 | −10 |
| – Dow Jones | −12 | −5 | −9 |
| – S&P 500 | −23 | −10 | −10 |
| – NASDAQ | −61 | −20 | −15 |
| Germany | |||
| – Dax | −30 | −13 | −11 |
| United Kingdom | |||
| – FTSE | −21 | −12 | −8 |
| Japan | |||
| – Nikkei | −42 | −12 | −16 |
| Australia | |||
| – ASX 200 | 1 | 6 | −1 |
| Canada | |||
| – TSE 300 | −33 | −14 | −9 |
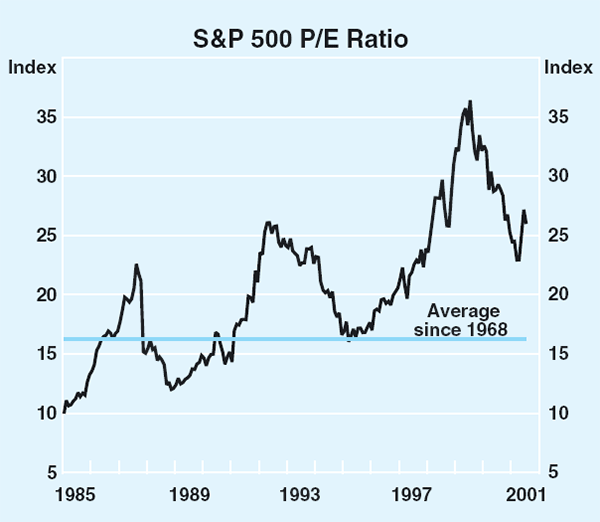
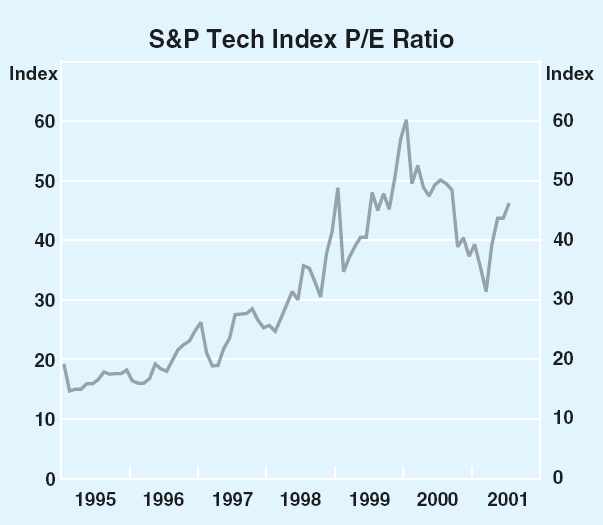
Despite the falls this year, share prices remain high relative to traditional measures of share valuations, such as price earnings ratios. The current P/E ratio of around 26 for the S&P 500, for example, remains well above its historical average of 16, even though it is down from the recent peak of 36 (Graph 21). P/E ratios of technology stocks remain particularly high, despite the sharp fall in these share prices. The P/E ratio for the S&P technology index, for example, is around 46 (Graph 22).
Share prices in other industrialised countries have generally taken their lead from the US. The German Dax and UK FTSE staged a temporary rally over April and May, but have come off by around 10 per cent since then. The decline in the Japanese Nikkei was also temporarily halted over April and May before deteriorating sentiment, both in Japan and in global markets in general, came to the fore. Heightened concerns about the size of the non-performing loan book for Japanese banks also depressed Japanese share prices. While the Nikkei reached new post 1990 lows, this in part reflected a distortion resulting from the re-weighting of the index in 2000. A more accurate indicator of share prices in Japan is provided by the Topix index, a much broader-based index of equity prices. It has fallen by around 15 per cent since its recent peak in early May, but remains within its 1990s range.
Share prices in Asian emerging markets have had a mixed performance in 2001. In aggregate, Asian (excluding China and Japan) share markets have fallen 14 per cent, but the performance has varied markedly between economies. While several of the larger markets have seen big falls, such as a 21 per cent decline in the Hong Kong Hang Seng index, others have seen solid rises. The Thai stock market, for example, has risen 20 per cent so far in 2001. In Latin America, the share market in Argentina has fallen by 23 per cent so far this year, with the negative effects impacting strongly on Brazil, where the stock market has fallen almost 10 per cent.
Exchange rates
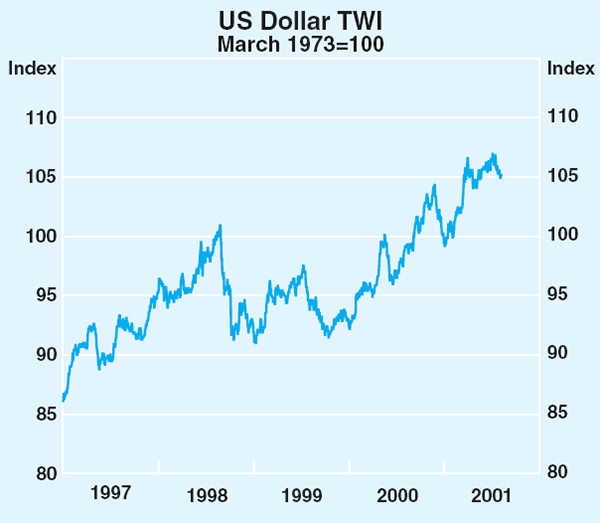
The US dollar's sustained appreciation since 1997 has continued for much of 2001 to date. On a trade-weighted basis, it reached a 16-year high in early July, but since then has fallen a little as investors seem to have become more concerned that the US economy may not rebound as quickly as previously thought (Graph 23, Table 3).
| Change over March quarter |
Change since end March |
|
|---|---|---|
| TWI | 7.1 | −1.4 |
| Euro | 7.5 | −0.4 |
| Yen | 10.4 | −2.2 |
| Pound sterling | 5.6 | −0.1 |
| Swiss franc | 8.2 | −2.0 |
| Canadian dollar | 5.1 | −2.6 |
A perception that the strong US dollar is hurting US exporters has also helped make investors more cautious about buying US dollars. While it is too early to say that the US dollar has peaked, several of the factors that have been underpinning its relentless rise over recent years have faded this year: the US economic outlook deteriorated more rapidly than elsewhere over the beginning of 2001; equity prices in the US have fallen sharply; last year's interest rate differential in favour of the US has been eliminated relative to most other countries as the Fed cut policy rates more than other central banks; and the US productivity gains of recent years have moderated.
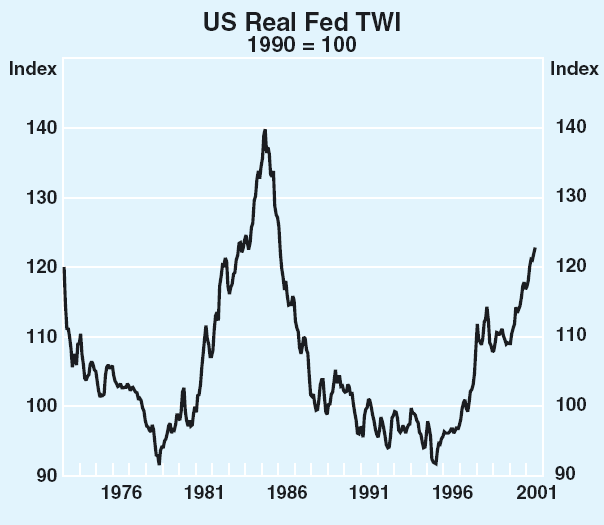
Adjusting for the effects of differing rates of inflation in its trading partners, the US trade-weighted dollar is now 16 per cent above its 30-year average, and about 35 per cent higher than its low in the mid 1990s (Graph 24). This is its highest level since January 1986. Indeed, since 1973 (when the major currencies began to freely float) the US dollar has only spent 22 months above its current level – between March 1984 and January 1986 – a period widely seen as a US dollar bubble.
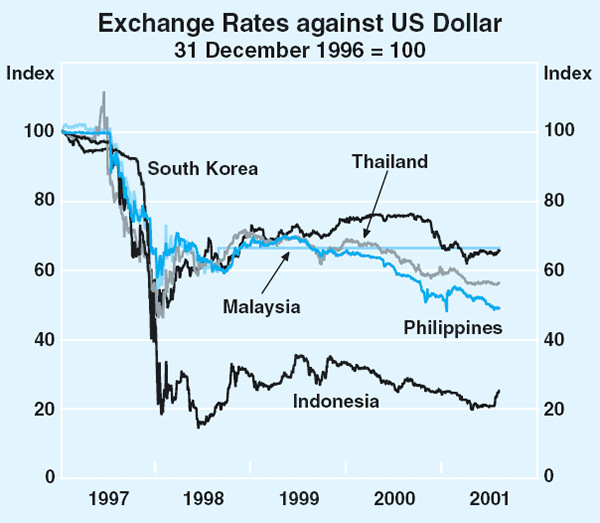
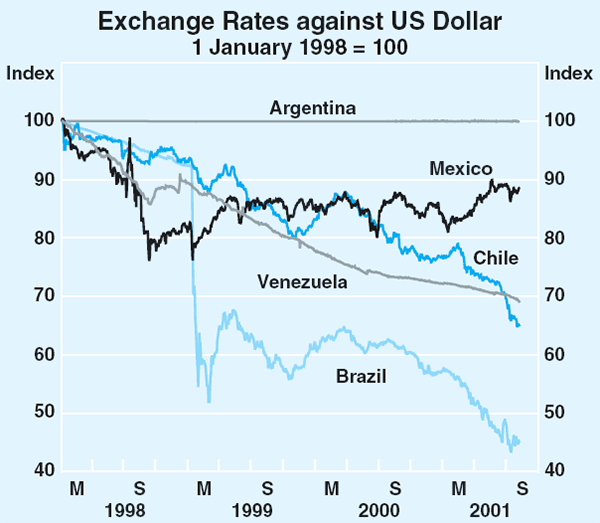
Currencies of those emerging market economies that float have generally fallen significantly against the US dollar so far in 2001, with the largest decline being a 21 per cent fall recorded by Brazil, largely in response to the ongoing difficulties of its largest trading partner Argentina. The Chilean peso has also declined, by around 15 per cent, while the Thai baht has fallen 7 per cent (Graphs 25 and 26).
Australian dollar
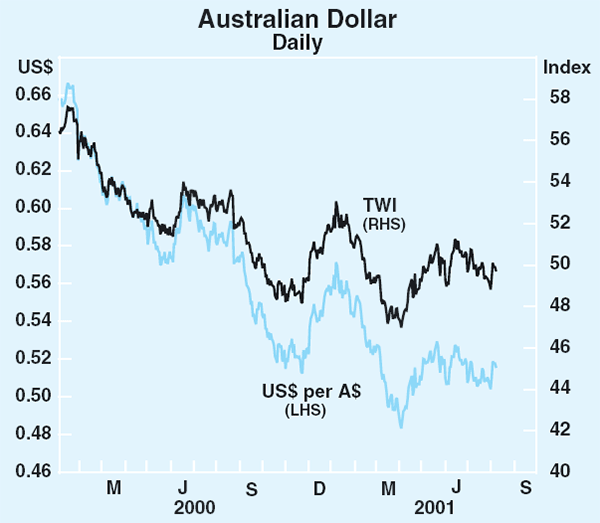
Since the start of 2001, the Australian dollar has fallen by 7 per cent against the US dollar (Graph 27, Table 4). There have been three phases in the exchange rate during this period:
| TWI | −4 |
|---|---|
| US dollar | −7 |
| Euro | −1 |
| Swiss franc | −2 |
| Swedish krona | 2 |
| Yen | 0 |
| Pound sterling | −2 |
| New Zealand dollar | −2 |
| Canadian dollar | −5 |
- a sharp fall during the March quarter as sentiment about domestic economic activity deteriorated rapidly, particularly after the release of the unexpectedly weak national accounts figures for the December quarter;
- a partial recovery over April and May as domestic economic data turned stronger; and
- a relatively stable period since. While most domestic economic data have continued to improve during this latest period, deepening concern in world markets about the global outlook, and an associated weakening in commodity prices, have served to limit the recovery in the Australian dollar. The current exchange rate is 8 per cent above the early April low of US47.75 cents.
It can also be seen from the graph that the trade-weighted index, while following the same general pattern as the rate against the US dollar, has fallen considerably less. In net terms for the year, the TWI is down by only about half the fall in the US dollar rate. This continues a pattern that has been evident since 1997, and is to a large extent due to US dollar strength depressing our exchange rate against it.
Our exchange rate against other currencies has not fallen as much as against the US dollar. In fact, in the period since 1997, there has been little net change, on average, in our exchange rate against major currencies apart from the US dollar and the yen (Graph 28). Against a group of currencies comprising the euro, pound, Swiss franc, Canadian dollar, New Zealand dollar and Swedish krona, the Australian dollar's average exchange rate remains close to its decade average.
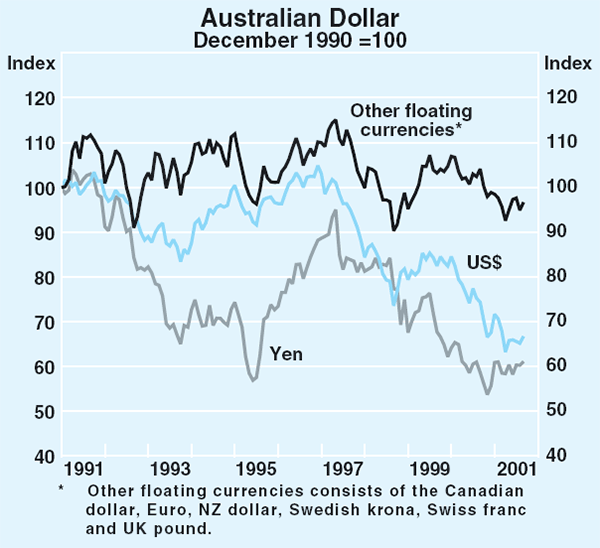
Because the US dollar is moving independently against most other major floating currencies, the exchange rates of these currencies against the US dollar are showing a high degree of correlation with each other. The Australian dollar's close correlation with the euro over the past couple of years has been much discussed, but the Australian dollar's correlation with other currencies has also increased.
Rising interest differentials relative to the US have been supporting the currency, as they have contributed to a noticeable increase in demand for Australian debt instruments, not only from the US and Europe, but also from Japan. The fact that the Australian dollar's exchange rate against the yen has been relatively steady over the past 12–18 months is adding to Japanese investor confidence in Australian dollar investments. These flows are not yet reflected in capital flow data, which for the most part only extend to the end of 2000. (Capital flows in recent years are described in Box A).
The Bank has intervened in the foreign exchange market on a number of occasions this year, most recently in July when it bought A$297 million to support the currency. This took intervention in the year to date to $1.3 billion, still a relatively small amount. Transactions with the Commonwealth Government (in 2001 to date) resulted in sales of foreign currency equivalent to A$2.6 billion which were largely offset by interest received on the Bank's holdings of foreign securities and transactions with other institutions, so that the impact on net reserves was limited to that coming from intervention operations.
Box A: Composition of Capital Flows in 2000
This Box summarises recent data on capital flows into and out of Australia.
Capital flows can be disaggregated in various ways. Graph A1 breaks the flows down into three main types: equity flows; bond flows (mainly government bonds); and flows channelled through the banking system and money market. For each category the flows are shown in net terms – i.e. the difference between inflows and outflows. The data are also smoothed to some extent by showing four quarter moving totals.
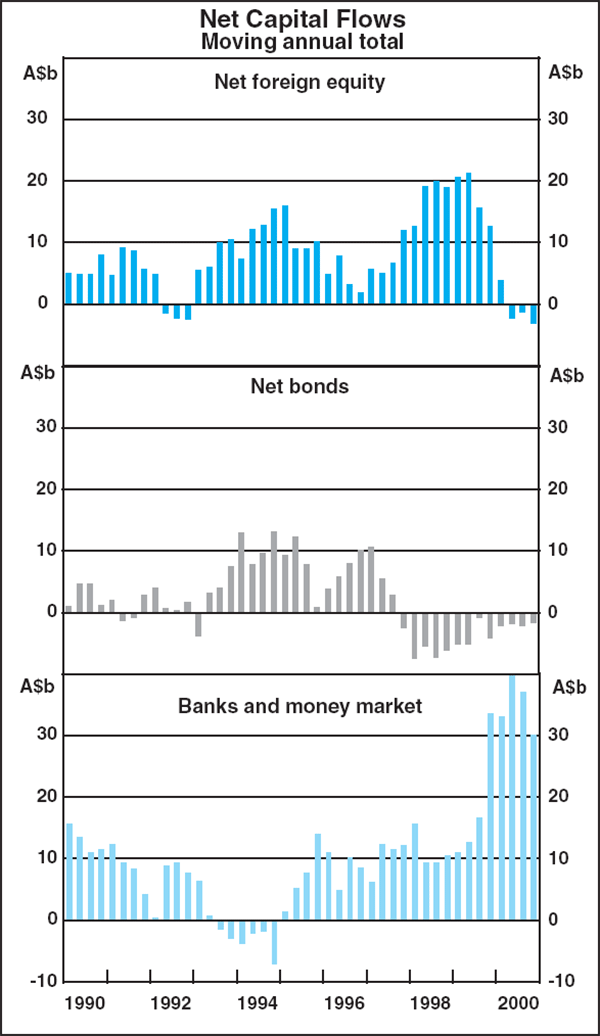
The main points that can be observed from the graph are as follows:
- net equity flows fell away sharply during 2000 after being quite strong through 1998 and 1999;
- bond flows have been negative since 1997. This is the period when bond yield differentials relative to the US narrowed very sharply; and
- inflows through banks and the money market have increased strongly. These flows incorporate overseas borrowings by banks, which are on-lent to Australian households and businesses, as well as purchases of Australian corporate short-term debt by foreigners. It is important to note that the foreign borrowings by banks are either directly in Australian dollars or hedged back to Australian dollars. Banks use foreign borrowings as a way of diversifying their funding base, not to take on currency risk.
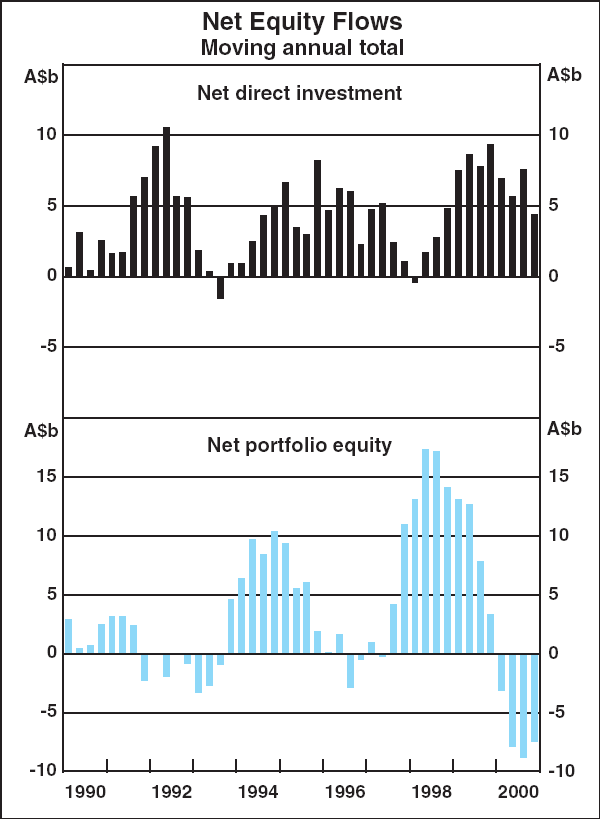
Equity flows can be disaggregated further, into direct investment (i.e. investment in Australian companies by overseas companies) and portfolio investment (essentially investment through share markets by funds managers and other institutions). This disaggregation is shown in Graph A2, and highlights that the decline of equity inflows into Australia last year was almost entirely due to swings in portfolio equity. Net direct investment has remained strong – i.e. overseas companies are continuing to find attractive investment opportunities in Australia.
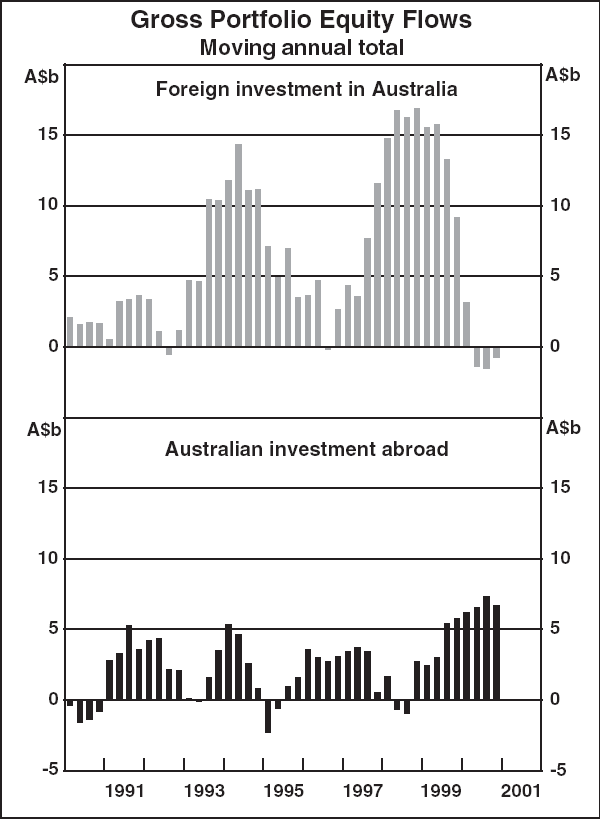
Net portfolio equity flows can, in turn, be disaggregated further, into investment by foreigners into Australian shares and investment by Australians into foreign shares (Graph A3). This shows that the net outflows of portfolio equity investment in 2000 occurred because foreigners stopped investing into Australian shares (and in fact reduced their holdings of shares) while Australians increased their purchases of foreign shares.
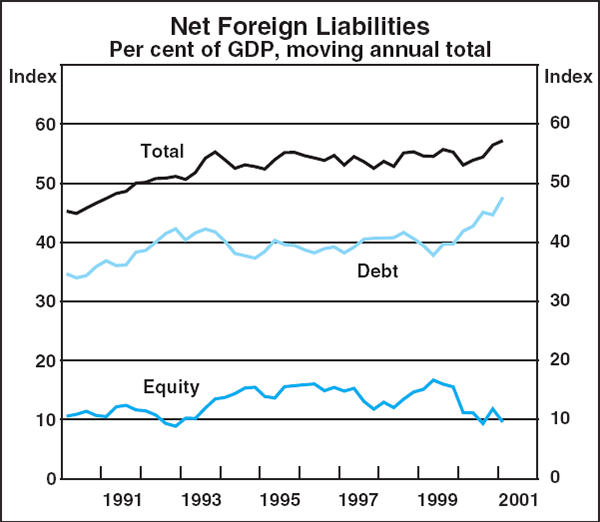
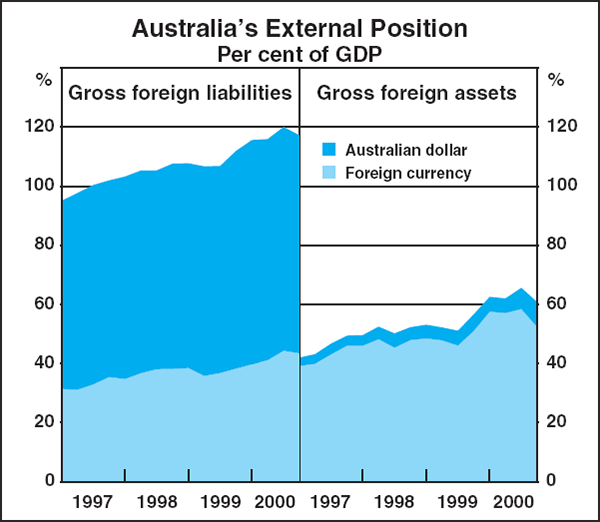
These changes in the composition of capital flows have been reflected in the outstanding claims that foreigners have on Australia. As a proportion of GDP, net foreign liabilities have not changed much over recent years, at around 55 per cent, but there has been a shift away from equity to debt over the past couple of years (Graph A4).
The currency composition of Australia's foreign assets and liabilities can be seen in Graph A5. It shows that Australia's net foreign liabilities are not reflected in a foreign currency exposure. Australia has more foreign-currency assets than liabilities, as most liabilities to foreigners are in Australian dollars.
Domestic Economic Activity
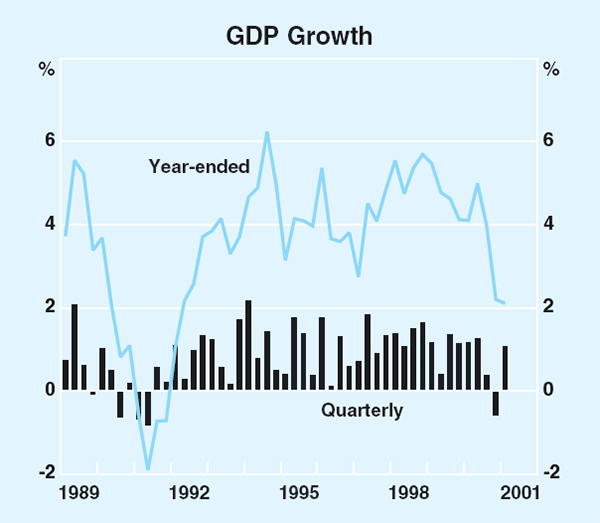
The Australian economy recovered in the first half of 2001 after a small contraction in the second half of 2000. According to the latest national accounts, real GDP rose by 1.1 per cent in the March quarter, to be around 2 per cent higher over the year (Table 5, Graph 29). An important factor behind this was that falls in dwelling investment, which had been exceptionally large in the two quarters following the introduction of the new tax system in the middle of 2000, abated. According to the national accounts, businesses ran down inventories built up over the second half of 2000, with the stock rundown subtracting nearly 2 percentage points from GDP growth in the March quarter. But this was more than offset by a large increase in consumption and a substantial contribution from net exports. The improvement in growth in the March quarter was evident across all states, although growth over the year remains relatively subdued in both New South Wales and Queensland.
| Six months to: | March quarter 2001 |
||
|---|---|---|---|
| June quarter 2000 |
December quarter 2000 |
||
| Private final demand(a) | 3.2 | −2.7 | 2.1 |
| Consumption | 1.5 | 0.8 | 2.2 |
| Dwelling investment | 18.0 | −34.4 | 0.8 |
| Business investment(a) | 4.9 | −1.7 | 2.0 |
| Public final demand(a) | −1.8 | 1.0 | 2.7 |
| Domestic final demand | 2.1 | −1.9 | 2.3 |
| Change in inventories(b) | −0.3 | 1.2 | −1.9 |
| Exports | 4.5 | 1.3 | 0.5 |
| Imports | 3.2 | −2.2 | −3.3 |
| Net exports(b) | 0.2 | 0.8 | 0.8 |
| Gross domestic product | 2.4 | −0.2 | 1.1 |
| (a) Excluding transfers between the public and private sectors (b) Contribution to GDP growth |
|||
Recent indicators suggest that the economic rebound has continued. Consumer spending has picked up and there is evidence of an improvement in business confidence, aided by more accommodative monetary policy settings. The weakness of the labour market poses a risk to consumer spending, although the forward indicators of labour market conditions appear to be stabilising. The strong turnaround in most of the leading indicators of housing activity suggests a robust recovery in the housing sector is in train. This should have a positive flow-on in the second half of the year to those industries adversely affected by the sharp slowing in the construction industry. While businesses may still be holding unwanted inventories, which could slow the recovery in production, a significant part of the adjustment has probably already occurred. Capital spending by businesses has been weak, but firms are expected to boost investment spending in 2001/02.
In contrast to the fairly favourable developments on the domestic front, the international environment will be much less supportive of growth over the year ahead than it has been over the past couple of years. Weaker demand for Australia's exports, coupled with stronger domestic demand for imports, are likely to reduce the contribution to growth from the external sector, although this should be offset to some extent by the competitive effect of the lower exchange rate.
Household consumption
Consumption increased strongly in the March quarter, following two softer quarters, and was nearly 4 per cent higher over the year. Retail sales data suggest that this strength continued into the June quarter as sales rose by 1 per cent in volume terms. Consumption of services has exhibited the strongest growth over the past year, in spite of the relatively greater increase in the price of most services over this time. The strength has been particularly noticeable in the areas of health and insurance and financial services. Expenditure in both of these areas has been boosted by the increase in private health insurance coverage. According to the Private Health Insurance Administration Council, 45 per cent of the population was covered by private hospital insurance at the end of March 2001, compared with around 30 per cent prior to the introduction of the health insurance rebate at the beginning of 1999. This has resulted in an increase in household spending on private-sector health services, as well as an increase in insurance premiums (net of claims) being paid to health insurers. Growth in the consumption of insurance and financial services has also been supported over the past couple of years by strong growth in financial intermediation and superannuation.
The consumption of goods, in contrast, was weaker over the first half of 2001, with only sales of furnishings and clothing and footwear enjoying strong growth. There was some evidence of discounting by clothing retailers in the early part of the year in an effort to rundown large inventories. Motor vehicle sales, after rising strongly following the tax-related price falls in the middle of 2000, have subsequently fallen. Higher prices have contributed to the decline, with motor vehicle prices, as measured in the CPI, having reversed all of last year's tax-related fall by the June 2001 quarter.
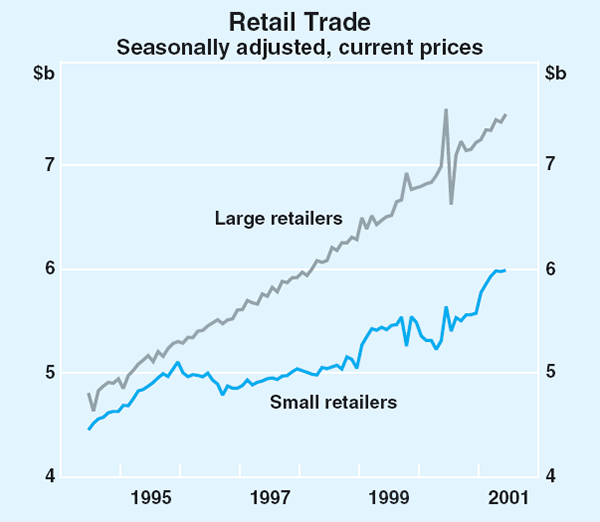
Assessing the trend in retail sales over the past couple of years has been complicated by the disparate movements in sales recorded by small and large retailers. Sales by small retailers grew at an annual rate of 15 per cent over the six months to June, around double the rate recorded by the group of large retailers, whose sales tend to grow at fairly steady rates (Graph 30). This contrasts with conditions in the same period last year, when small retailers recorded rates of growth less than half that of the large retailers. Some of the difference may relate to the impact of sample rotation of small retailers that occurs in the first month of each quarter (the large retailers are fully enumerated) and appears, at times, to have led to discrete changes in the level of sales recorded for small retailers.
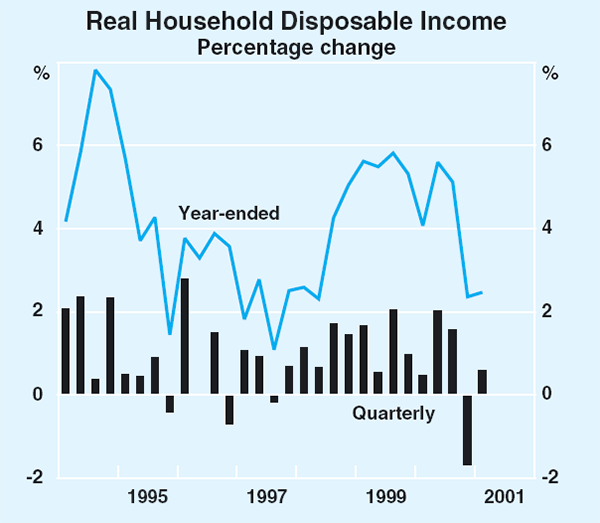
Real household disposable income rose in the March quarter to be 2½ per cent higher over the year (Graph 31). Real household spending is likely to have been boosted in the first half of 2001 by a fall in retail petrol prices and a decline in the household interest burden. According to the Australian Institute of Petroleum, retail petrol prices increased by 23 per cent over 2000. Over the past couple of months, however, retail petrol prices have fallen by more than 10 per cent.
The household interest burden eased in the first half of 2001, notwithstanding the continued strong growth in household debt. The lowering of official interest rates in the March quarter resulted in household interest paid decreasing by 0.3 of a percentage point in the quarter, to be around 7½ per cent of household disposable income. It probably declined further in the June quarter, as the reduction in official interest rates over the first half of the year was reflected more fully in lending interest rates. Household debt grew strongly over the first half of the year, increasing at an annual rate of around 14 per cent. Moreover, the recent strength in loan approvals data suggests that growth in lending for housing will increase further in coming months. Personal credit growth has moderated a little, though it remains solid, driven by strong increases in credit card and overdraft lending. Household loans in arrears have remained at low levels.
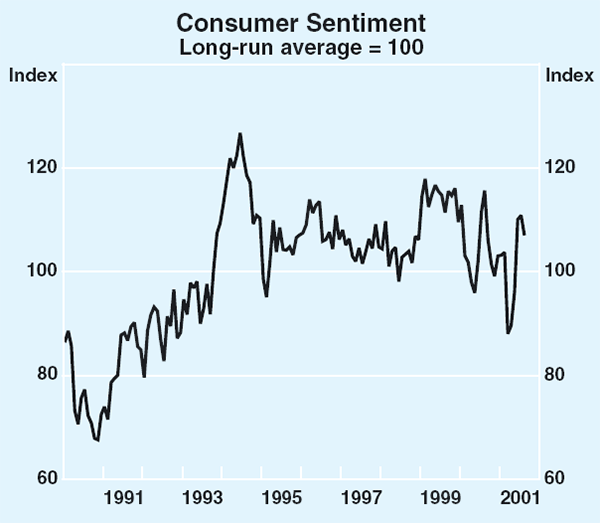
Consumer sentiment, as measured by the Westpac-Melbourne Institute, has rebounded and is now above its long-run average (Graph 32). During the first half of 2001, this measure of consumer sentiment was particularly volatile, with the timing of the swings being closely related to the release of economic news. The sharp fall in sentiment in March followed the release of the weaker-than-expected December quarter national accounts, while the strong rebound in June followed the release of the stronger-than-expected March quarter national accounts. If the recent rise in confidence is sustained, it should be supportive of growth in consumption.
In the March quarter, the value of household assets is estimated to have risen by just over 1 per cent, to be 2½ per cent higher over the year (Table 6). Dwelling prices rose in the quarter, while the value of household financial assets was unchanged. The value of household assets probably rose further in the June quarter as domestic share prices rose by around 11 per cent in the quarter. The increase in the value of household assets over the past year is relatively small by the standards of the annual growth rates recorded in the latter part of the 1990s. Nevertheless, as a result of these earlier gains, wealth is substantially higher, relative to current income, than historical norms.
| Level at March 2001 $b |
Share of total assets Per cent |
Year-ended growth (per cent) |
||
|---|---|---|---|---|
| Average 1996–99 |
March 2001 |
|||
| Non-financial assets | 1,755 | 59.7 | 14.0 | 1.7 |
| – Dwellings | 1,626 | 55.3 | 15.0 | 1.5 |
| – Consumer durables | 128 | 4.4 | 3.2 | 4.7 |
| Financial assets | 1,186 | 40.3 | 10.3 | 3.9 |
| – Currency and deposits | 265 | 9.0 | 5.1 | 8.0 |
| – Equities and unit trusts | 232 | 7.9 | 25.5 | 5.0 |
| – Superannuation and life offices | 619 | 21.1 | 10.1 | 2.9 |
| – Other | 70 | 2.4 | −1.4 | −4.3 |
| Total assets | 2,940 | 100.0 | 12.5 | 2.6 |
Dwelling investment
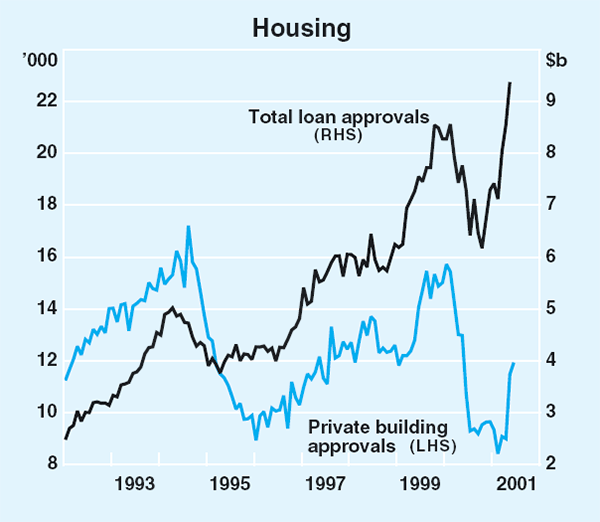
A recovery appears to be underway in the housing market, supported by increased affordability and government incentives. Dwelling investment recorded modest growth in the March quarter, following exceptionally large falls in the two preceding quarters, which subtracted about 2¼ percentage points from growth in GDP. The leading indicators of housing activity suggest a robust recovery in the second half of the year. The value of housing loan approvals has increased by about 50 per cent since its low point in October 2000, and now exceeds the previous peak in February 2000 (Graph 33). Loans for existing dwellings are now well above previous peaks, and this appears to be flowing through to construction. Loans for construction have recovered most of last year's fall and building approvals rebounded sharply in May and improved further in June.
The Commonwealth Government's First Home Owner Grant (FHOG) scheme has had a positive influence on the housing market. The impact of the grant, which was enhanced for new home buyers in March, is evident in an increase in the proportion of first home buyers receiving housing finance, as well as a reduction in the average value of building approvals in the three months following the extension of the scheme. Information provided by various State Revenue Offices indicates that, following the extension of the scheme, the number of grants paid rose strongly in May and increased further in June. While the FHOG has provided stimulus to the housing sector in all states, its effect appears to have been disproportionately large in the smaller states, where median house prices are lower than in the two largest states.
The speed of the housing recovery has, however, been impeded in some states by the collapse of HIH Insurance and the subsequent delays in the re-issuing of insurance to builders previously insured by HIH. These delays were due to the volume of applications, the limited number of alternative insurers – in most states there are only two or three alternative providers of builders' warranty insurance – and tighter financial criteria that these new insurers are applying to some builders. Delays, which in some cases have been several months, appear to have been most pronounced in New South Wales due to the large number of former HIH policy-holders in that state; delays elsewhere appear to be largely abating. The delays in processing building approvals may have postponed some dwelling activity which otherwise would have occurred in the June quarter until the second half of the year.
The recovery in the housing market has been reflected in rising house prices. According to ABS and REIA data, house prices in capital cities increased by around 2 per cent in the March quarter and by 7 per cent over the year. House prices in Melbourne and Canberra have recorded the largest increases over the year, rising by more than 10 per cent, while growth in house prices in Sydney and Hobart has been relatively subdued.
The business sector
Experience among different industries has varied considerably. Output of the construction industry, which fell by 24 per cent over the second half of 2000, rose in the March quarter, reflecting the modest recovery in the residential market. The flow-on effects of earlier sharp falls in construction activity, however, continue to hamper other industries, particularly manufacturing, where output fell further in the March quarter. In contrast, service industries continued to perform well, particularly property and business services, finance and insurance, and communication services. Growth in these industries has cushioned the effects of weakness in construction and related activity, though these industries may experience slower growth over the remainder of the year, reflecting weaker global conditions (particularly in the IT sector) and increased familiarity with the new tax system.
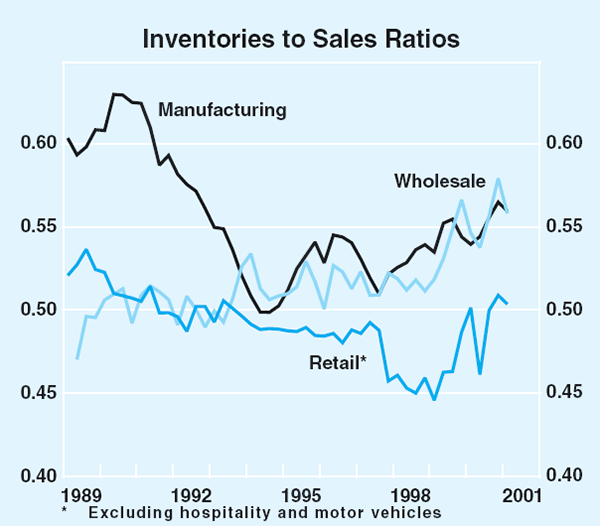
Aggregate demand for goods rose above production in the March quarter, enabling firms to unwind some of the inventories accumulated over the second half of 2000. A sizeable rundown of inventories was reported by the manufacturing, wholesale and retail trade industries in the March quarter. In aggregate, the turnaround in inventory accumulation subtracted almost 2 percentage points from growth in GDP in the quarter. Nevertheless, inventory-to-sales ratios at the industry level suggest that further falls in inventories are in prospect (Graph 34). This is consistent with a number of business surveys, which suggest a further reduction in stocks in the June quarter, particularly in the retail industry.
There are some signs of a recovery in business sentiment, though the improvement to date has mostly been confined to expectations of future conditions rather than the assessment of actual business conditions. The latest quarterly survey conducted by NAB reported a further fall in actual business conditions in the June quarter (Graph 35). While well above the lows recorded in the early 1990s recession, they remain below levels recorded in the mid-1990s slowdown. Consistent with subdued output growth over the past year, the weakest business conditions were reported by the construction industry and some parts of the manufacturing and retail industries. Business confidence about the September quarter, however, has rebounded and is now above its long-run average. Other business surveys, such as the ACCI-Westpac survey of manufacturing and the Dun and Bradstreet survey of the manufacturing, wholesale and retail sectors, provide similar results. The Yellow Pages survey of smaller businesses continues to report weaker conditions and less optimism about the future. This is likely to be due to the large share of small businesses in the construction and related industries.
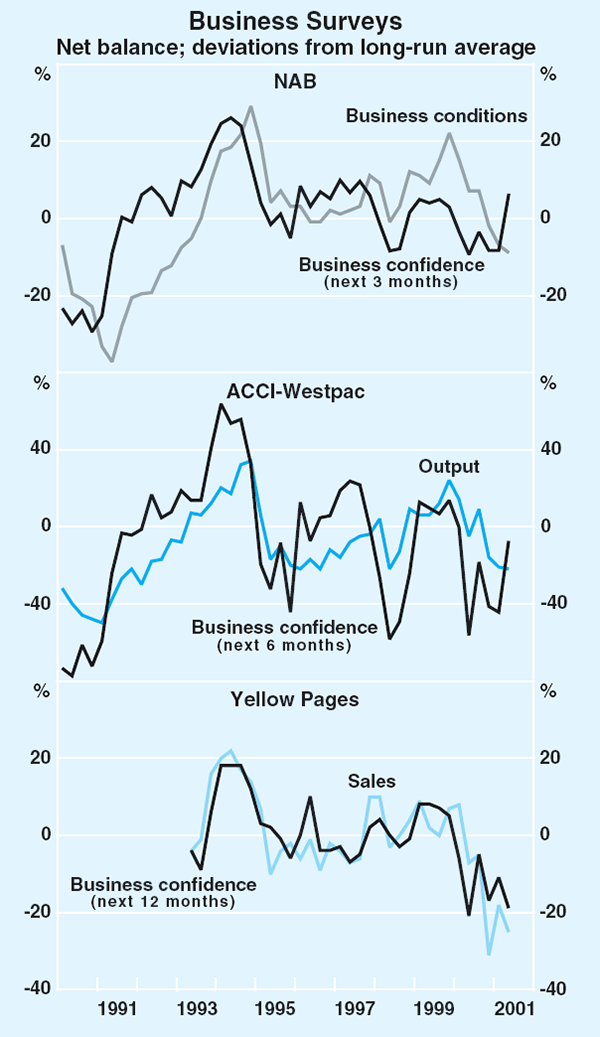
Most of the quarterly survey responses were received before the release of the March quarter national accounts in June. There is evidence from the monthly surveys that the better-than-expected outcome has resulted in a more favourable assessment by the business sector of the outlook. The reduction in official interest rates and signs of a recovery in the construction industry may also explain some of the improvement.
Business investment has been relatively subdued over the past couple of years and, as a share of GDP, is around its average over the last 15 years (Graph 36). Business investment increased by 2 per cent in the March quarter, underpinned by growth in each of the major asset components, but is only slightly higher over the past year. One of the brighter spots has been mining investment. Underpinned by buoyant profitability and high commodity prices in Australian dollar terms, investment by the mining industry again rose significantly in the March quarter, suggesting that the two-year decline in mining investment may have come to an end.
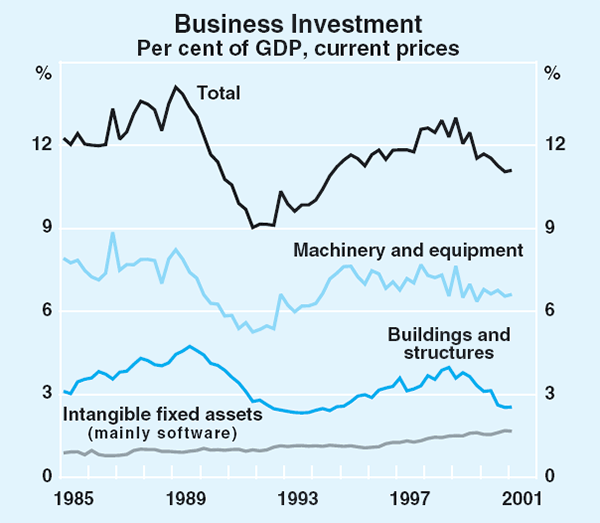
According to the March quarter ABS capital expenditure (Capex) survey, the outlook for machinery and equipment expenditure remained quite positive, despite the uncertain global economic outlook and low level of business sentiment. Growth in nominal terms was expected to be around 8½ per cent in 2001/02, implying similar growth in real terms as the effect of the exchange rate depreciation has tended to offset the trend decline in machinery and equipment prices. While much of this growth was expected to occur in the mining sector, investment by the property and business services and utilities industries was also expected to contribute significantly. Business expenditure on motor vehicles, which represents around one-quarter of investment in machinery and equipment, should be boosted this year by the Government's decision to introduce more favourable tax treatment for business purchases of motor vehicles from 23 May, although the positive impact of this change will be partially offset by the recent increase in motor vehicle prices.
The outlook for expenditure on buildings and structures, which as a share of GDP is only slightly above its early 1990s lows, has improved, with indicators suggesting a build-up of projects that will commence in the second half of 2001. Non-residential building approvals rose strongly in the June quarter, though they are only slightly above levels recorded a year ago. The increase in the quarter was broadly based across shops, factories, offices and warehouses, which comprise around two-thirds of non-residential building activity. The Jones Lang LaSalle survey indicates some softening of conditions in CBD office property markets, but data from the Property Council of Australia suggest a continued fall in vacancy rates. The positive outlook for buildings and structures is supported by the Capex survey, which reported a substantial increase in expenditure intentions for 2001/02, and the Access Economics Investment Monitor. Particularly strong increases have been recorded in the mining and transport and storage sectors.
Expenditure on intangible fixed assets rose modestly in the March quarter, well down from the robust pace of growth of recent years. Expenditure on mineral and petroleum exploration accounted for much of the increase. In contrast, expenditure on computer software (around 80 per cent of intangible fixed investment) fell slightly, its first quarterly fall since 1995.
Corporate sector profits, as measured by GOS, grew strongly in the March quarter, retracing much of the previous quarter's fall. Profits as a share of GDP remained slightly above their average for the past decade (Graph 37). Around half of the growth in profits in the March quarter (excluding abnormals such as foreign exchange gains and losses) was due to the continued strong profitability of the mining sector, which has benefited from stronger output and the high level of commodity prices in Australian dollar terms. A number of larger corporates have recently announced earnings downgrades for the first half of this year, suggesting that profit growth may be weaker in the June quarter.
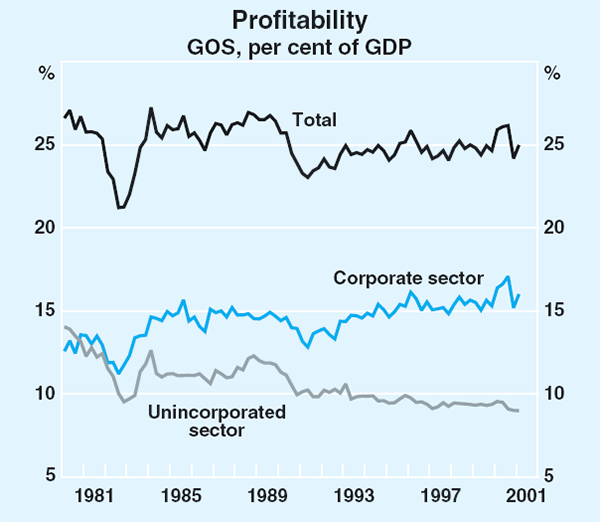
Small business profitability, as measured by the GOS of unincorporated enterprises, grew by just over 2 per cent in the March quarter, but remained flat over the year. The recovery in the March quarter probably reflects stronger retail sales and the modest turnaround in the construction industry (sectors where small businesses are well represented). The Yellow Pages survey of smaller businesses, however, suggests that profitability in the June quarter was weak.
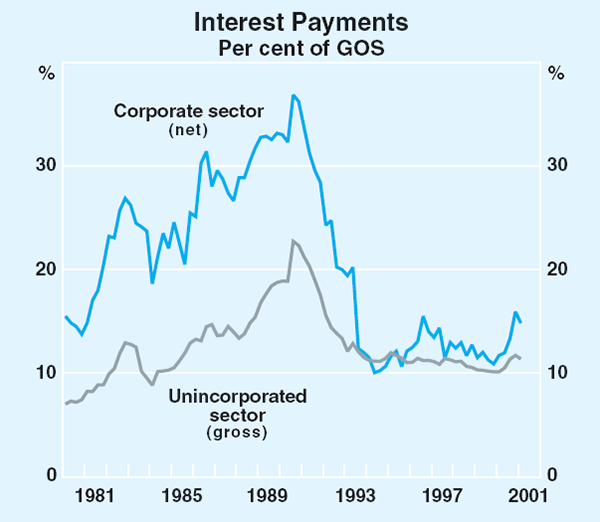
While the outlook for investment is positive, relatively weak investment expenditure in the first half of the year is consistent with subdued growth in external financing by the business sector. Business credit grew by around 6 per cent on an annualised basis over the six months to June, well down from the pace of around 13 per cent in mid 2000. Non-intermediated debt and equity raisings in the first half of 2001 were well down on the previous year. With debt raisings outpacing equity raisings, the corporate debt to equity ratio (based on book values) continued to move higher in the March quarter, although it is still considerably below the levels reached in the early 1990s. The debt-servicing burden of corporates eased slightly in the March quarter due to the easing in monetary policy and growth in corporate profits (Graph 38).
Commonwealth budget
The Commonwealth Government announced its 2001/02 budget in May. The Commonwealth budget recorded an underlying cash surplus of $2.3 billion in 2000/01, which is expected to decline to $1.5 billion in 2001/02 (Table 7). New policy decisions taken since the release of the Government's Mid-Year Economic and Fiscal Outlook (MYEFO) included increased spending on defence, the Government's innovation package, welfare reform and roads, as well as the removal of indexation on petrol, which has reduced projected revenues.
| 1999/00 | 2000/01 | 2001/02 | 2002/03 | |
|---|---|---|---|---|
| MYEFO (November 2000) | 12,671 | 4,329 | 4,738 | 7,560 |
| (2.0) | (0.6) | (0.7) | (1.0) | |
| Budget (May 2001) | 12,671 | 2,253 | 1,520 | 1,063 |
| (2.0) | (0.3) | (0.2) | (0.1) |
The Commonwealth budget had an expansionary impact on growth in 2000/01. Using the change in the surplus between fiscal years as a rough guide, the revised surplus in 2000/01 was more than 1½ per cent of GDP lower than in the previous financial year. In 2001/02, the fiscal position is estimated to remain broadly neutral. In aggregate, the states probably provided some fiscal stimulus in 2000/01, though the stance is expected to be slightly contractionary in 2001/02.
The labour market
Employment data have been volatile of late. However, the increase in the number of unemployed, the concentration of employment growth in part-time jobs and the low level of job vacancies suggest that conditions in the labour market remain weak. Employment increased by 0.3 per cent in the June quarter to be a little over 1 per cent higher than a year ago but fell in July (Graph 39). Growth over the past year has been confined to part-time employment, with the number of persons employed on a full-time basis falling. This trend may in part reflect a decline in hours worked by some workers previously classified as full-time to below the 35 hour a week threshold used by the ABS. The unemployment rate continued to rise in the June quarter, averaging 6.9 per cent, compared with 6.5 per cent in the previous quarter, and remained at 6.9 per cent in July.
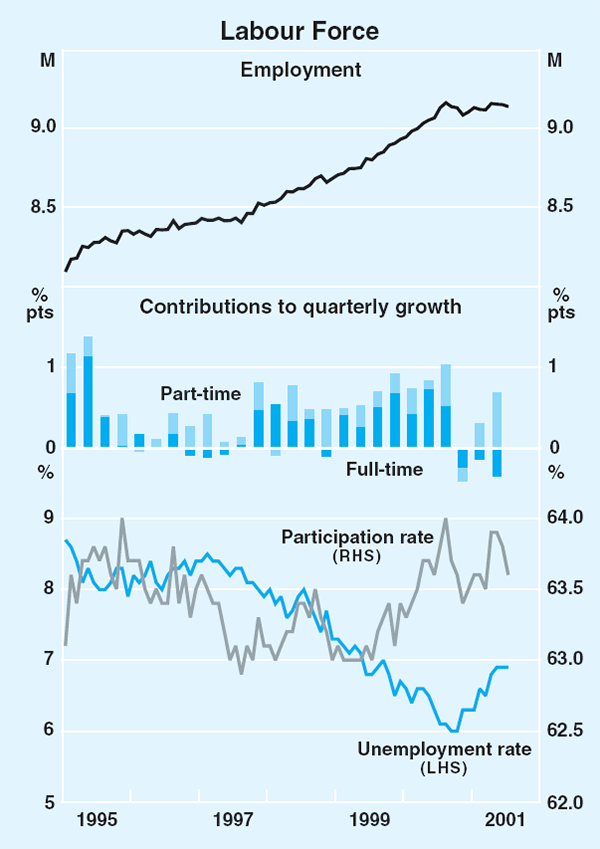
The weakness in the labour market since its peak in the September quarter has been mainly in the cyclically sensitive sectors. In the most recent period, employment in retail trade rose strongly, consistent with the recent strength in retail spending, while employment in the property and business services sector fell (though employment in this sector was still 4 per cent higher over the year to May). Robust growth in public-sector employment over the past year has been largely driven by rising employment in health and community services.
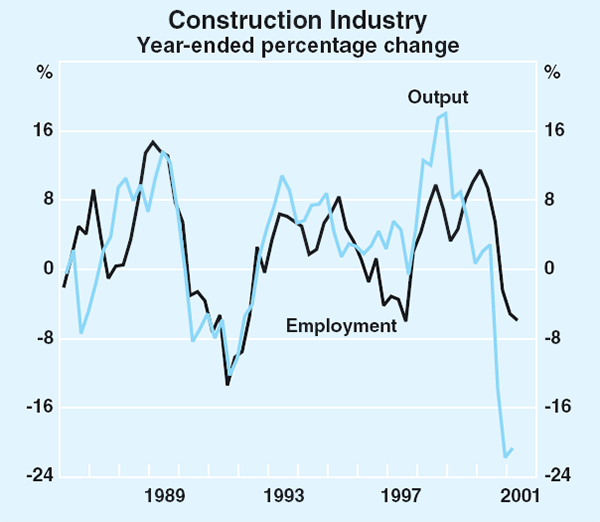
Employment in construction has shown surprising resilience over the past six months, falling by less than 50,000, or around 6 per cent, since the peak last August. In contrast, output of the construction industry has fallen by more than 20 per cent since mid 2000 (Graph 40). As a result, measured productivity of the sector has recorded a very large decline. Some labour hoarding may have occurred in anticipation of a recovery in the sector, but work done and hours worked by construction companies may have also been particularly difficult to measure accurately around the middle of 2000. Moreover, the historical relationship between output and employment appears to have diverged somewhat earlier, in 1998/99, with output in the industry rising much more strongly than employment at that time.
Output per hour worked in the non-farm economy, a measure of overall labour productivity, slowed over the course of 2000. A period of negligible productivity growth was also recorded during the course of the mid-1990s slowdown, before productivity began to grow relatively quickly as the expansion continued. In recent quarters productivity has increased by around 2½ per cent on an annualised basis, reflecting the sharp decline in hours worked towards the end of 2000 and the rebound in output growth in the March quarter.
The labour market weakened to varying degrees in every state over the first half of the year (Table 8). Accordingly, most state unemployment rates have increased from their most recent trough, with pronounced increases recorded in Western Australia and Queensland. In contrast, the Victorian labour market has so far been more resilient than that of the other states, as it has been less affected by the downturn in the construction industry. Consistent with the relative strength of the labour market and the economy more generally in recent years, Victoria has been experiencing inflows of interstate migrants for the first time in many decades (see Box B on Interstate Migration).
| Employment | Unemployment Rate | |||
|---|---|---|---|---|
| Change over year |
Level | Change from most recent quarterly trough |
||
| Per cent | Per cent | Percentage points | ||
| NSW | 0.6 | 5.9 | 0.7 | |
| Victoria | 2.6 | 6.3 | 0.4 | |
| Qld | 0.7 | 8.9 | 1.6 | |
| WA | 1.1 | 7.5 | 1.6 | |
| SA | −0.1 | 7.5 | 0.5 | |
| Tasmania | −0.1 | 8.6 | 0.0 | |
| Australia | 1.1 | 6.9 | 0.8 | |
Forward-looking indicators of labour demand provide a somewhat mixed picture of prospects for the labour market over the near term (Graph 41). The two measures of newspaper job advertisements appear to have steadied at around levels recorded in the mid 1990s. The ANZ Bank newspaper job advertisements series fell by 4 per cent in the three months to July and is 34 per cent lower than a year earlier. The more volatile index of skilled vacancies compiled by the Department of Employment, Workplace Relations and Small Business (DEWRSB) fell by 1 per cent in the three months to July, but is 24 per cent lower than levels recorded a year ago. Both measures suggest that employment is unlikely to grow to any appreciable extent over the remainder of this calendar year. The decline of just under 20 per cent in the ABS employer-based measure of job vacancies over the year to the three months to May was less than the declines in the newspaper-based vacancies series recorded over the same period. This may reflect an overstatement of the decline in construction vacancies in the newspaper-based measures of vacancies – the DEWRSB vacancy series fell by around 80 per cent over the year to the June quarter, compared with a decline of 23 per cent in the ABS series – as well as the increasing popularity of the Internet as a job-matching medium (notwithstanding the sharp decline in vacancies advertised on the Internet in recent months).
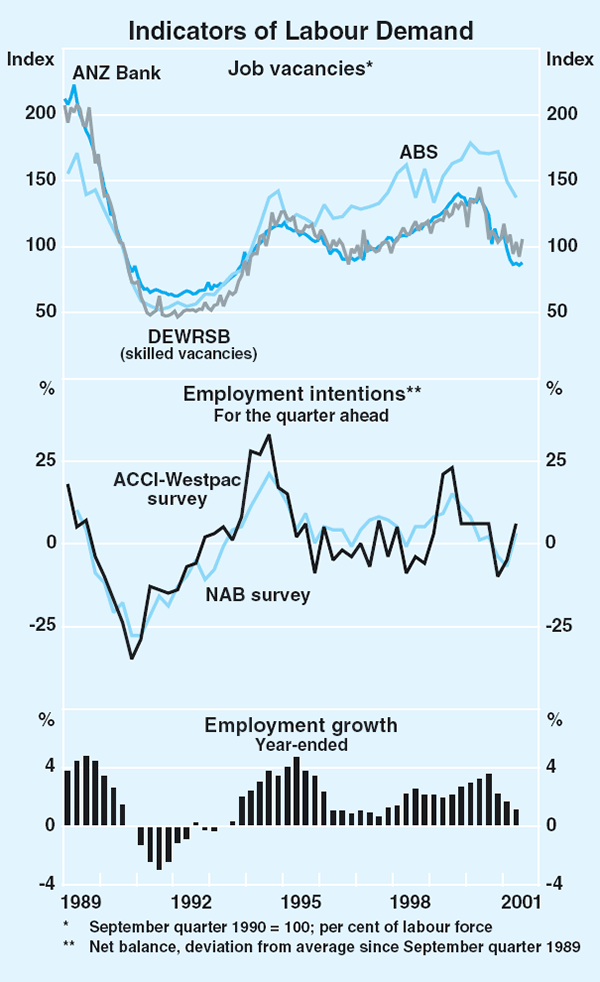
In contrast to the indications provided by the various measures of vacancies, the major business expectations surveys point to some improvement in the outlook for the labour market. The latest quarterly NAB survey reported that employment intentions for the September quarter 2001 rose sharply. Further improvements in employment intentions of manufacturers were also reported in the June quarter ACCI-Westpac survey and the Dun and Bradstreet survey of manufacturing, retail and wholesale firms.
Box B: Interstate Migration
Over the past decade, there has been a divergence in population growth among the Australian states. Table B1 shows the sources of population growth in each of the states over the past decade. Over this period, the bulk of population growth in most states has been attributable to natural population increase. Overseas migration has tended to be an important source of population increase in NSW and Victoria – since these states are the main points of entry for migrants – and in Western Australia.
| NSW | Victoria | Queensland | Western Australia |
South Australia |
Tasmania | |
|---|---|---|---|---|---|---|
| Natural increase | 0.7 | 0.7 | 0.8 | 0.9 | 0.5 | 0.6 |
| Overseas migration | 0.6 | 0.5 | 0.3 | 0.6 | 0.2 | 0.1 |
| Interstate migration | −0.3 | −0.2 | 1.0 | 0.1 | −0.2 | −0.4 |
| Total | 1.0 | 0.9 | 2.1 | 1.6 | 0.5 | 0.3 |
|
Source: Australian Demographic Statistics, ABS Cat No 3101.0, Table 2. |
||||||
Interstate migration has been a significant driver of differences in population growth between the states. Since 1990, Queensland and, to a lesser extent, Western Australia have consistently recorded net inflows of residents from other states, contributing to above-average rates of population growth. NSW and Victoria have traditionally recorded a net outflow of residents to other states, which may partly reflect overseas immigrants who ultimately relocate in other states. In contrast, the net outflow of residents from South Australia and Tasmania has been associated with lower levels of population growth.
This pattern has been broadly stable over the past decade, though there have been some noteworthy developments in the past few years (Graph B1). For much of the decade Victoria experienced a net outflow of interstate migrants, with a particularly large and protracted outflow occurring following the early-1990s recession. Since 1998, however, Victoria has been a net recipient of residents from interstate. This is the first time in nearly fifty years that such an inflow has occurred. Furthermore, in Queensland in the past few years, interstate migration has been making its smallest contribution to population growth for more than a decade.
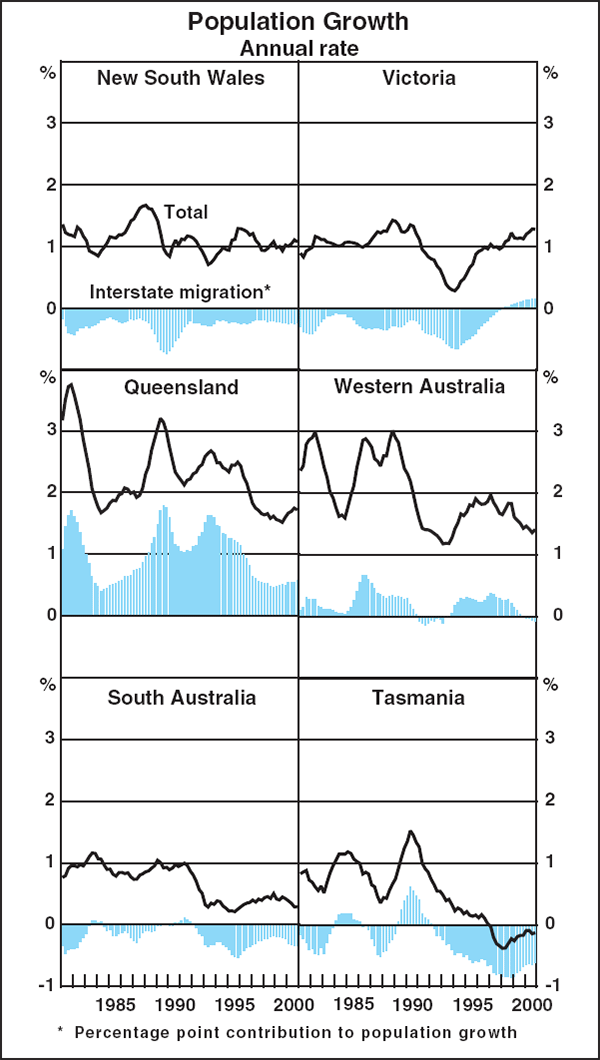
While many non-economic factors influence migration flows, economic conditions are an important consideration in the decision to relocate. Consequently, differences in rates of interstate migration can be associated with differences in actual or expected economic conditions between states. In the current environment, net inflows of residents to Victoria are consistent with relatively favourable labour market conditions in that state and greater underlying strength in housing activity.
Balance of Payments
Australia's exports have held up relatively well in the face of slowing world growth, underpinned by the competitiveness of the exchange rate as well as positive developments in key commodity markets. In contrast, the low level of the dollar and weaker domestic demand have dampened import growth. These factors resulted in the external sector contributing three-quarters of a percentage point to output growth in the March quarter and more than two percentage points to growth over the year. Despite a slight deterioration in the terms of trade, Australia recorded a small trade surplus in the March quarter and the current account deficit declined to 2.8 per cent of GDP. This improvement in the trade balance continued into the June quarter, with the trade surplus expanding to $1.8 billion, or 1 per cent of GDP. Assuming the net income deficit remains broadly unchanged, this implies that the current account deficit will decline in the June quarter to a little under 2 per cent of GDP, the lowest level since 1980. Looking ahead, however, the weakening in trading partner growth coupled with stronger growth in domestic demand is likely to see some reversal of these trends (Graph 42).
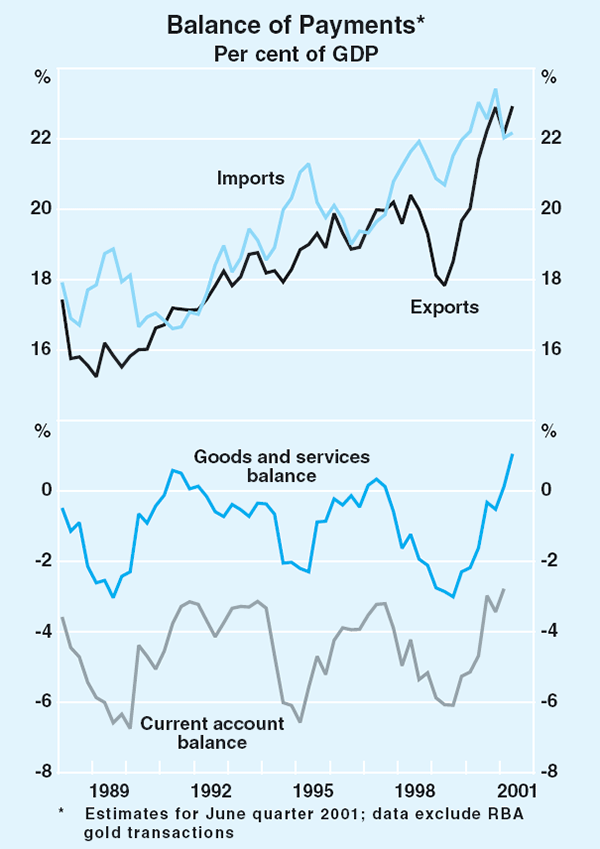
The value of exports rose strongly in the June quarter, to be 15 per cent higher over the year, driven primarily by growth in exports of rural and resource products (Graph 43). Exports of manufactured goods and services, by contrast, have been more subdued. By destination, merchandise export growth to East Asia, Japan and the US has slowed over the past year, following a couple of years of very strong growth (Graph 44). The contraction in exports to non-Japan Asia has been most marked, in response to these countries' falling production levels and lower export sales. The weakness has been driven by lower demand for resource exports, particularly from Korea, Singapore and Taiwan. Exports to China, however, remain on an upward trend, as its markets become increasingly open. China's expected entry into the World Trade Organisation at the end of the year is likely to result in further growth in exports to that country. Exports to Europe – particularly of resources – increased very strongly in the June quarter.
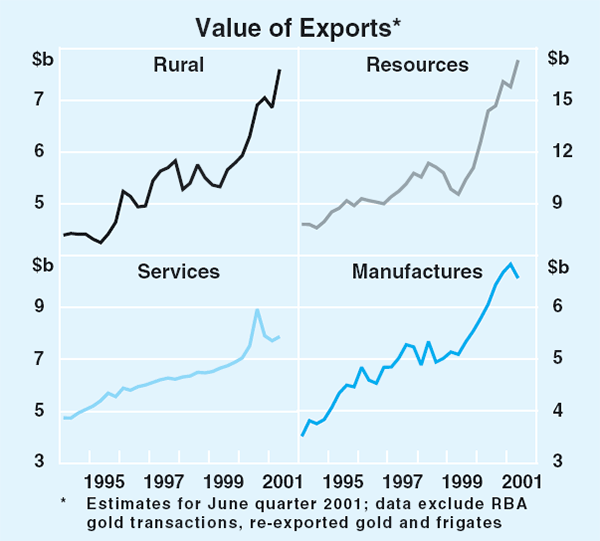
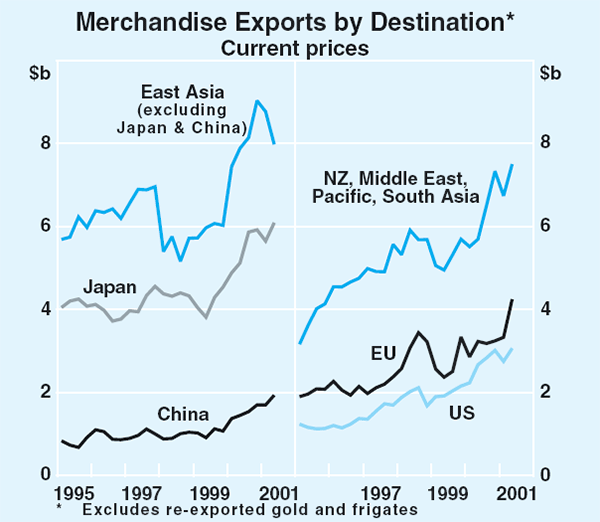
The value of resource exports rebounded in the June quarter, and has grown very strongly since early 1999. While the increase in the June quarter partly reflects higher bulk commodity contract prices, the value of other resource exports has also increased, probably driven by higher re-exports of gold. Despite the slowdown in trading partner growth, demand for most resource exports remains quite strong, with prices in Australian dollar terms encouraging firms to run down inventories and operate at high levels of capacity.
Continuing the trend since mid 1999, the value of rural exports also rose strongly in the June quarter to be sharply higher over the year. High levels of rural production have been supporting continued growth in exports, as have continuing price gains for key meat and grain commodities. Meat exports accounted for much of the increase in the June quarter. Cereal exports also increased sharply in the quarter, following a weather-related fall in the March quarter. Wool exports have been another key source of rural export growth in recent years. In the near term, however, growth in the supply of wool for export may slow a little, given the recent elimination of the official wool stockpile, ten years after the collapse of the wool price support scheme. The strength in farm output combined with continued price gains has been reflected in the positive cash flows experienced by the rural sector during the past couple of years. The Australian Bureau of Agricultural and Resource Economics is currently forecasting that rural production, exports and prices will increase further in 2001/02.
Softening growth in Australia's trading partners has curtailed the growth of manufactured and services exports following a period of strong growth (Graph 45). The recent slowing in manufactured export growth primarily reflects falls in machinery exports and a levelling out of transport equipment sales. The value of service exports has risen in recent months after softening earlier in the year. This increase occurred despite the recent slowing in short-term overseas arrivals, which are only moderately above levels recorded a year ago.
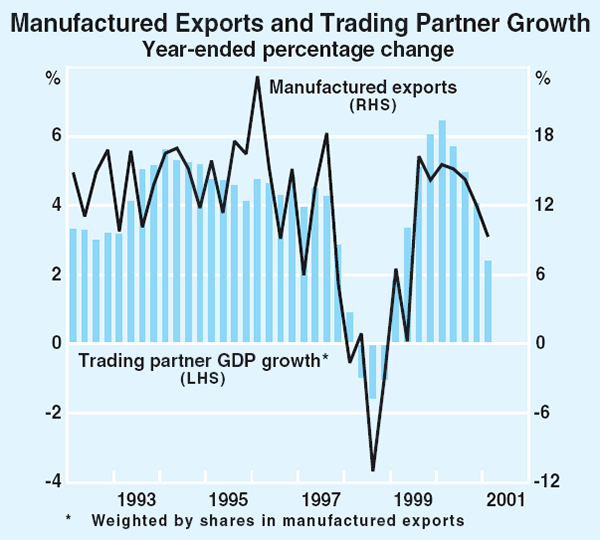
The volume of imports fell sharply in the March quarter, to be well below the level of a year ago. This decrease may have been partly in response to the run-up in inventories that occurred across many sectors in the economy in the second half of last year as domestic demand growth slowed. The recent increases in imported goods prices, on account of the lower exchange rate, are also likely to have been important. In value terms, there was a solid rebound in imports in the June quarter, driven by increased imports of consumption and intermediate goods. Import prices, however, rose strongly in the quarter suggesting that import volumes were broadly flat.
Imports of capital goods have fallen particularly sharply over the past year (Graph 46). While most categories of capital goods imports declined, the fall has been particularly large for transport and telecommunications equipment. This occurred during a period in which recorded equipment investment remained roughly constant, perhaps suggesting that firms are sourcing an increasing share of equipment investment from domestic producers in response to the relatively higher prices of imported goods on account of the lower level of the exchange rate. It is also possible, however, that the weakness in capital imports foreshadows a weak period in equipment investment ahead. The volume of consumption imports also fell in the March quarter, driven by weaker demand for transport equipment and household electrical equipment. This too may reflect the impact of the lower exchange rate, as retail sales have grown strongly in the year to date. It may also reflect the desire by some retailers to unwind part of the inventory accumulation that took place in the second half of 2000.
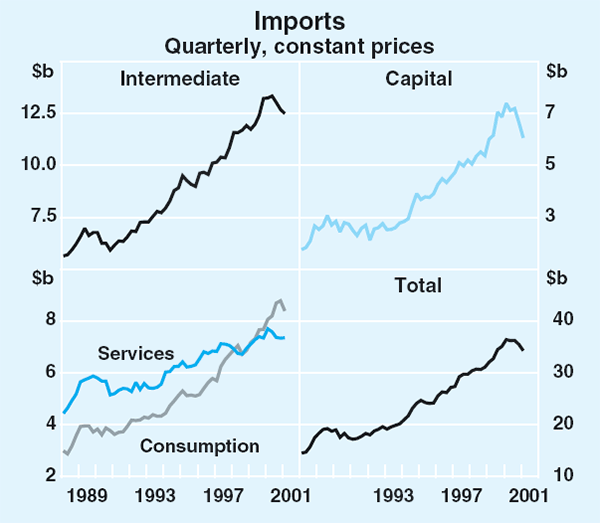
The net income deficit widened slightly in the March quarter but remained at around 3 per cent of GDP. An increase in interest payments on net debt, combined with a small fall in exports over the period, resulted in the ratio of net interest payments to exports rising to slightly under 10 per cent. Nevertheless, the ratio remained low by historical standards.
Australia's net foreign debt increased in the March quarter to $317 billion, or 48 per cent of GDP (Graph 47), although this was substantially offset by a fall in net equity liabilities. Overall, net foreign liabilities amounted to 57 per cent of GDP. Such divergent movements in net foreign debt and equity liabilities have been typical over the past couple of years. In part this is because foreign equity inflows have moderated while Australians have continued to invest in foreign equity markets, notwithstanding the relatively stronger performance of the Australian stock market. (For further details see ‘Box A: Composition of Capital Flows in 2000’.)
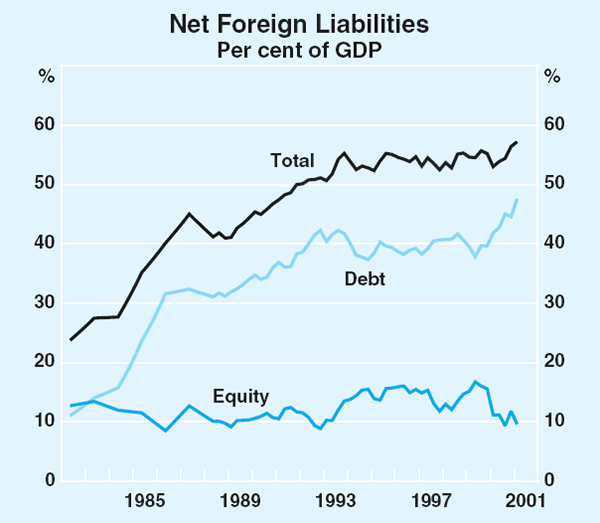
Commodity prices
The RBA commodity price index increased by 4 per cent in foreign currency terms in the three months to July, to be 8 per cent higher than the corresponding period a year earlier (Graph 48). In Australian dollar terms, the index remained around historically high levels, having increased by 40 per cent since mid 1999. Almost all of the growth in the index over the past year has been driven by coal, gas, wheat and iron ore prices (Graph 49). In contrast, the weaker outlook for world growth has resulted in lower base metals prices.
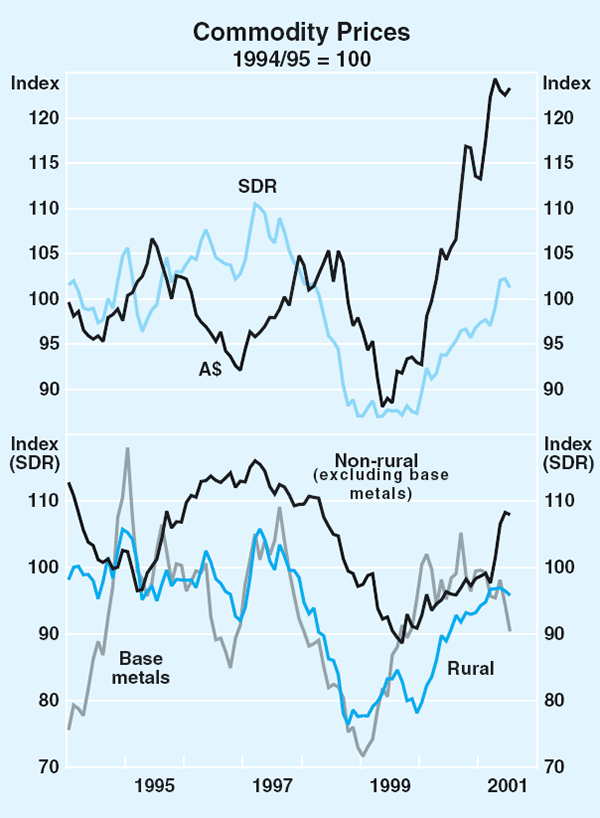
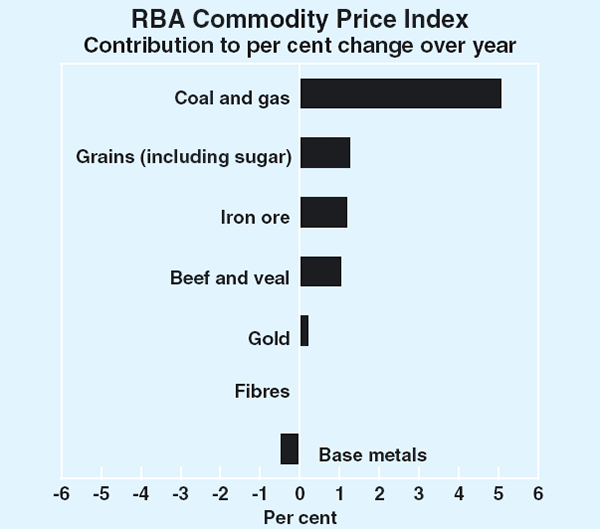
Following recent negotiations of bulk commodity contracts, coal and iron ore prices have increased sharply. The weakening in the global outlook does not appear to have affected either contract or spot coal prices, which are being underpinned by continued tightness in supply and the general pick-up in global energy prices since mid 1999. Notwithstanding these recent increases, coal prices remain low compared with the levels of recent decades.
Gold prices have also increased in the past three months, although they remain little changed from a year ago. After being broadly flat for the past year and a half, base metals prices have fallen in recent months, driven by continuing downgrades to the outlook for world growth. Supply constraints in several markets, particularly aluminium and lead, however, have meant that prices have remained stronger than would normally be expected given the weakening in global industrial production that has occurred (Graph 50).
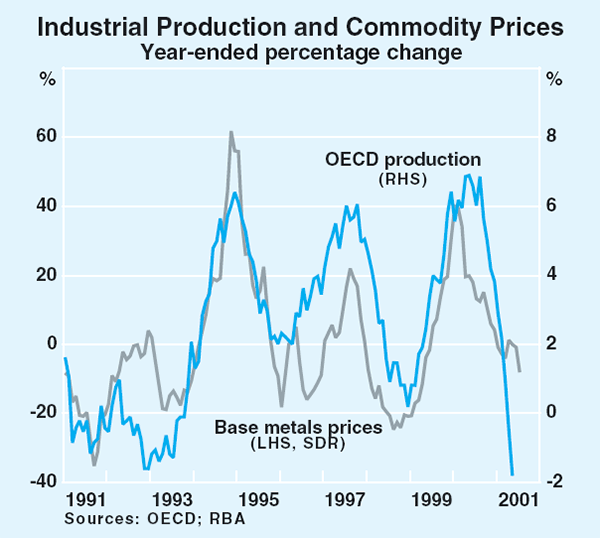
Rural commodity prices have been little changed in recent months, although they remain well up on the low levels recorded in 1998 and 1999. While meat prices have increased over the past year, the apparent containment of foot-and-mouth disease in Europe has resulted in more stable prices over the past couple of months. Sugar prices have also eased in recent weeks, reflecting concerns that the depreciation of the Brazilian currency against the US dollar may stimulate sales from the world's largest exporter. Both cotton and rice prices have fallen sharply this year in response to above-average production levels.
After reaching a peak of US$30 in May, oil prices have declined to around US$27 per barrel. These developments have largely reflected the weakening outlook for global growth. Expectations of strong gasoline demand in the US at a time of low inventories, the temporary cessation of Iraqi crude oil exports and the 1 million barrel per day (4 per cent) cut in OPEC oil production quotas announced in July, however, have provided some offsetting price support.
Domestic Financial Markets
Market interest rates
Improving confidence in Australia's economic outlook in recent months has reflected in market interest rates. Earlier in 2001, sentiment about the economy had been very pessimistic and market yields on both short-term and long-term debt had fallen sharply, particularly after the release of the weak December quarter national accounts data in March. Reflecting the gloomy assessments that followed from these data, markets continued to price-in the prospect of further declines in the cash rate for a time after the April monetary easing. This caused yields on 90-day securities to fall below the cash rate target of 5 per cent, with a low of 4.65 per cent reached in late April (Graph 51). In subsequent months, however, despite the poor outlook for the world economy and expectations of further monetary easing in the US, expectations of further domestic easing largely disappeared, as markets reacted to the run of stronger economic data. As of early August, 90-day bill yields remained close to the cash rate target.
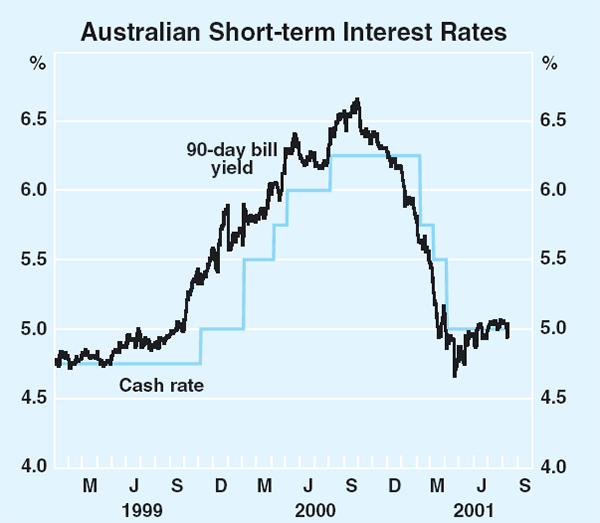
With the US Fed continuing to ease in response to weak US economic data, and Australian cash rates steady since April, the differential in cash rates between Australia and the US has widened to 125 basis points, the largest gap since 1996. The differential in short-term market yields is somewhat wider, as these incorporate expectations of further easing in the US. For 90-day bills, the differential is currently 140 points.
The better economic data in Australia has also seen yields on long-term bonds increase appreciably in recent months. Yields on 10-year bonds had reached a low point of just under 5 per cent in mid March. Since then, Australian bond yields have increased to around 6 per cent, though they dipped sharply following release of the July labour market data (Graph 52).
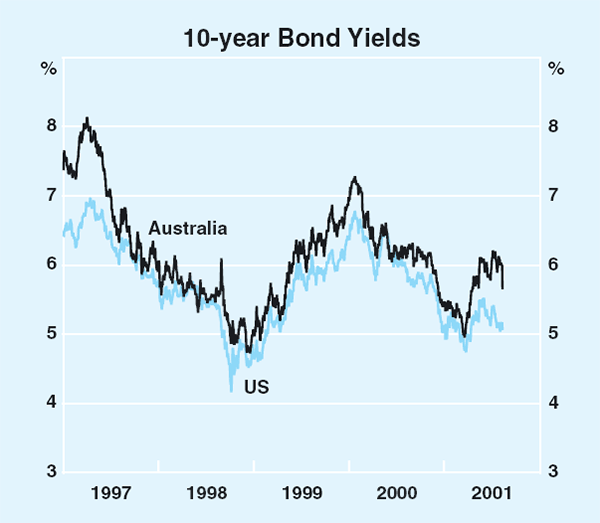
The differential between Australian and US bonds has steadily increased over the past few months, reaching a peak of 100 basis points in late July, the highest levels seen since the time of the Russian debt default in 1998. The main factor driving the widening spread seems to have been greater confidence that Australia's near-term economic prospects are more solid than those in the US. As can be seen in Graph 53, the widening in the bond spread has gone hand-in-hand with a widening in the differential at the short end of the yield curve. In the second half of July, the widening bond differential was exacerbated by ‘safe-haven’ buying of US bonds in response to concerns about emerging markets, sparked by problems in Argentina.
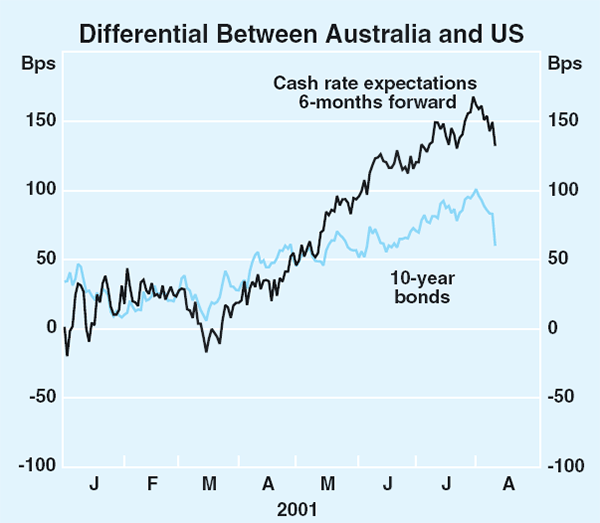
Corporate bond yields have also moved up since the trough in market interest rates in March (Graph 54). The increases have, however, been slightly smaller than the increases in government bond yields of similar maturity, implying a small decline in the credit spreads on corporate bonds. This seems to have been due to reduced concerns about credit risks as expectations about domestic economic growth improved. Yields on AAA-rated corporate bonds are currently around 35 basis points higher than for government bonds of similar maturity, compared with a spread of around 50 basis points in the early part of the year. Spreads on other less highly rated corporate paper are also lower than their levels at the beginning of the year. Australian corporate bond spreads remain well below those in the United States.
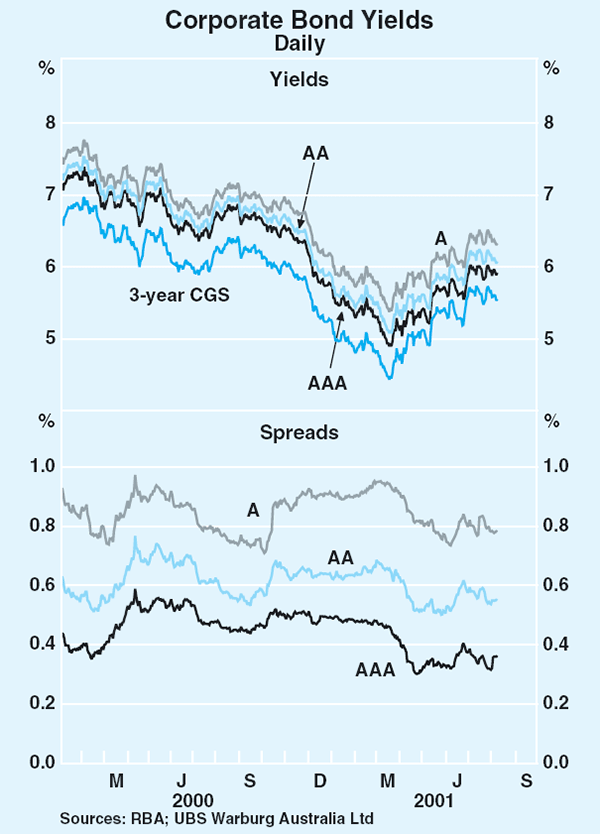
Intermediaries' interest rates
Reductions in the cash rate target between February and April were passed on quickly to intermediaries' variable lending rates and, with the cash rate target unchanged since April, there have been no further changes to the main variable indicator rates in recent months. As a result of the reductions this year, most of these rates have returned to levels near the cyclical lows of three years ago and, given the longer-term compression of banks' interest margins, they are generally well below the earlier cyclical lows recorded in 1994. Table 9 summarises the main indicator rates of financial intermediaries.
| Current level (late July) |
Cyclical low 1998/99 |
Cyclical low 1993/94 |
|
|---|---|---|---|
| Household | |||
| Mortgages | |||
| – Standard variable | 6.80 | 6.50 | 8.75 |
| – Basic housing | 6.25 | 5.90 | na |
| – Mortgage managers | 6.55 | 6.10 | 7.70 |
| Personal lending | |||
| – Residential secured | 7.00 | 6.60 | 9.75 |
| – Credit cards | 16.00 | 15.25 | 14.35 |
| Small Business | |||
| Residential secured: | |||
| – Overdraft | 7.40 | 6.95 | na |
| – Term loan | 7.00 | 6.65 | na |
| Other security: | |||
| – Overdraft | 8.00 | 7.45 | 9.30 |
| – Term loan | 7.45 | 7.05 | na |
| Large Business | |||
| – Overdraft | 8.50 | 7.95 | 9.00 |
| – Term loan | 8.40 | 7.90 | na |
| Cash rate | 5.00 | 4.75 | 4.75 |
While most variable rates have not changed recently, there have been significant movements in fixed rates for both homeowners and businesses. Movements in these rates tend to reflect changes to the cost of intermediaries' fixed-rate funding, which has generally been increasing in recent months, after a substantial decline over the year to March. Reflecting the recent increases in funding costs, the average 3-year fixed rate on small business loans has increased by around one percentage point from the trough recorded in March, to 7.40 per cent (Graph 55). This increase was slightly greater than the increase in swap rates of similar maturity, from which these loan products are priced.
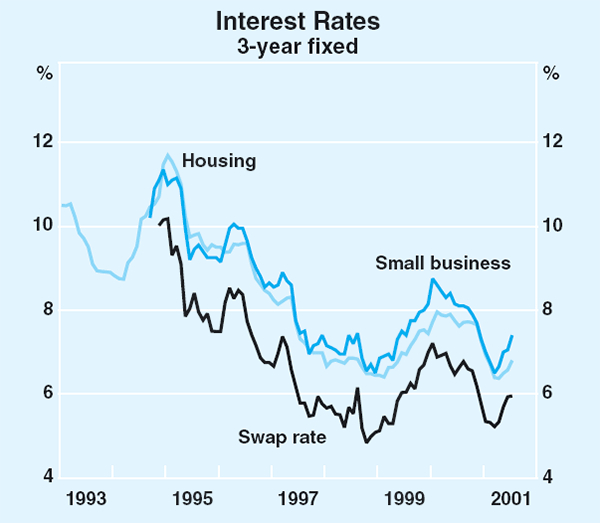
For housing loans, the increase in fixed rates has been more muted, with banks absorbing some of the increase in funding costs. The average 3-year fixed mortgage interest rate offered by banks has increased by around 0.4 percentage points since April, following a fall of almost 1.6 percentage points from the most recent peak in early 2000. The average 3-year fixed mortgage rate is currently close to standard variable rates, though the rates for longer maturities are higher.
Capital markets developments
Debt markets
The level of issue activity in the domestic non-government bond market remained high in the June quarter and has been strong in the month of July (Graph 56). Non-government bonds outstanding are estimated at $99 billion at end July, with the asset-backed sector accounting for $32 billion, financial entities $24 billion, corporates $24 billion and non-residents $19 billion.
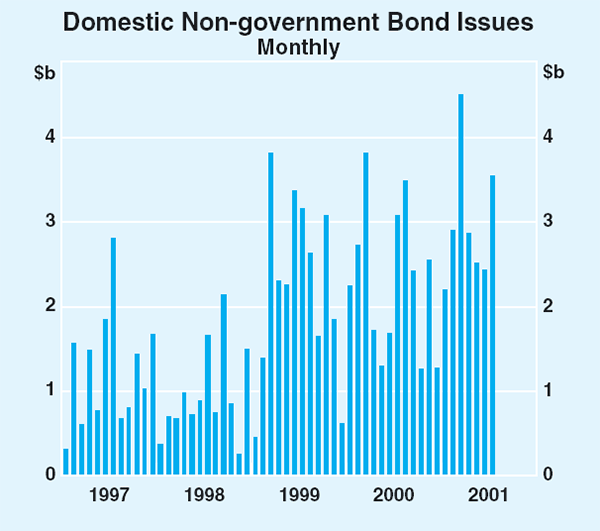
During the June quarter, non-residents and the asset-backed sector were the largest issuers, though corporate bond issuance increased strongly in the quarter (Table 10). While still accounting for more than a third of issuance, non-residents did not make up as large a share of issuance as in the March quarter. During the March quarter, narrower credit spreads in Australia compared with spreads seen in overseas markets, such as the US, combined with favourable terms on cross-currency basis swaps, made it attractive for foreign borrowers to issue debt in the Australian market. In the June quarter, much of the advantage of issuing in Australia dissipated as credit spreads fell much more sharply in the US than in Australia.
| Sector | 2001 | 2000 | 1999 | |
|---|---|---|---|---|
| June Qtr | Mar Qtr | |||
| Financials | 1.0 | 2.1 | 5.1 | 10.1 |
| Non-residents | 2.4 | 3.8 | 3.5 | 5.6 |
| Corporates | 1.9 | 0.5 | 8.3 | 5.0 |
| Sub-total (Non-asset-backed) |
5.3 | 6.4 | 16.9 | 20.7 |
| of which: | ||||
| Credit-enhanced | 1.7 | 0.0 | 4.2 | 0.0 |
| Asset-backed | 2.7 | 3.0 | 10.6 | 5.9 |
| Total issuance | 8.0 | 9.4 | 27.5 | 26.6 |
The asset-backed sector in Australia, mainly comprising securitised mortgages, has seen continued strong activity in the first half of this year. The value of residential mortgages securitised increased to about $53 billion in June from $43 billion in December (Graph 57). Housing loans securitised rose to 15 per cent of all Australian residential mortgages, up from 13 per cent in December. This increase in activity largely reflects two major banks starting to securitise their home loans for the first time. Most of the mortgage-backed bonds issued in the half year were sold in offshore markets.
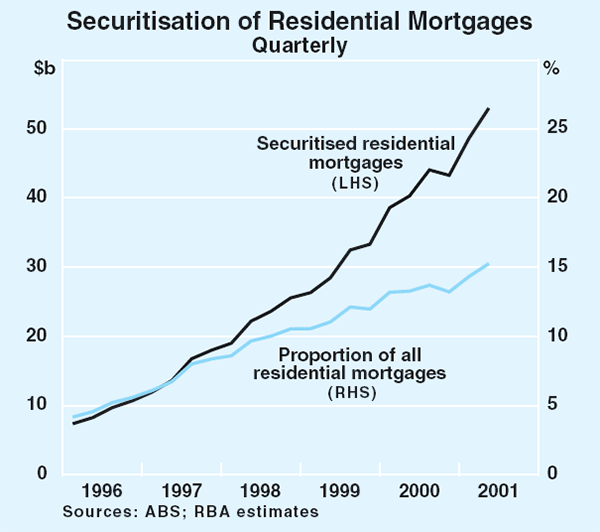
In the month of July the domestic bond market saw a broader mix of issuers than had been the case in previous months with several corporate and lower-rated entities accessing the market. Property trusts and utilities have accounted for a large share of corporate debt issuance over the past 18 months. Reflecting their inflation-linked revenue, utilities have been substantial issuers of inflation-indexed bonds and have contributed significantly to the strong growth of the indexed-bond market (see Box C ).
Despite concerns about corporate profitability, the credit quality of the corporate bond market remains high in Australia. There have been no defaults on corporate bond issues. High-profile companies that have failed this year, such as HIH Insurance, Harris Scarfe and One Tel, had no domestic bonds on issue. Graph 58 shows one measure of credit quality, the average credit rating of non-government bonds (excluding asset-backed bonds) outstanding. Despite the strong growth of the market in recent years and the introduction of lower-rated issuers, the average rating of all bonds on issue has only fallen slightly and remains at a relatively high level between AA and AA−.
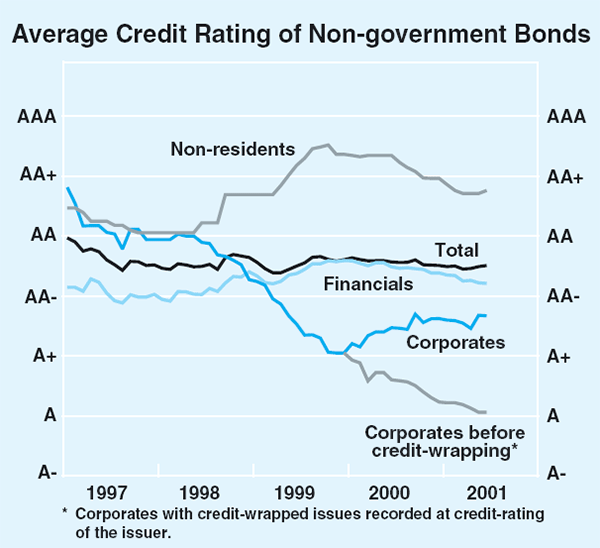
One feature of the Australian corporate bond market over the past 18 months or so is the use of credit-enhancing facilities (known as ‘credit wrapping’) by utilities and airports when issuing debt. Typically the repayment of these bonds is guaranteed by a highly rated institution. This has led to a rise in the average credit rating of corporate paper on issue. Abstracting from the effect of credit enhancement (by looking at the issuers' ratings rather than the credit-enhanced bonds' ratings) shows how the use of such techniques has allowed a broader range of companies to access finance direct from the market. On this basis, the average credit rating of corporate borrowers with bonds outstanding in the market decreased from AA in 1997 to around A in 2001. This change in average credit rating of borrowers accessing the market is predominantly due to the entry of lower-rated issuers; credit downgrades of corporates account for only a minor part of this trend.
Equity markets
Despite some significant earnings downgrades, the Australian share market rose further over May and June. The peak was reached on the last trading day of June though there was some unusual trading that day which ASIC is investigating. Since late June (and abstracting from the end-June peak), the Australian market has retreated a little from its recent highs. Nevertheless, the overall growth in the Australian market since the start of the year contrasts with the performance in the US, where share prices fell (Graph 59). Since the peak in March last year, the Wilshire index in the US has fallen by 26 per cent, while the Australian index has risen by 5 per cent over the same period. This recent stronger performance of the Australian market has offset the underperformance relative to the US over the previous two or three years.
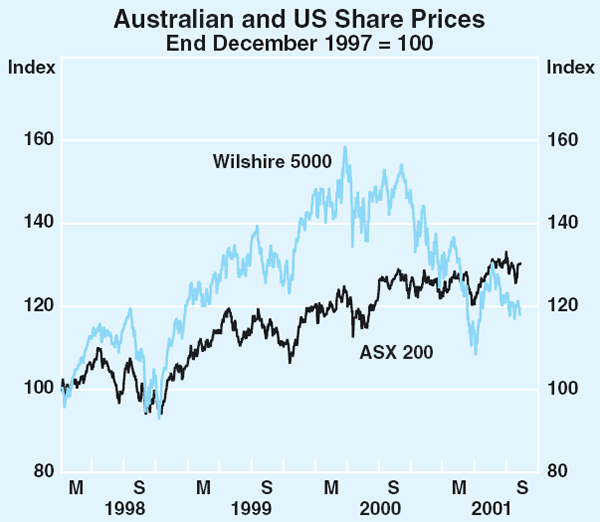
Banks' share prices have increased strongly over the past few months, providing the largest contribution to the increase in the overall share market (Graph 60). There does not seem to be any concern about banks' credit exposures, despite some recent high-profile corporate failures. Shares in the resources sector, however, were hurt by concerns about world growth prospects and weaker commodity prices. The share prices of industrial companies other than banks also fell, led by the telecommunications sector.
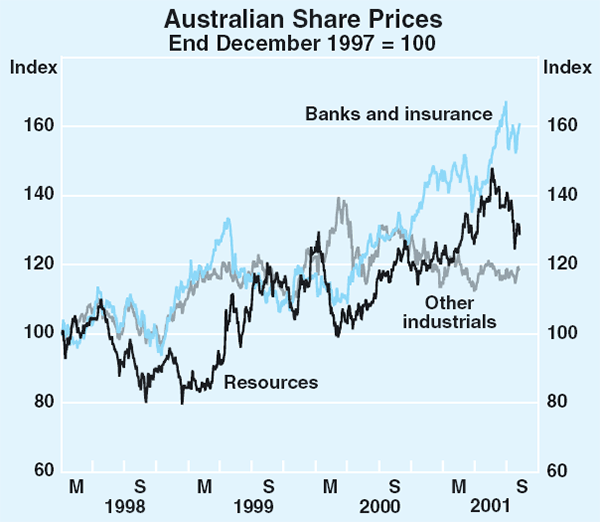
Uncertainty about corporate profitability has had an impact on the Australian share market, though corporate profits here remain much stronger than in the US (Graph 61). Several ‘blue chip’ companies announced that earnings growth would not be as high as previously expected, leading to falls in their share prices. The banking sector – whose earnings have been underpinned by robust credit growth – was relatively unaffected by this uncertainty. Overall, expectations of growth in earnings per share of industrial companies have been revised down more quickly this year than in 1999 and 2000, though the rate of downward revision has slowed in recent months (Graph 62). Estimates for earnings per share growth in 2002 have strengthened, implying that share analysts are expecting a rebound in earnings per share after a weaker performance in 2001.
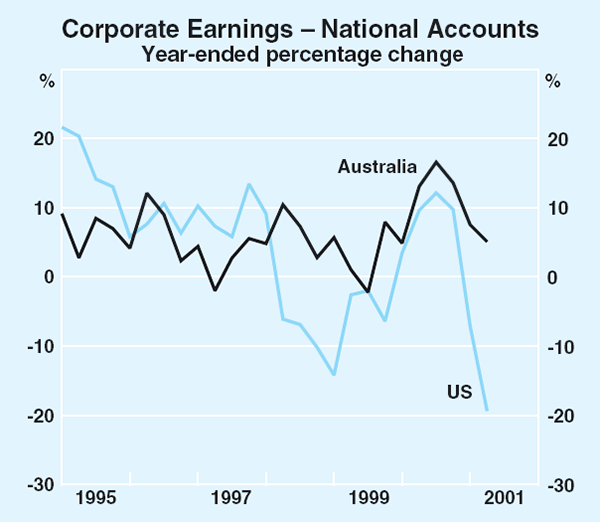
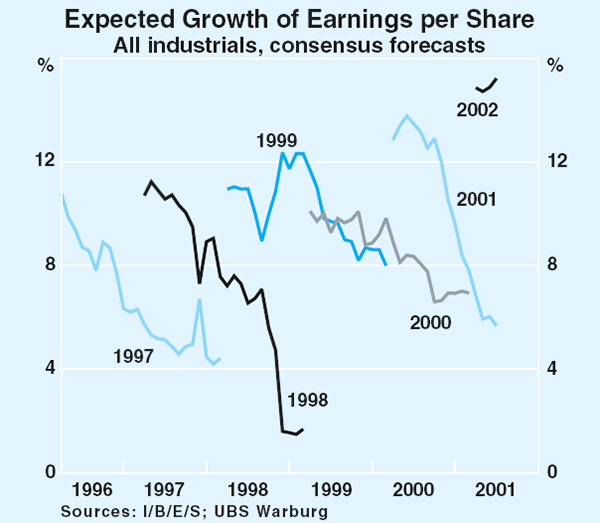
Australian shares prices appear to have benefited from offshore buying associated with a larger Australian weighting in global share indices. In May, Morgan Stanley Capital International (MSCI) announced revisions to the composition of its share price indices. The changes have been introduced to better reflect the proportion of each market's shares that are freely tradable (for example, by taking account of foreign ownership restrictions and government ownership of partly privatised entities). The transition to the new indices will be made in several stages and will be completed in May 2002. The changes made by MSCI caused Australia's weight in its indices to rise, particularly within the Asia-Pacific region (Table 11). While banks were the main beneficiaries, some sectors – such as telecommunications and media – saw their weightings fall.
| Previous | New | |
|---|---|---|
| World Index | 1.32 | 1.33 |
| Europe, Australasia, Far East | 3.00 | 3.36 |
| Asia Pacific ex Japan | 25.8 | 35.1 |
The amount of funds raised by companies via initial public offerings slowed in recent months. An average of $116 million per month was raised between May and July, compared to a monthly average of $387 million during 2000. Sizeable floats foreshadowed by several companies for the month of August suggest that the pace of equity raisings through initial public offerings may pick up a little in the near term. Broader measures of equity raisings (including rights issues and placements) have been running at a stronger pace than initial public offerings this year.
Margin lending
Margin lending for equities and managed funds continues to increase strongly in terms of value lent, approved credit limits and the number of clients. During the June quarter, total margin debt rose by 16 per cent, after growth of 2 per cent the previous quarter. Over the past year, margin lending has grown more rapidly than other forms of personal finance and now represents 12 per cent of all personal loans (excluding housing). The average leverage ratio (the ratio of loans to shares) is 46 per cent, down a little from the middle of last year (Table 12). After increasing substantially in the March quarter, growth in margin calls slowed in the June quarter and was less than the increase in overall margin debt.
| September quarter 2000 |
June quarter 2001 |
Growth Per cent | |
|---|---|---|---|
| Total margin debt ($b) | 6.7 | 8.5 | 26 |
| Total margin loans approved ($b) | 11.9 | 13.3 | 12 |
| Credit limit use (per cent) | 56.5 | 63.8 | |
| Value of underlying shares ($b) | 12.8 | 18.7 | 46 |
| Leverage (per cent) | 52.5 | 45.6 | |
| Number of margin loans (‘000) | 86.4 | 94.7 | 10 |
| Average loan size ($‘000) | 78.0 | 89.9 | |
| Number of margin calls (‘000) | 7.1 | 19.0 |
Box C: Inflation-indexed Bonds and Swaps
Uncertainty about inflation represents a risk for anyone contracting to receive or pay a fixed nominal amount of money at some date in the future. In pursuing the goal of medium-term price stability, the Reserve Bank has adopted the objective of keeping inflation between 2 and 3 per cent, on average, over the cycle. This helps to narrow the range of likely future inflation rates and to provide reasonable certainty about the price level over the sorts of horizons relevant for most wage and price-setting decisions. But even when average inflation remains low, small variations in the rate of inflation can have a significant effect over the longer term – for example, on a 20-year bond. The two principal financial market instruments that allow companies to manage their exposure to movements in inflation are inflation-indexed bonds and inflation swaps.
Most conventional (‘nominal’) bonds promise the holder a fixed dollar flow of payments over the life of the bond. The price of conventional bonds declines when inflation rises as inflation erodes the real value of their nominal coupon and principal payments. In the case of inflation-indexed bonds, however, the bond's payments are indexed to movements in a price index, such as the Consumer Price Index (CPI), ensuring the value of interest payments and the bond's principal amount are fixed in real terms.
The indexed bond market is small relative to the overall bond market (indexed bonds make up 6 per cent of all bonds outstanding). Nevertheless, in recent years the inflation-indexed bond market has grown steadily, with the market increasing in size by almost 30 per cent over the past five years. As at end June 2001 total outstandings amounted to just under $12 billion (Graph C1). The development of an indexed securities market in Australia dates from 1985 when the Commonwealth issued $100 million of capital-indexed bonds. Subsequently State governments and non-government borrowers have also issued indexed bonds. At present, the Commonwealth government accounts for 50 per cent of indexed bonds, the states a further 21 per cent and non-government issuers 29 per cent.
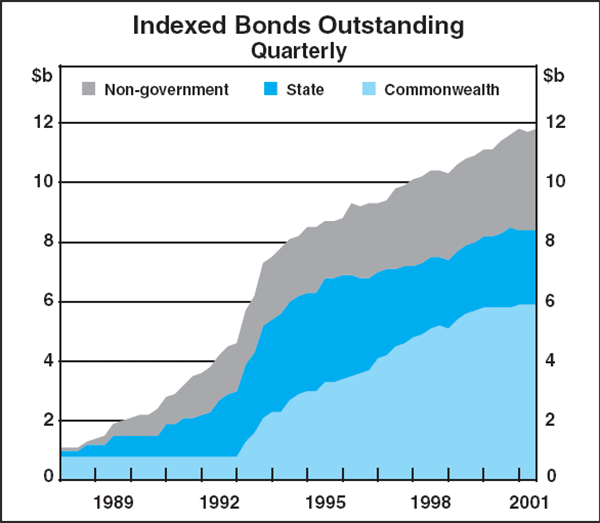
In recent years, much of the corporate issuance of indexed bonds has come from utility companies, whose revenues are linked to the inflation rate. Under the regime administered by the Victorian Office of the Regulator General, for example, the distribution prices charged by electricity generators in Victoria are capped, and the cap is indexed to the CPI. As a result, when such utilities issue nominal bonds, movements in inflation impact on their profits by affecting the margin between their revenues (which are indexed to inflation) and their debt-servicing costs (which do not move in line with inflation). As well as electricity distributors, a number of infrastructure projects, such as the Loy Yang Power stations and the Sydney Harbour Tunnel, have borrowed by using inflation-indexed bonds to manage their exposure to fluctuations in inflation.
As an alternative to inflation-indexed bonds, companies whose revenues are linked to inflation can issue nominal bonds and hedge the resulting exposure to inflation by using inflation swaps. An inflation swap takes the form of an exchange of a regular stream of inflation-indexed payments for a stream of nominal interest payments. The nominal payments may be based on either a fixed interest rate or a variable interest rate such as the bank bill rate. This set of transactions is illustrated in Graph C2. Combining the swap with the nominal bond results is the same net cash flows as if the utility company had issued indexed bonds.
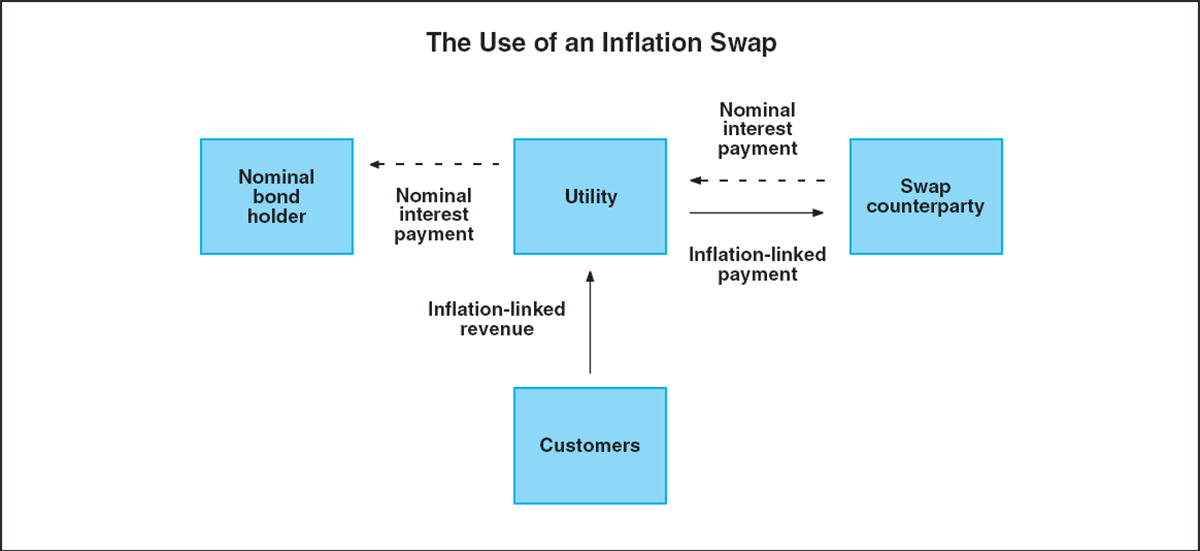
The inflation swap market emerged in Australia in the mid 1990s. Like the indexed bond market, the inflation swap market is small in comparison to the overall market for interest-rate swaps. The size of the Australian market for inflation swaps is estimated to be around $500 million nominal principal outstanding, compared with around $500 billion in the nominal swaps market. Unlike the nominal swaps market, where only around 2 per cent of swaps have a maturity of ten years or longer, more than half the inflation swaps outstanding in the Australian market have a maturity of ten years or more.
In terms of those looking to enter into swaps that pay an inflation-indexed rate and receive a nominal interest rate, the chief users include utilities, retailers locked into inflation-linked lease payments for their premises, and property trusts.
On the other side of the market (i.e. those who wish to pay a nominal rate in return for inflation-linked receipts), firms with inflation-linked liabilities can use inflation swaps to protect themselves against the risk that inflation, and thus their liability, is more than they expected. For example, inflation swaps can provide an offset to the inflation exposure resulting from insurance and life assurance companies' holdings of inflation-linked liabilities such as indexed annuities. State government borrowing authorities have also used inflation swaps to modify their exposure to inflation that results from mismatches between their inflation-indexed investments and borrowings.
The principal hedge available to financial institutions that act as intermediaries between the various end users of inflation swaps is indexed bonds. As a result, activity in the inflation swaps market is highly dependent on the size and liquidity of the inflation-indexed bond market.
Assessment of Financial Conditions
Financial conditions continue to be relatively expansionary. As a result of the easing in monetary policy since the beginning of 2001, the level of the cash rate is below its average of recent years and near previous cyclical lows. Borrowing rates are also relatively low and are supporting a robust expansion in credit to households. The yield curve has retained a modest upward slope and the exchange rate remains at a low level in both real and nominal terms. As described in the chapter on ‘Domestic Financial Markets’, the Australian equity market is near its historical high.
Interest rates
The 1¼ percentage point reduction in the cash rate earlier in the year was quite rapid, as the favourable outlook for inflation provided the scope for monetary policy to move quickly to a more supportive stance for domestic economic activity. The magnitude of the reduction in the cash rate in Australia has been comparable to that in other English-speaking countries, with the exception of the US where it has been considerably larger. The greater extent of the monetary easing in the US reflects the weaker economic outlook there compared with that in Australia.
It is difficult to identify the benchmark against which one can assess whether a particular level of interest rates is expansionary. Box D discusses some of the determinants of the ‘neutral’ rate of interest and indicates that these are likely to have contributed to gradual shifts in the neutral rate over time. One approximate benchmark is the average interest rate over the period since 1992 during which inflation has been low and stable and the economy has recorded good growth on average. Using that as a guide suggests the current level of cash rates is expansionary for economic activity. Graph 63 shows that using a similar benchmark for borrowing rates, current settings are even further below the average rate since 1992, reflecting the reduction in interest rate margins by financial intermediaries over the course of the 1990s.
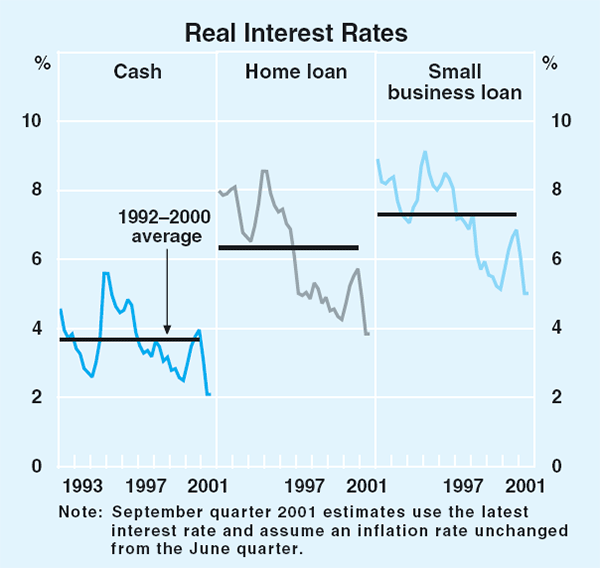
These relatively low levels of real interest rates shown in the graph may, however, be slightly exaggerating the apparent expansiveness of current settings. The real rates are calculated using actual inflation as a proxy for expected inflation but it is likely that the gap between actual and expected inflation has narrowed over the course of the 1990s as the low inflation environment has become better established. This suggests that more accurate measures of average real interest rates since 1992 may be slightly lower than those shown in Graph 63 (see Box B in the February 2001 Statement on Monetary Policy for more discussion of the calculation of real interest rates).
The increased stability in the inflation environment in recent years complicates the interpretation of the slope of the yield curve, which is the difference between long-term rates determined by the market and short-term rates largely determined by monetary policy settings. A decline in inflation variability is likely to be reflected in lower long-term yields – as bondholders require a smaller premium to compensate them for this uncertainty – implying that the historical difference between short and long-term yields that is associated with normal economic conditions may have narrowed. Over the course of 2001, the slope of the yield curve has shifted from negative to positive as short rates have fallen and long rates have risen (Graph 64). The fall in short-term rates reflects the easing in monetary policy since the beginning of the year, while the rise in long-term yields appears to reflect the fact that expectations of an economic recovery have become more firmly held.
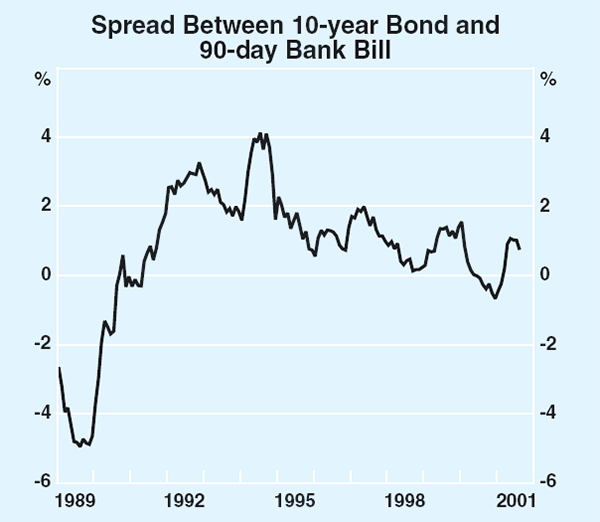
Financial Aggregates
Credit grew at an annualised rate of around 10 per cent over the six months to June, which is toward the lower end of the range of growth experienced over much of the past decade (Graph 65). Households continue to borrow at a considerably faster pace than businesses, with household credit rising at an annualised rate of nearly 14 per cent over the six months to June, compared with growth of 6 per cent in business credit over the same period. Household borrowing has been bolstered by a significant pick-up in lending for housing which has increased at an annual rate of 17½ per cent over the three months to June. In contrast, the more subdued pace of business borrowing is consistent with businesses' assessment of current conditions. Data on loan approvals suggest that these trends in household and business borrowing will continue in coming months.
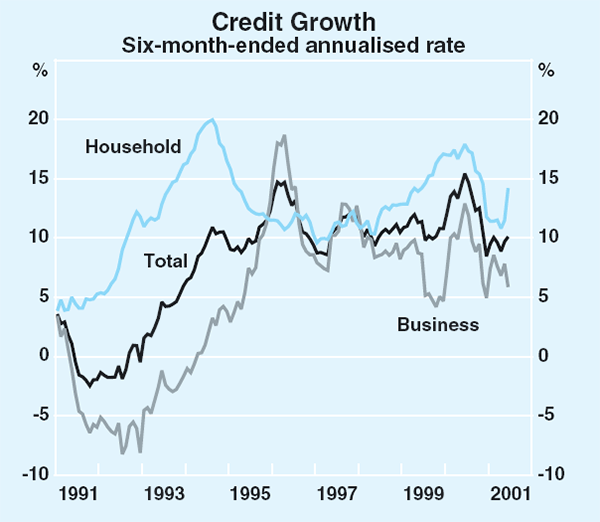
Growth in the broader monetary aggregates eased a little in the June quarter, following very strong growth in the March quarter. M3 and broad money have grown at an annualised rate of 15 and 11 per cent respectively in the six months to June. Among funding sources not counted in the monetary aggregates, domestic bond issuance and net offshore borrowing by financial institutions slowed in the June quarter.
Real exchange rate
As discussed in the chapter on ‘International and Foreign Exchange Markets’, the Australian dollar has been broadly unchanged over the past three months, both against the US dollar and in trade-weighted terms, but is around 12 per cent lower than a year earlier against the US dollar and 6 per cent lower in trade-weighted terms. The movement in the real exchange rate, which adjusts for differences in inflation rates across countries, has been similar. Graph 66 shows that the real exchange rate has fallen by around 4½ per cent over the year to June to be 14 per cent below its 1990s average and close to historic lows. The low level of the exchange rate is likely to provide continued support to the export and import-competing sectors of the economy.
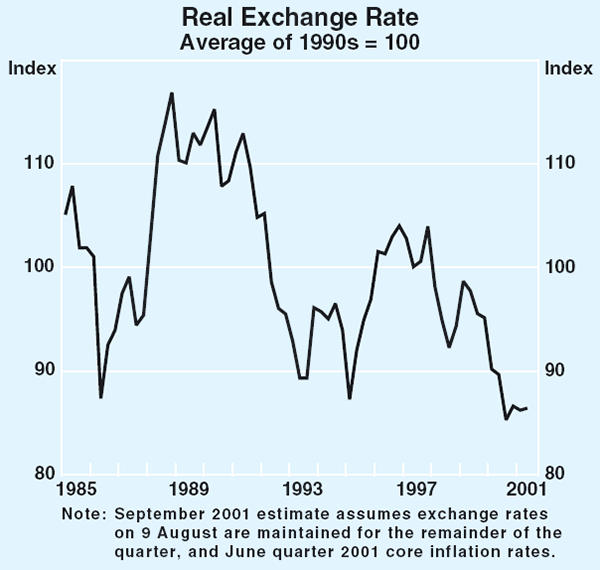
Box D: The ‘Neutral’ Real Interest Rate
The level of real interest rates is one indicator of the stance of monetary policy. Monetary policy may be regarded as expansionary when the real policy rate is below some ‘neutral’ level, which is one consistent with stable inflation and output growing at its potential rate. This box discusses the concept of the ‘neutral’ rate, and describes some of the factors that may cause it to vary over time. While historical experience can provide some guidance, the effect of these influences is difficult to pin down. Consequently, the value of the neutral real interest rate is subject to considerable uncertainty.
The idea of a neutral interest rate has its underpinning in the ‘natural’ rate of interest explained by the Swedish economist Knut Wicksell at the end of the 19th century. For Wicksell, the natural rate was that real rate of return on physical capital at which the supply of saving and the demand for investment funds were equal. Wicksell distinguished between this natural rate and the so-called ‘money’ rate of interest which was able to be influenced by monetary policy. When the money rate was below the natural rate, there would be a tendency for credit and investment to undergo a cumulative expansion, so boosting the economy and prices. The reverse would occur when the money rate was higher than the natural rate. When the money rate and the natural rate were the same, monetary policy would be exerting neither an expansionary nor contractionary force on the economy.
While Wicksell's model was highly simplified, there is a strong similarity between these basic ideas and those common in modern discussion of monetary policy. The central bank influences interest rates in the short-term money market, but it is the relationship between these financial market rates and the (unobservable) expected returns on other assets which drives the processes which affect the economy, with the credit process playing an accommodating role. When the setting of money market interest rates is such as to exert neither contractionary nor expansionary forces on the economy, policy can be said to be ‘neutral’.
On average, the natural rate can be thought of as anchored by the economy's long-run fundamentals, such as productivity performance, saving and so on. Common usage of the term ‘neutral’ tends to assume that the neutral rate is constant, but the factors that affect the supply of saving and the rate of investment will drive movements in the neutral rate through time, although these are likely to be very gradual. Given that Australia's financial markets are highly integrated with global markets, global developments in saving and investment will also influence the neutral real rate in Australia.
The increased rate of productivity growth enjoyed in the United States and Australia over the 1990s is likely to have put upward pressure on the neutral rate in both countries.[1] A sustained increase in the rate of productivity growth raises the rate of return to investment. The consequent rise in investment requires a rise in the neutral rate to bring saving and investment back into balance.
The size of government deficits can influence the neutral rate by increasing or decreasing the public sector's call on the supply of funds. The increase in budget deficits in many countries through the 1970s and 1980s is likely to have placed upward pressure on the neutral rate. Conversely, the fiscal consolidation around the world over the 1990s (with the exception of Japan) is likely to have put downward pressure on the neutral rate.
Demographic factors affect both the supply and demand for funds. Early in their working lives, households tend to save relatively little, but this increases as they approach retirement age. The ‘baby boomers’ are now reaching the peak saving age, which might be expected to be placing downward pressure on the neutral rate, although there is little evidence at this stage that the measured saving rate is increasing due to this factor. On the demand side, an increase in the rate of growth of the labour force will lead to a rise in the neutral rate, as there is a need for more investment to provide the necessary capital to employ the larger labour force.
When the rate of inflation is highly variable, suppliers of funds (savers) require a premium to be paid to compensate them for the uncertainty about future inflation, which threatens the erosion of their savings. The increased stability in the rate of inflation over the past decade is likely to have contributed to a lower neutral rate in Australia.
Changes in these determinants of the neutral rate over time imply that it is difficult to pin down the level of the neutral rate at any point in time. Two other issues further complicate the determination of the neutral setting of the real policy interest rate. Firstly, the compression of lending margins over the past decade means that a given level of the policy interest rate is now associated with a lower cost of borrowing than in the past and hence provides a greater incentive to invest. This suggests that the neutral policy rate may be higher than in the past. Secondly, the above discussion has been in terms of the neutral real interest rate, but the policy rate is set in nominal terms. As inflation expectations change, the nominal policy rate setting that corresponds to the neutral real rate will also change. Over the past decade, most measures of inflation expectations have declined which suggests that the neutral nominal policy rate is likely to be lower than it was in the past.
Inflation Trends and Prospects
Recent developments in inflation
Consumer prices
The Consumer Price Index increased by 0.8 per cent in the June quarter to be 6.0 per cent higher than a year earlier (Graph 67, Table 13). The rise in the quarter resulted from broadly based inflation across tradable products, with the prices of non-tradable products rising much more moderately. Higher petrol prices as well as the recent tax changes continue to affect inflation in year-ended terms. Over the year to the June quarter, petrol prices contributed a little under ½ a percentage point to inflation, while the direct effects of tax changes are estimated to have contributed a little under 3 percentage points, although the latter estimate is subject to considerable uncertainty. Thus CPI inflation excluding the effects of tax changes and petrol is estimated to be around 2¾ per cent on a year-ended basis.
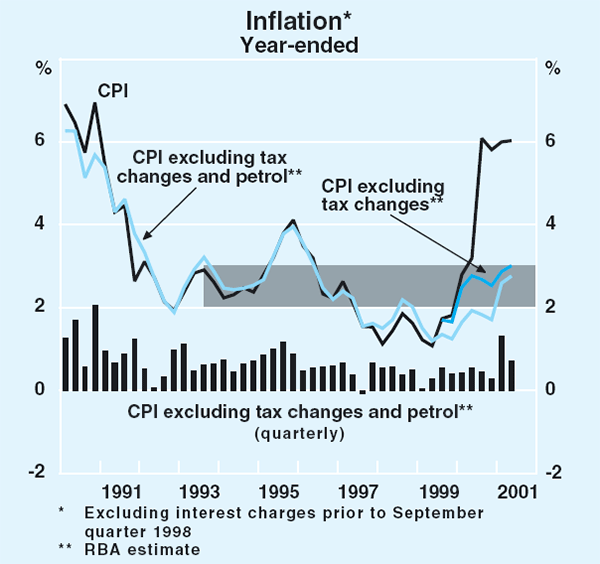
| Quarterly | Year-ended | ||||
|---|---|---|---|---|---|
| March quarter 2001 |
June quarter 2001 |
March quarter 2001 |
June quarter 2001 |
||
| CPI | 1.1 | 0.8 | 6.0 | 6.0 | |
| – Tradables | 1.4 | 1.4 | 4.8 | 5.2 | |
| – Non-tradables | 0.7 | 0.4 | 7.1 | 6.7 | |
| CPI excluding volatile items | 1.0 | 0.9 | 5.5 | 5.8 | |
| Market goods and services excluding volatile items | 0.8 | 1.0 | 5.5 | 5.9 | |
| Weighted median(a) | 0.9 | 0.9 | 5.4 | 5.9 | |
| Trimmed mean(a) | 0.9 | 0.9 | 6.0 | 6.3 | |
| CPI ex tax changes(b) | 1.1 | 0.8 | 2.9 | 3.0 | |
| CPI ex tax changes and petrol(b) | 1.3 | 0.7 | 2.6 | 2.8 | |
| (a) For details on the calculation of these measures, see ‘Measuring Underlying Inflation’,
RBA Bulletin, August 1994. (b) RBA estimate. Adjusts for the direct price effects of tax changes associated with the introduction of the new tax system. |
|||||
Measures of underlying inflation adjusted for tax are estimated to have been running at a similar annual rate, and also suggest that there has been an increase in the rate of underlying inflation during the first half of 2001. This pick-up seems, in part, to reflect the flow through of accumulated upstream price pressures related to the exchange rate depreciation over the past two years, as well as higher raw materials prices. It may also reflect some more general rebuilding of retailers' margins, given the improvement in economic conditions since the second half of last year. It is possible, however, that the increase could also reflect some delayed pass-through of GST-related price adjustments, although the size and timing of these effects will never be known precisely.
While price increases were recorded for many items in the quarter, there were some particularly large movements. Petrol prices rose by 3.2 per cent reflecting both the lower exchange rate and higher Asian-benchmarked oil prices, and beef and lamb prices rose by around 10 per cent due to tight world supply conditions and strong international demand for Australian meat. More recently, petrol prices at the pump have fallen sharply and global beef prices are showing signs of stabilising. Lower petrol prices are likely to subtract significantly from the CPI rise in the September quarter. The price of fruit and vegetables fell by 5.6 per cent in the June quarter, partially unwinding the weather-affected increase in the March quarter.
To a large extent, the increase in inflation in the past two quarters has reflected higher prices of tradable goods (Graph 68). In import-weighted terms, the Australian dollar has depreciated by around 15 per cent over the past two years, which has contributed to a large rise in the price of imported products (Graph 69). This has imposed higher costs on businesses using imported inputs, with large rises evident in the prices of inputs used in manufacturing industries and some flow-through to manufactured output prices. It has also imposed higher costs on retailers selling imported goods. Despite this, the consumer price of tradable goods rose only moderately over the course of 2000 (abstracting from the effects of the tax changes), probably due to competitive pressures and an expectation that the exchange rate depreciation was to be short lived.
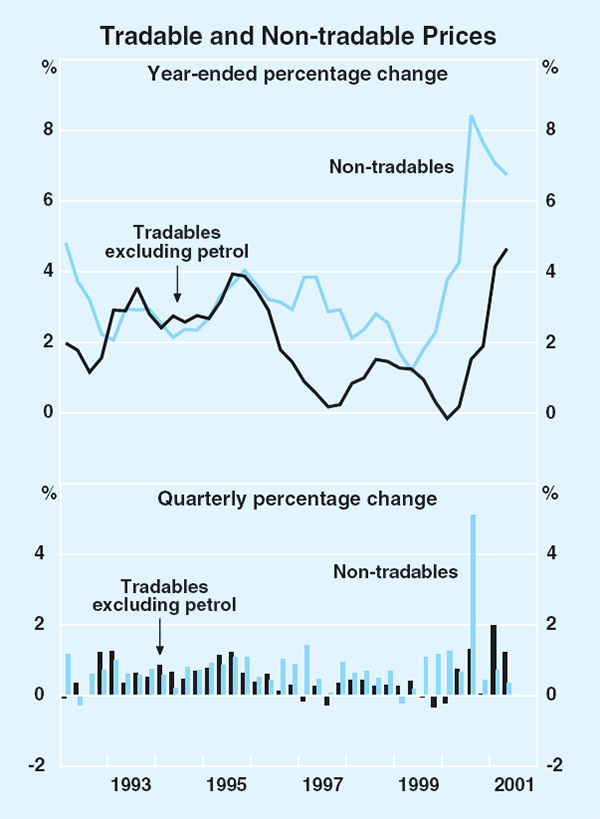
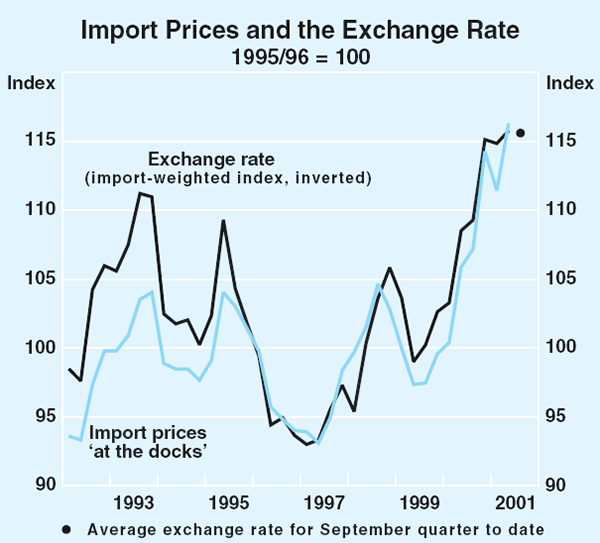
During the past two quarters, however, there has been a noticeable increase in the proportion of tradable items in the CPI that has recorded price increases (Graph 70). This may have reflected some degree of margin rebuilding in response to the sustained lower level of the exchange rate, as well as higher world prices for a number of goods. These factors have affected the retail prices of both imported items, such as motor vehicles, and domestically produced items with prices largely set in world markets, such as beef and lamb. The prices of motor vehicles, parts and accessories have risen particularly strongly over the past two quarters, with the price of imported cars having risen by around 5 per cent, the largest increase since 1994. The prices of a wide range of tradable products, such as books, toys, clothing and household furnishings have also risen, contributing to an increase in the price of tradable goods and services of 1.4 per cent in the June quarter, following a similar rise in the March quarter.
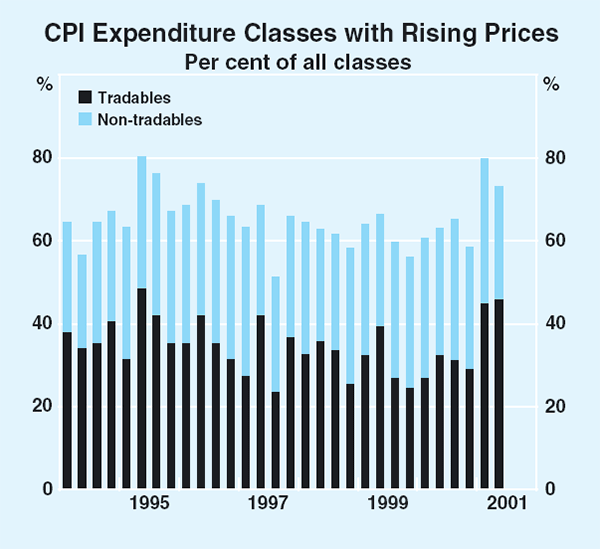
By contrast, the prices of non-tradable products have increased more modestly in recent quarters, in part held down by the house purchase component of the CPI. The price of house purchase fell by 0.3 per cent in the June quarter reflecting the additional $7,000 grant to first-home buyers of new dwellings, and lower building materials prices in line with the decline in activity in this sector since the middle of 2000. This has been partly offset by continuing strong increases in the price of insurance. Many other non-tradable components, however, have exhibited little price pressure over the past couple of quarters: the price of domestic travel and accommodation has recorded lower than usual growth, as have some utilities, and the price of communication services has continued to fall. Overall, the moderation in inflation in the non-tradable sector appears to reflect contained wages growth and a moderation in domestically sourced price pressures.
Producer prices
Following falls in the March quarter which were driven largely by lower world oil prices and softer world prices for some other products, producer prices rebounded in the June quarter, to grow at around the quarterly rates being recorded since mid 1999 (Graph 71, Table 14). The rise in the June quarter primarily reflected the impact of the lower exchange rate, some increase in oil prices and continued strength in world meat prices. Abstracting from these factors, domestic price pressures more generally appear to have remained modest. The prices of most domestically produced final stage products rose by less than ½ per cent in the June quarter, with many prices either unchanged or falling, indicating an easing in upstream price pressures from those recorded during last year. That said, the higher increases for producer prices overall are suggestive of some continuing pressure on retail margins.
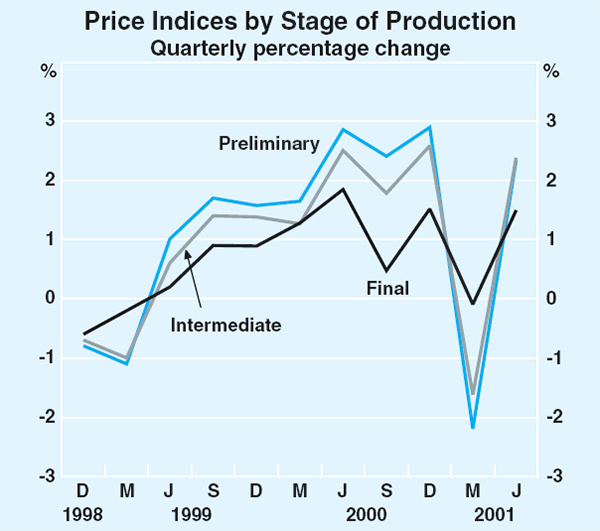
| Jun qtr 2001 |
Year to Jun qtr 2001 |
|
|---|---|---|
| Preliminary | 2.3 | 5.5 |
| – Domestic | 1.9 | 4.7 |
| – Imported | 5.0 | 11.0 |
| Intermediate | 2.4 | 5.2 |
| – Domestic | 2.0 | 4.4 |
| – Imported | 4.6 | 10.1 |
| Final(a) | ||
| Domestic | 1.0 | 2.2 |
| – Consumption | 2.0 | 3.0 |
| – Capital | 0.0 | 1.3 |
| Imported | 3.8 | 8.8 |
| – Consumption | 4.3 | 9.9 |
| – Capital | 3.1 | 7.6 |
| Total | 1.5 | 3.4 |
| – Consumption | 2.3 | 4.3 |
| – Capital | 0.6 | 2.5 |
| (a) Excluding exports | ||
Prices at the earlier stages of production have risen by 12 to 14 per cent over the past two years, with the imported components rising by around 25 to 30 per cent. By comparison, final stage prices have risen by a more moderate 9 per cent over the period. In large part this reflects the greater importance for final stage prices of labour costs, overheads and profit margins.
On an industry basis, the strength in producer prices in the quarter was concentrated in the manufacturing sector, with more moderate outcomes in the construction and services sectors. The cost of materials used in house building has remained broadly flat over the past year, after rising by more than 5 per cent over the year to June 2000, with the overall price of the output of the building industry moving in a similar fashion. In the services sector, continued rapid growth in the price of property services (reflecting buoyant real estate conditions) has been offset by moderate outcomes for the price of transport services. The price of business services recorded a large rise in the June quarter, although this seems to be seasonal and is driven by a rebound in the price of television advertising from low levels recorded in the March quarter. Abstracting from this effect, inflation in the business services component has also been moderate.
The major business surveys indicate that inflationary pressures have eased from the vigorous pace experienced in 2000, though they remain stronger than in the period 1996 to 1999 (Graph 72). The economy-wide NAB survey reports that quarterly growth in product prices eased to around 0.4 per cent in the June quarter, although expectations are that it will increase to 0.6 per cent in the September quarter. Surveys of manufacturers, such as that produced by ACCI-Westpac, also report that the proportion of firms who have raised their prices has eased over the past couple of quarters, although some rebound is expected in the September quarter given the continuing increases in production costs.
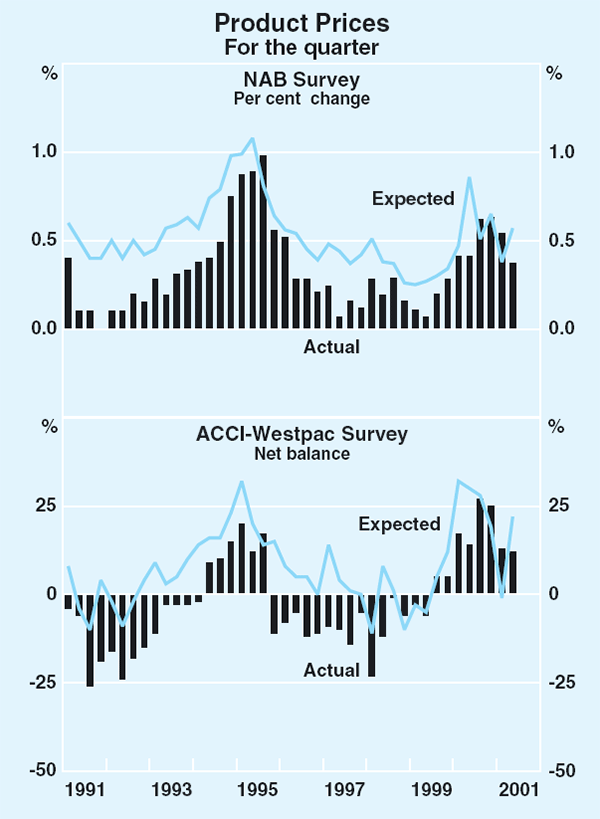
Labour costs
Most indicators suggest that wages growth picked up during the past year and a half, although the increases have been modest compared with previous episodes (Table 15). Growth in the Wage Cost Index (WCI) was 3.7 per cent over the year to the March quarter, up from 3.4 per cent over the year to the December quarter 2000. Most of the pick-up in the March quarter was due to stronger growth in public-sector wages, particularly in the education sector. Growth in the private-sector component of the WCI edged up slightly in the March quarter, to 3.6 per cent on a year-ended basis, continuing an upward trend that is likely to reflect the delayed impact of tighter labour market conditions in mid 2000 (Graph 73).
| Sep qtr 2000 |
Dec qtr 2000 |
Mar qtr 2001 |
|
|---|---|---|---|
| Wage cost index(a) | |||
| Private | 3.1 | 3.5 | 3.6 |
| Public | 2.9 | 3.1 | 3.8 |
| Total | 3.1 | 3.4 | 3.7 |
| Average weekly earnings survey | |||
| AWOTE | 6.1 | 5.1 | 4.6 |
| AWE | 6.8 | 5.2 | 5.6 |
| MCED survey | |||
| Total base salaries | 4.4 | 4.4 | 4.3(c) |
| of which: Executives | 4.6 | 4.8 | 4.5(c) |
| Federal enterprise agreements(b) | |||
| New agreements | |||
| – Private | 3.9 | 4.1 | 3.6 |
| – Public | 4.3 | 3.7 | 3.8 |
| – Total | 4.1 | 3.9 | 3.7 |
| Current agreements | |||
| – Private | 3.7 | 3.7 | 3.7 |
| – Public | 3.6 | 3.6 | 3.7 |
| – Total | 3.6 | 3.7 | 3.7 |
|
(a) Total pay excluding bonuses Sources: ABS, DEWRSB, MCED |
|||
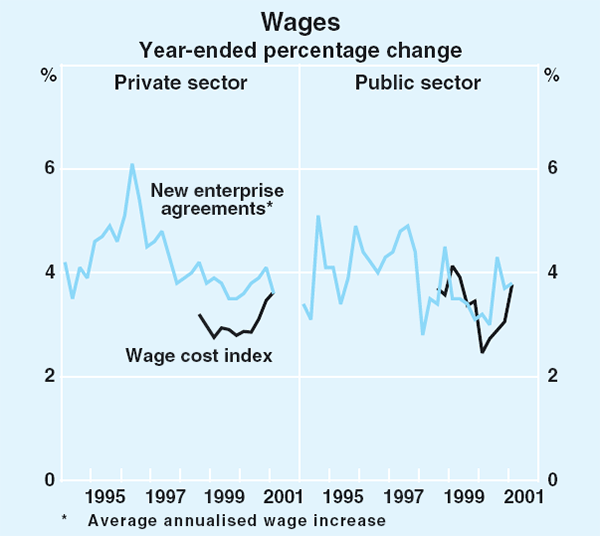
While growth in the national accounts measure of average compensation per employee also increased in the March quarter, this measure exhibits considerable volatility. Excluding lumpy and irregular payments, the pace of wage growth recorded in the national accounts was around 3½ per cent over the year to the March quarter, around the same as that recorded in the middle of last year. Growth in average weekly ordinary-time earnings (AWOTE), on the other hand, has eased over recent quarters from earlier high rates, although this probably reflects the effect of compositional change more than underlying developments.
The latest data on federal enterprise agreements also suggest that wage pressures remain well contained. The average rate of wage growth provided by new federal enterprise agreements eased in the March quarter, to an average annual rate of 3.7 per cent. New private-sector agreements contained wage increases that were noticeably lower in the March quarter, at 3.6 per cent, down from 4.1 per cent in the previous quarter, partly due to compositional effects: there were some large retail agreements, which in recent years have typically recorded lower than average outcomes, certified in the quarter. In the construction and manufacturing industries, average wage increases in new enterprise agreements eased in the March quarter following the weakening in demand conditions in these sectors in the second half of 2000. The aggregate wage increase implied by the stock of all current federal enterprise agreements has remained steady at 3.7 per cent.
Indications are that wages growth may have eased more recently, in line with the weakening in the labour market since mid 2000. The Mercer Cullen Egan Dell (MCED) Salary Review reports that the average wage increase paid to office workers and executives declined slightly in the June quarter, to year-ended rates of 4.3 per cent and 4.5 per cent, respectively. The business surveys have also suggested that growth in labour costs slowed in the June quarter and businesses expect this trend to continue in the September quarter. Both the NAB survey and the ACCI-Westpac survey of manufacturers report that the difficulty of attracting suitable labour has eased in recent quarters.
Inflation expectations
The inflation expectations of consumers have returned to levels recorded a couple of years ago, after the strong rises associated with the introduction of the GST (Graph 74). The Melbourne Institute indicates that consumers' median expectation for inflation has averaged a little under 4½ per cent over the past few months, down from the peak of over 8 per cent in May 2000. The data have been quite volatile in recent months, behaving in a somewhat similar manner to that recorded in 1998. This reflects the fact that roughly equal proportions of respondents are nominating figures either in the 2 to 3 per cent range or around 5 per cent, and few respondents are nominating a 4 per cent figure, when asked about how much prices will rise over the next year. Small changes in the proportion of respondents in each category can thus cause a relatively large shift in the median inflation expectation. Over the past decade, the median response has consistently exceeded the actual rate of inflation, due to the presence of a number of respondents who continue to expect that inflation over the next year will be 5 or 10 per cent.
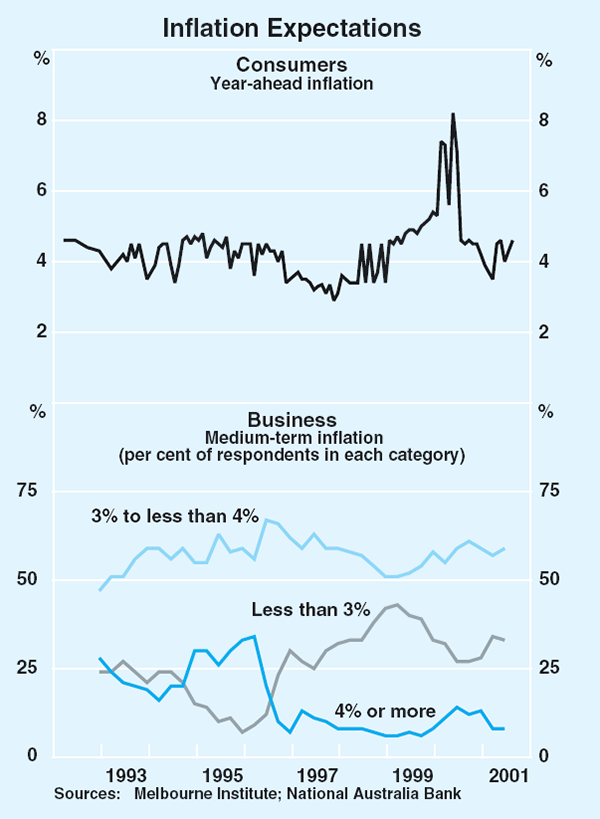
Most financial-market economists surveyed by the Bank revised up their inflation forecasts with the release of the higher-than-expected June quarter CPI. They now expect inflation to remain within the 2 to 3 per cent band over the next year rather than falling just below 2 per cent as previously anticipated. The median inflation forecast for the year to June 2002 increased from 1.9 per cent in the May survey to 2.3 per cent in the latest survey (Table 16). Most respondents' forecasts still incorporate the assumption that over the next couple of years, the exchange rate will appreciate and the oil price will decline. Trade union officials, as surveyed by the Australian Centre for Industrial Relations Research and Training (ACIRRT), have revised down their expectations for inflation over the year to June 2002 in the August survey, partly unwinding the sharp increase reported in the May survey. Nevertheless, union officials generally expect inflation to remain high over the next two years.
| Year to June 2002 | Year to June 2003 | ||||
|---|---|---|---|---|---|
| February 2001 |
May 2001 |
August 2001 |
August 2001 |
||
| Market economists(a) | 2.0 | 1.9 | 2.3 | 2.5 | |
| Union officials(b) | 3.5 | 4.5 | 4.0 | 3.8 | |
| (a) RBA survey (b) ACIRRT survey |
|||||
Businesses expectations for medium-term inflation in the June quarter remained largely unchanged from the March quarter, and are broadly similar to those of around a couple of years ago. The NAB survey indicated that less than one in ten respondents expected inflation to average more than 4 per cent, while one-third of respondents expected inflation to be below 3 per cent. Longer-term inflation expectations of financial market participants, measured by the difference between nominal and indexed 10-year bond yields, have been broadly unchanged over the past three months at around 2½ per cent.
Inflation outlook
Higher-than-expected inflation outcomes in the past two quarters have followed the lower than expected outcomes in the previous two quarters. The uncertainties in disentangling the effects of the tax changes, coupled with the recent volatility in the inflation data, mean that any judgement about the rate of underlying inflation is subject to considerable uncertainty. It is possible that recent outcomes reflect some lingering effects of the earlier tax changes, but at this stage the more likely cause seems to be some pass-through of the accumulated upstream price pressures of the past couple of years. As such, the Bank's assessment is that the underlying pace of inflation, net of the effects of tax changes and movements in petrol prices, has stepped up from around 1½ per cent a couple of years ago to around 2¾ per cent currently.
Higher prices have been concentrated in the tradable sector in the past two quarters, with inflation in the prices of non-tradable goods and services much more quiescent. There have been conspicuous price rises both for items with a high imported content, such as motor vehicles, and for items which, although domestically produced, have prices that are largely set in world markets, such as meat products. The price increases over the first half of the year suggest that businesses have been able to rebuild margins that had been squeezed in the second half of 2000 by the effects of the lower exchange rate and higher input prices, most notably for oil. Despite the recent margin rebuilding, it is likely that the lower exchange rate will contribute to further pressure on retail prices in the period ahead, given the extent of its decline over the past two years, the resulting rise in import prices across the docks and the higher upstream prices as indicated by producers.
However, there are a number of factors that should act to counterbalance these pressures. There are signs that the slowing world economy is placing some downward pressure on the prices of some commodities (such as oil and base metals) and manufactured goods (for example, in the information technology and communications area). Domestically, firms may find it difficult to continue to raise prices significantly while there remains appreciable spare capacity in the economy (although the recent corporate exits in the insurance, telecommunications and airline industries may take the edge off the intense competitive pressures that have been present in these industries in recent years). Wages growth is unlikely to rise further in the near term in light of current and prospective conditions in the labour market.
On balance, the Bank's expectation is that, net of taxes and petrol prices, underlying inflation will remain around the top of the 2 to 3 per cent medium-term target band for the rest of 2001, before easing gradually in 2002 as the upstream pressures wane leaving the more moderate domestic price and wage pressures as the main influence on inflation. CPI inflation is likely to be a little lower than this, largely reflecting the recent decline in petrol prices from earlier peaks. This assessment is based on the usual technical assumptions that the exchange rate remains around recent levels and that the oil price remains around US$27 per barrel (West Texas Intermediate).
While this is judged to be the most likely scenario, risks in both directions can be identified. On the one hand, inflation could be higher than forecast if domestic cost pressures accelerated, rather than remaining contained. The likelihood of this outcome would increase were aggregate demand to grow more quickly than expected at a time when inflation was already relatively high. In the other direction, if global economic conditions continued to weaken, and this affected Australia's aggregate demand significantly, prices for both tradable and non-tradable products would be expected, in due course, to moderate. In this scenario, inflation during 2002 could (on standard assumptions) be lower than forecast above. At the present time, the Bank judges these risks to be about evenly balanced.
Footnote Box D
See remarks by Federal Reserve Board Governor Laurence Meyer in April 2000, <http://www.federalreserve.gov/boarddocs/speeches/2000/20000412.htm.> [1]