Reserve Bank Bulletin – November 2000 Statement on Monetary Policy
Download the complete Statement 701KB
The Australian economy has continued to record a strong performance during 2000. While many of the economic statistics have been affected by the impact of unusual events, such as the introduction of the new tax system, and the Olympic Games, the underlying rate of growth of GDP still appears to have been over 4 per cent. This has been associated with fast growth in employment over much of the year, and a significant further decline in the unemployment rate.
Conditions have been particularly favourable for Australian exporters, with world economic growth at its strongest for a decade. This strength owes a good deal to the acceleration in the US economy during the first half of the year, but stronger performances in Europe, east Asia and Japan have also contributed. Most commodity prices have firmed in foreign currency terms and, along with the depreciation in the Australian dollar, have contributed to the value of exports rising by 25 per cent over the past year (abstracting from the recording of Olympic effects in the month of September).
In 2001, most international forecasters expect some moderation in world growth from the exceptionally strong pace recorded this year. Current indications are that a moderation is indeed occurring, with the clearest evidence for this being the slowing in the US economy since mid year. This slowing is widely seen as desirable in order to forestall possible further increases in US inflation. Provided the other major economies can sustain a good pace of growth in domestic demand, the result will be a moderate decline in overall world growth, and a ‘re-balancing’ between the major economies in a generally beneficial direction.
Several risks to the international outlook have been identified, including the effects on growth and inflation from oil prices and the possibility of a disorderly asset market correction in the US. The failure of corporate earnings, particularly of ‘technology’ companies, to meet very optimistic expectations has produced a considerable change in sentiment in global financial markets over recent months. The mood swing has been most pronounced in the US where markets are behaving in a way which indicates that they expect adverse movements in economic and financial conditions. Share prices have weakened, market interest rates, both at the short and long ends of the yield curve, have fallen, credit spreads in debt markets have widened, and new issues of debt and equity in capital markets have slowed. The one aspect of the US economy that has not changed is the behaviour of the US dollar, which has continued to rise strongly against nearly all other major currencies.
Some of this change in mood has flowed through to Australian financial markets. But, on the whole, financial conditions here have been much more stable than in the US, looked at in terms of either share prices, interest rates or credit spreads. The relatively better performance of Australian markets has not yet been reflected in the exchange rate of the Australian dollar, perhaps because, as noted, sentiment towards the US dollar has not changed yet. The local currency has fallen by 15 per cent against the US dollar over the past six months or so, but only a little against most other floating currencies of industrial countries – a pattern which leads to the conclusion that most of the fall experienced in the bilateral rate has been a reflection of US dollar strength.
Domestic demand in Australia is slowing from its earlier exceptionally rapid pace. Over the year to the June quarter, final demand increased by almost 6 per cent. While it is still proving quite difficult to assess accurately the underlying rate of growth, a more moderate pace is to be expected in the ensuing four quarters. This mainly reflects a fall in spending on dwelling investment following the exceptionally high levels of activity in the first half of 2000 prior to the introduction of the GST, but also some moderation in the pace of growth of public spending. With the boost still being received from the trade sector, this should result in strong growth in GDP over the year ahead, although this at present appears likely to be at a slower pace than the 4¾ per cent average rate of growth over recent years. This outlook is, as always, contingent on the international environment not deteriorating markedly.
The September quarter CPI rose by 3.7 per cent, for an increase of 6.1 per cent over the year. The quarterly and annual results are affected by the tax changes, and also by the large rise in the price of petrol. The quarterly result was nonetheless lower than generally expected, and appears to reflect, for the most part, a smaller short-term effect of the tax changes than was considered likely a few months ago. There are no definitive data on the exact impact of the tax changes on the CPI, and the range of measures of core or underlying inflation typically used to assess inflation trends are also affected. But making allowances for them as best it can, the Bank's preliminary assessment is that core inflation, net of tax effects, was of the order of 2¼ per cent over the year to the September quarter. Over the preceding few quarters, annual rates of underlying inflation had been rising, but that trend has not apparently continued in the most recent results.
The problem of disentangling the tax effects from ‘ongoing’ price changes may persist for some time yet. The apparently smaller than anticipated impact of the GST may reflect a decision by companies to absorb part of the impact, with the intention of passing it on later. Or it may be that the reduction in prices flowing from the elimination of wholesale sales taxes has occurred more quickly than expected. In either case, future CPI rises would, other things equal, be higher than hitherto expected. Alternatively, it is possible that the original estimates of the GST's effects were too large.
Prices appear to have been affected to a relatively small extent, as yet, by the depreciation of the exchange rate. While it usually takes some time for such effects to show up, this result suggests that there may be some squeeze on profit margins for those selling imported products. If so, higher final prices may still be observed in due course, although the experience of recent years is that such effects have tended to be more muted than was the case in earlier times.
With all these difficulties of interpretation, assessing the outlook for inflation is unusually difficult. CPI inflation measured on a year-ended basis will remain high until the impact of the tax changes drops out of the annual calculation at this time next year, at which time it will fall back. Whether or not it will be consistent with the 2–3 per cent target thereafter will be affected by several considerations, not least the course of oil prices and the exchange rate. At present, the Bank (like most other forecasters) assumes that oil prices will decline somewhat in 2001, helping to bring about a partial reversal of the petrol price impacts on the CPI observed over the past year.
On the other hand, the low level of the exchange rate, if it were to persist, would make for upward pressure on inflation, depending on the extent to which foreign suppliers and importers were prepared to accept a reduction in their margins. On the assumption that a substantial degree of pass-through occurred, underlying inflation could be around 3 per cent at the end of next year, with CPI inflation temporarily slightly below that, due to the assumed decline in oil prices. All of this assumes that there will be no response of wages to the GST effects or other factors temporarily pushing up CPI inflation. This assumption still appears to be valid at this time, although it naturally is kept under continual review, as are all assumptions underlying the inflation forecast.
With this outlook, the monetary policy decision has been finely balanced, and the Bank has not made a change to interest rates since August. The earlier increases appear to be having some dampening impact on credit demand and some asset markets. The more moderate growth in domestic demand which appears to be in prospect lessens, at the margin, the extent to which inflationary pressures are likely to build over the year ahead. At the same time, the current level of the exchange rate increases the risk that inflation could breach the target, once the direct GST effects have passed. In the period ahead, the Bank will continue to assess the balance of risks to the outlook, and direct policy to the medium-term goal of low inflation, with sustainable growth.
International Economic Developments
The world economy strengthened in the first half of the year, with better than expected outcomes being recorded in all major regions, including Australia's major trading partners. As a result, forecasts for world output growth were revised higher by many commentators, including the IMF who are expecting world output growth of 4.7 per cent in 2000 – half a percentage point higher than expected six months earlier (Table 1, Graph 1).The IMF expects world growth to slow in 2001, as growth in the US slows from around 5 per cent to 3 per cent, but still remain above its long-term average.
| 1998 | 1999 | 2000(f) | 2001(f) | |
|---|---|---|---|---|
| United States | 4.4 | 4.2 | 5.2 | 3.2 |
| Euro area | 2.7 | 2.4 | 3.5 | 3.4 |
| Japan | −2.5 | 0.2 | 1.4 | 1.8 |
| Newly Industrialised Economies(a) | −2.3 | 7.8 | 7.9 | 6.1 |
| ASEAN-4(b) | −9.3 | 2.6 | 4.5 | 5.0 |
| World | 2.6 | 3.4 | 4.7 | 4.2 |
| Memo item: | ||||
| Inflation(c) | 1.5 | 1.4 | 2.3 | 2.1 |
|
Source: IMF World Economic Outlook, October 2000, using PPP exchange rates |
||||
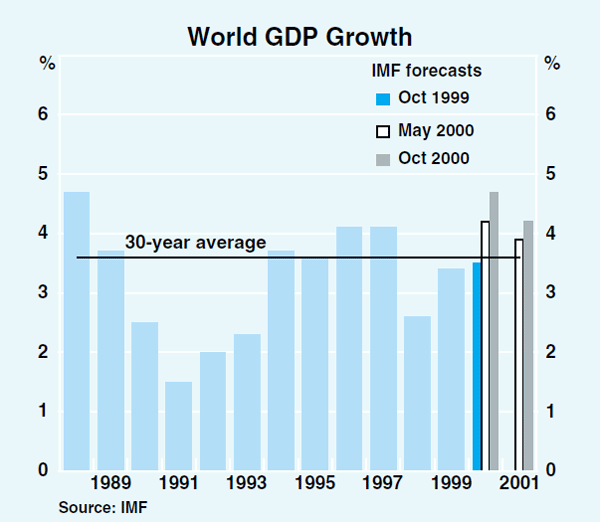
The process of upward revision to expectations for the world economy that has been occurring over the past two years appears to have run its course, with some commentators suggesting higher risks of a substantial slowdown in 2001 than that currently expected.
One risk to the outlook, identified by the IMF, is the possibility of a disorderly adjustment in international equity and foreign exchange markets. In addition to the adverse effects on the advanced economies, such developments could also jeopardise the recoveries in the emerging market economies. Another risk is a sustained high price for oil, which has recently reached its highest level since the Gulf war. The IMF estimates that world growth in 2001 could be up to half a percentage point lower if oil prices remain above US$31 per barrel, instead of declining as projected. Box A examines the likely effects of a sustained higher level of oil prices in some detail.
Primarily as a result of higher oil prices, consumer price inflation has picked up to around 2¼ per cent in the advanced economies over the year to August 2000, from around 1½ per cent a year earlier. However, abstracting from the direct influence of oil, inflation remains generally subdued despite the strong growth of the world economy.
United States
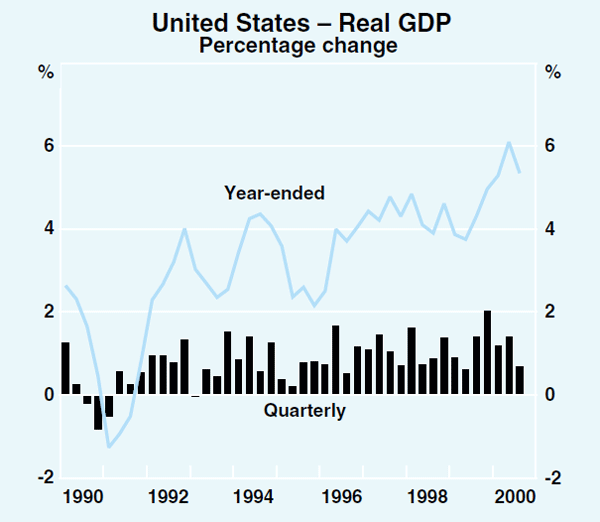
The US economy continues to grow at a strong pace despite GDP growth easing in the September quarter (Graph 2). The effects of the 175 basis points increase in the Fed funds rate since June last year have been evident in the housing sector, and the added effects of higher oil prices and the appreciation in the exchange rate have contributed to a slowdown in the part of the manufacturing sector which is not involved in producing computer-related goods. But growth in household consumption remains robust, and export growth has also been strong over the past year, despite the appreciation of the exchange rate. Reflecting the ongoing strength of demand, the current account deficit widened to around 4¼ per cent of GDP in the June quarter.
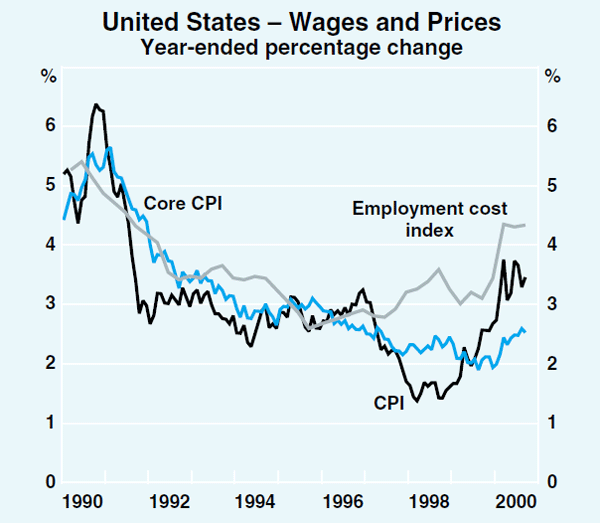
While consumption has eased from its very rapid pace of growth earlier in the year, it is still growing strongly, supported by the high level of consumer confidence, and the tightness of the labour market. Household incomes have been bolstered by the pick-up in wages growth over the past year: the Employment Cost Index rose by 0.9 per cent in the September quarter and is now 4¼ per cent higher than a year ago. Against this, the decline in share prices over the course of this year should reduce the impetus to household spending from wealth gains that has occurred over the past few years, though wealth still remains at a high level.
Much of the growth in business investment over the past year has come from increased spending on computer equipment and software, and orders for IT capital equipment point to continued rapid growth in investment in the near term. Output growth of the computer-related sector has also been an important contributor to growth in industrial production in recent quarters: while total manufacturing production increased by 6¼ per cent over the year to September, growth excluding computer-related output was just under 1 per cent. The National Association of Purchasing Managers' survey suggests that the outlook for the non-IT manufacturing sector is not particularly favourable.
Consumer price inflation picked up to 3½ per cent over the year to September, principally due to higher oil prices (Graph 3). To date, the increase in energy prices has had only a limited effect on core measures of inflation, which have increased by around half a percentage point from the second half of last year, but have remained at an annualised rate of around 2½ per cent in recent months. The absence of any significant increase in core inflation has been aided by the appreciation of the US dollar and subdued growth in unit labour costs – while wages growth has picked up, this has been matched by increases in productivity.
Japan
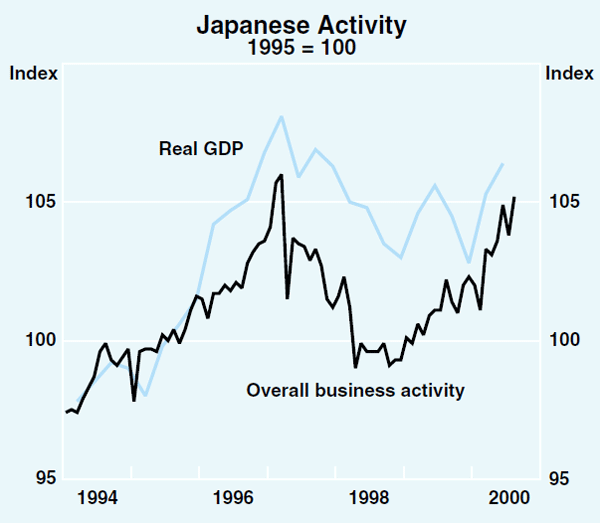
The recovery in Japan appears to have consolidated in the first half of the year, with the national accounts recording an increase in GDP of 1 per cent in the June quarter following growth of 2½ per cent in March. Private consumption and exports both contributed significantly to growth in the first half of the year (Table 2). Alternative measures of activity paint a similar picture of economic recovery (Graph 4). The Ministry of International Trade and Industry's overall business activity index increased by 4 per cent over the six months to August. The Bank of Japan's Tankan survey also continued to indicate improved prospects for business. Despite these positive developments, risks remain: recent developments in the financial sector may restrict the amount of intermediated funding available to business, and the pick-up in consumption growth may be limited by the slow growth of household incomes.
| Six months to: | ||
|---|---|---|
| December 1999 | June 2000 | |
| Private consumption | −2.2 | 3.4 |
| Government consumption | 0.1 | −0.1 |
| Business fixed investment | 0.5 | 0.4 |
| Residential investment | −0.7 | 0.4 |
| Public investment | −2.4 | 0.8 |
| Changes in stocks | −0.3 | 0.4 |
| Net exports | −0.2 | 1.7 |
| – Exports | 1.6 | 2.9 |
| – Imports | −1.8 | −1.2 |
| GDP | −5.2 | 7.2 |
|
Source: Datastream |
||
The latest Tankan survey suggests that the recovery in business investment is likely to continue. The survey reported an improvement in business confidence, a pick-up in capital expenditure intentions and more positive perceptions about access to finance. In addition, exporters have benefited from the recovery in east Asia – exports to that region increased by 21 per cent over the year to September.
The outlook for consumption is more uncertain. Consumption spending appears to have weakened after growing strongly in the first half of the year. Household incomes have only grown slightly over the year to September because of a decline in employment and weak growth in wages. Nevertheless, consumers are more confident about their employment prospects and the economy generally, despite the historically high unemployment rate.
The government's expansionary fiscal stance is set to continue in the near term, with the announcement of a further supplementary budget – to be finalised this month – which will contain additional spending of around 0.8 per cent of GDP. The size of the planned package is relatively modest, but should help to ensure that public expenditure does not significantly reduce growth in the period ahead.
Consumer prices continued to fall on a year-ended basis, declining by 0.8 per cent over the year to September. The sustained strength of the yen and comparatively efficient energy consumption have helped to offset the inflationary pressures stemming from the increase in oil prices.
The Bank of Japan raised the overnight call rate to 0.25 per cent in August, terminating the zero interest rate policy that had been in place since February last year. In reaching this decision, the Bank cited the decreased risk of deflationary problems as the economic recovery, led by the pick-up in business investment, continued. The Bank of Japan still expects prices to fall slightly over the year to March 2001.
Non-Japan Asia
The strong growth experienced in non-Japan Asia in 1999 has continued into 2000, with GDP in the region increasing by 8 per cent at an annualised rate over the first half of the year (Table 3). In some countries, most notably Korea, there are signs that growth may be starting to ease back to a more sustainable pace, after the very rapid expansion in the initial phase of recovery. Exports and then consumption provided the initial stimulus to growth in the aftermath of the crisis. Now a recovery in private investment is also underway in all countries in the region except Indonesia and the Philippines.
| Six months to: | ||
|---|---|---|
| December 1999 | June 2000 | |
| Hong Kong | 12.5 | 9.1 |
| Indonesia | −4.9 | 14.1 |
| Korea | 12.8 | 5.9 |
| Malaysia | 4.3 | 13.4 |
| Philippines | 4.0 | 4.8 |
| Singapore | 2.9 | 13.2 |
| Taiwan | 3.9 | 7.0 |
| Thailand | 9.2 | 4.3 |
| Total | 7.0 | 8.0 |
|
Source: CEIC |
||
Nonetheless, there remain significant divergences in economic performances across the region (Graph 5). One source of this divergence is the difference in export composition, particularly in terms of electronic goods. In Malaysia, electronic goods account for over 30 per cent of exports, while they represent only around 3 per cent in Indonesia. Much of the pick-up in industrial production in Korea, Malaysia and Taiwan since early 1999 has been in the electronics sector (Graph 6). While these three economies remain vulnerable to any slowdown in the global electronics market, Indonesia, and to a lesser extent, Thailand have not benefited from the strong global demand for electronic goods.
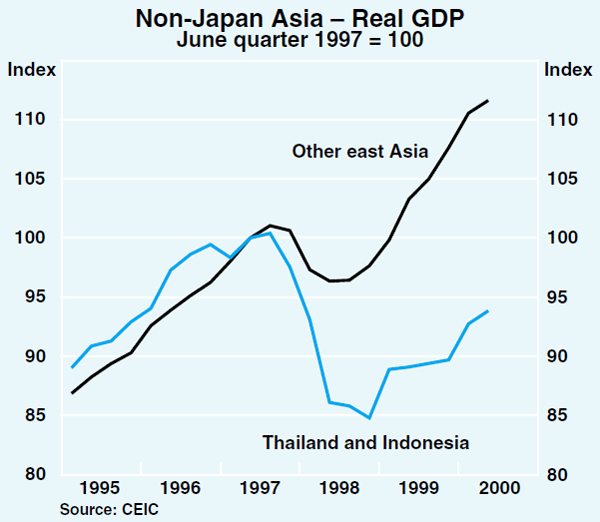
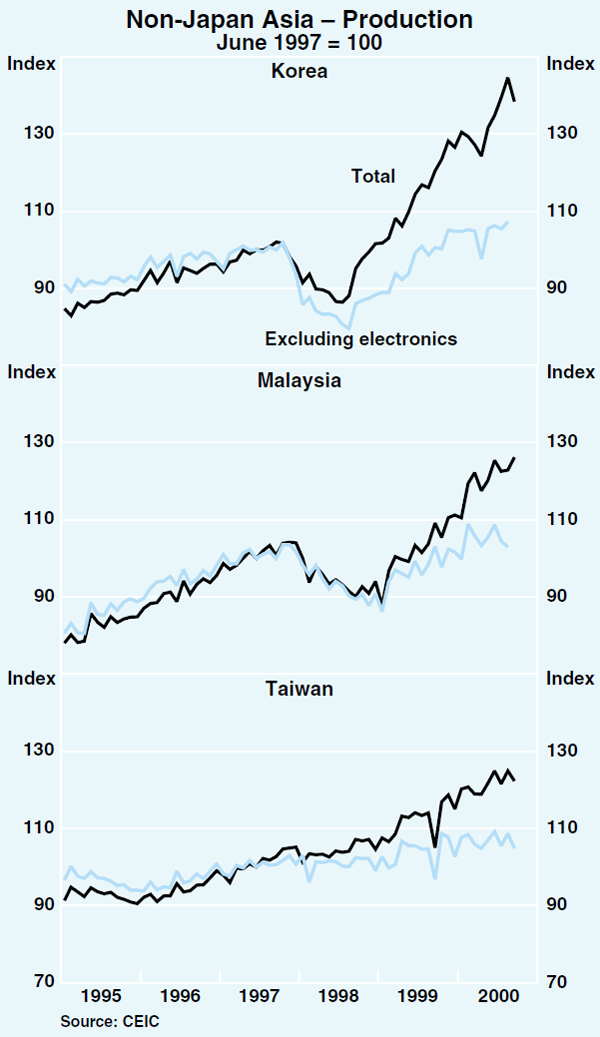
Another cause of the divergent economic performance has been the varying sizes of the required financial and corporate restructuring and the extent of progress that has been made. The World Bank estimates that in Indonesia and Thailand, the ratio of non-performing loans to total loans has fallen to 40 per cent and 32 per cent (as at June 2000), but is still well above estimates for Korea and Malaysia (12 per cent and 16 per cent respectively). The fragile state of the banking sectors in Indonesia and Thailand is making it difficult for banks to provide new finance to the private sector and therefore may be retarding the speed of their recoveries.
Inflation has edged up throughout the region, in large part the result of higher oil prices. Consequently, some countries have begun tightening monetary policy. The Bank of Korea raised its key interest rate by ¼ of a per cent in October – the first rise in eight months. Although inflation has picked up from its low levels of 1999, core inflation remains within the Bank's newly established target for inflation of 2.5 per cent ± 1 percentage point.
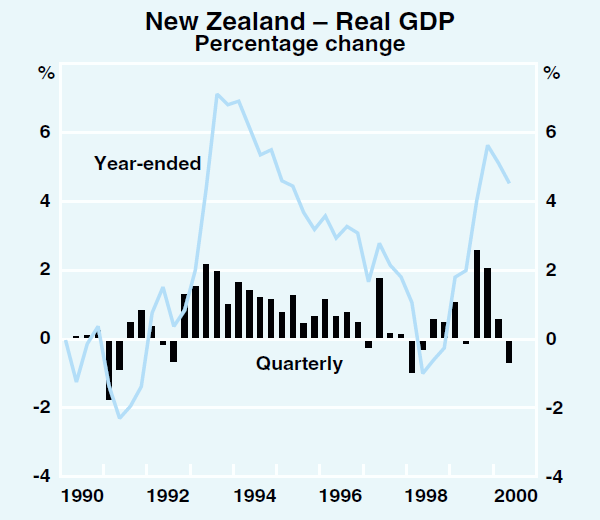
After strong growth in the second half of 1999, the New Zealand economy contracted slightly in the first half of 2000 (Graph 7). Much of the weakness has been in domestic demand, reflecting subdued private consumption and, in the June quarter, a 23 per cent decline in housing investment. Business confidence has fallen sharply since the beginning of the year and is around its lowest level in ten years; consumer confidence has also fallen considerably. In contrast, employment growth rebounded strongly in the September quarter and the export sector remains robust, underpinned by strong external demand, the lower New Zealand dollar and a good agricultural season.
Europe
In the euro area, output grew strongly for the fourth consecutive quarter in June, increasing by 0.8 per cent, to be 3.7 per cent higher over the year. Export growth has continued to benefit from the depreciation of the euro, and has helped underpin the recovery in employment and solid growth in consumption in the region over the past year. Inflation has been boosted by the rise in oil prices to be 2.8 per cent higher over the year to September. Core inflation, at 1.4 per cent over the year, has risen only slightly, while growth in labour costs remains contained. Reflecting ongoing concern over oil prices, import costs and strength of the euro-area economy, the ECB raised interest rates on two occasions over the past three months by a total of half a percentage point.
In the UK, GDP has continued to grow at a solid pace over the past year. Growth in recent years has been underpinned by steady consumption growth, driven by robust growth in employment and earnings, as well as high levels of consumer confidence. Exports have also picked up strongly through the past year. While consumer prices have increased by over 3 per cent in the past year, underlying inflation is more subdued and remains below the Bank of England's target rate of 2.5 per cent.
Box A: Oil Prices and Economic Performance
Oil prices have risen to their highest level for about ten years in recent months (Graph A1). At over US$30 per barrel, oil costs about three times as much as it did at its low point in late 1998. That twenty-year low in oil prices was a result of a combination of an increase in the supply of oil from OPEC in early 1997, and a fall in demand for oil shortly thereafter as a result of the Asian crisis. An increase in demand as the world economy has recovered, and decisions by OPEC to reduce supply, helped to push prices higher during 1999. During 2000, ongoing growth in demand, concerns about the low levels of world oil inventories and limited global refining capacity have seen the price of oil continue to rise. In response to the rise, OPEC has increased its production quotas four times this year. At present, however, oil prices remain high and are over 60 per cent higher than their average for the past three years.
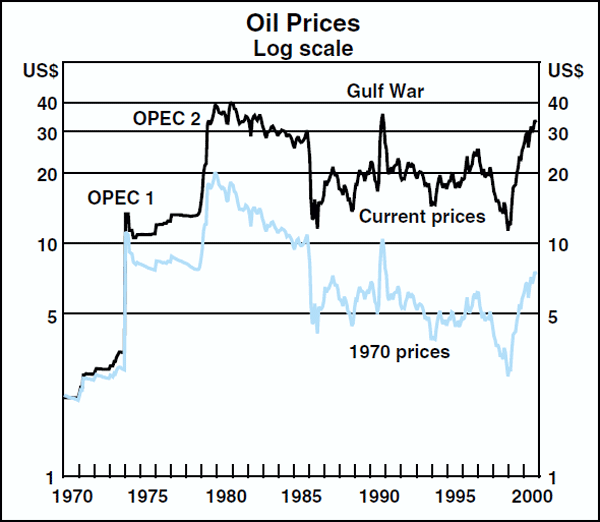
This rise, while very substantial, is not of the same order of magnitude as those seen in the oil price ‘shocks’ of the mid and late 1970s. Nonetheless, if oil prices remain high, they can be expected to put upward pressure on global inflation rates and to have some dampening influence on global economic growth. The pressure on prices results from the direct impact on price indexes of the higher prices for household expenditure on petrol, and from the indirect impact on prices for a range of goods and services which embody transportation costs. The direct effect has added about 1 percentage point or so to CPI inflation over the past year in most countries, with further effects likely in the short term. The indirect impact may take somewhat longer to come through. It might be mitigated to some extent by a short-term compression of profit margins, or partly offset by other cost savings.
The effects on economic activity arise firstly because the rise in oil prices pushes up the cost of production. As such, it represents a reduction in the aggregate supply of goods and services that can be sustained at any given price level in the industrialised economies. Absent an offsetting demand expansion, this means that production will be lower, and prices higher, than otherwise. Moreover, since the rise in oil prices represents a loss of income to oil consumers, it is likely that aggregate demand in energy-consuming countries will be weaker than otherwise. This income is transferred to oil producers, who are then likely to expand their own demand for goods and services, providing some offsetting impetus to the contraction in oil-consuming regions. The net result of all these forces is that world economic growth is likely to be lower, and inflation higher, than would otherwise have been the case.
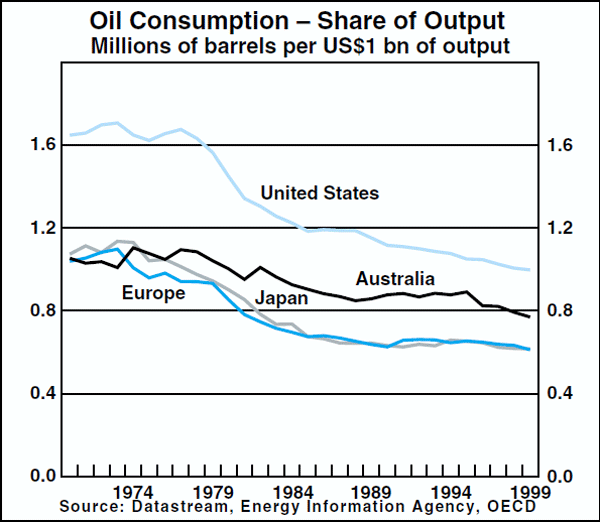
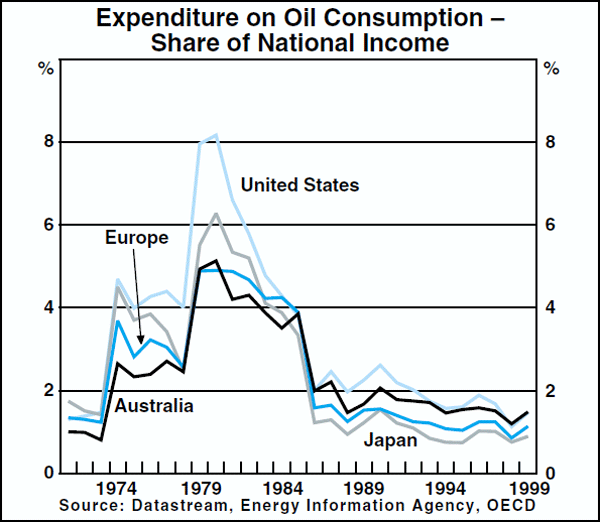
The recent rise in oil prices is smaller, in proportionate terms, than those which occurred in the mid and late 1970s episodes. For this reason, the impact on global growth and inflation should be considerably smaller than on those occasions, unless the price of oil were to rise much further. In addition, most advanced economies have become relatively more efficient in their use of oil, largely as a response to the earlier rises in oil prices. Graph A2 shows how the quantity of oil consumed per unit of real GDP has declined over time, so that although the price of oil remains much higher than it was prior to the OPEC 1 increase, the share of total income devoted to spending on oil has returned to pre-OPEC 1 levels (Graph A3).
The effects on individual economies and regions can be expected to vary, depending on the pattern of their production and the extent to which they rely on imported, as opposed to domestically produced oil. It is important to note that a number of developing economies have probably increased their reliance on oil as a result of rapid industrialisation over the past two decades.
In Australia's case, the effects of rising oil prices are likely to be less contractionary than for most other advanced countries. While Australia has in recent years been a small net importer of oil, it is a substantial net exporter of natural gas (Table A1), the price of which is linked to the price of oil. Hence there is a net transfer of income towards Australian producers from world consumers. All other things equal, this would tend to impart a stimulus to the Australian economy, though the transfer within Australia from energy consumers to producers might be a dampening influence in the short term. Should the price of oil remain high for some time, it is also possible that prices for other energy sources such as coal could increase, as has tended to occur in the past.
| Exports | Imports | |
|---|---|---|
| Petroleum | 7.1 | 7.5 |
| Gas | 2.6 | 0.1 |
| Coal | 8.3 | 0.0 |
International and Foreign Exchange Markets
Interest rates
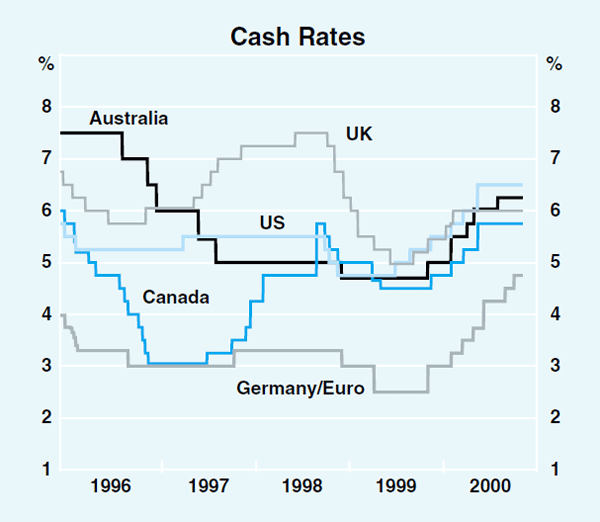
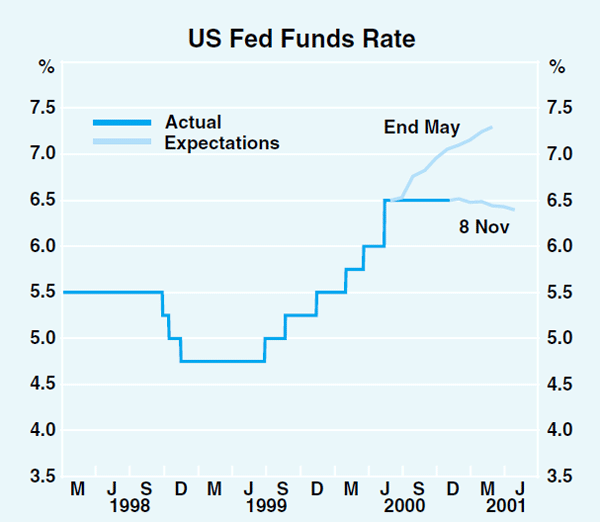
The process of global monetary tightening that began in the United States in June last year has slowed over recent months (Graph 8 and Table 4). After raising the Fed funds target by 175 basis points to 6.5 per cent in the 12 months to May 2000, the Federal Reserve has since left US rates unchanged, as signs have emerged that growth of aggregate demand in the US has slowed. Financial markets have begun to price in the possibility that US official interest rates could start to fall in early 2001 (Graph 9).
| 6 months to Nov 1999 | 6 months to May 2000 | 6 months to Nov 2000 | Total since June 1999 | Current level (%) | |
|---|---|---|---|---|---|
| US | 75 | 100 | 0 | 175 | 6.50 |
| Canada | 25 | 100 | 0 | 125 | 5.75 |
| Australia | 25 | 100 | 25 | 150 | 6.25 |
| NZ | 50 | 150 | 0 | 200 | 6.50 |
| Japan | 0 | 0 | 25 | 25 | 0.25 |
| UK | 50 | 50 | 0 | 100 | 6.00 |
| Switzerland | – | 125 | 50 | 175 | 4.00 |
| Euro area | 50 | 75 | 100 | 225 | 4.75 |
Of the other English-speaking countries: the Bank of England has not raised rates since February, after four increases of 25 basis points in the preceding 9 months, which lifted rates to 6 per cent, and the Bank of Canada and the Reserve Bank of New Zealand have left rates unchanged, at 5.75 per cent and 6.5 per cent respectively, since May.
In Europe, where the level of official interest rates was, and still is, well below that in English-speaking countries, official interest rates have continued to rise in recent months. Since the US Federal Reserve's last move in May, the European Central Bank has increased overnight rates by a further 100 basis points, to 4.75 per cent, taking the total tightening so far in this cycle to 225 basis points. The 50-point increase in June, followed by 25 basis points in both September and October has narrowed the spread with the US to 175 basis points.
The Bank of Japan (BoJ) raised overnight interest rates in August as concerns about deflation and the sustainability of the recovery had ameliorated sufficiently for the overnight call rate to be raised from zero to 0.25 per cent. The rise was the first since 1994, and was widely anticipated. In making the announcement, the BoJ noted that it was ending what was considered an ‘extraordinary’ policy, and that the increase should not be taken as the beginning of a tightening cycle.
There have been some increases in interest rates in some other Asian countries also. Building inflationary pressures led the Bank of Korea to raise official interest rates by a further 25 basis points in October, to 5.25 per cent, following a previous tightening of the same magnitude in February. The Philippine central bank raised official interest rates by 500 basis points over September and October in an effort to slow the depreciation of the peso against the US dollar. With political uncertainty eroding confidence in financial markets, market interest rates increased by much more – around 20 percentage points – to levels higher than during the Asian financial crisis.
Bond yields in the US have generally fallen over recent months (Graph 10). An important factor seemed to be the changing outlook for the economy and monetary policy. Yields on US 10-year Treasury notes fell around 60 basis points to 5.70 per cent between end May and early September, and have since fluctuated within a narrow range. This level is about 65 points below the current US cash rate. Normally, such an inverse yield curve would be taken to indicate that markets are expecting quite a pronounced slowing or even contraction in the economy. On this occasion, however, other factors seem to be at work, which make it harder to interpret the implications of movements in yields. One of these is the continuing budget surpluses in the US and the resulting falls in the supply of bonds on issue. Another factor is rising risk aversion among investors, which is adding to demand for government bonds. Yields on private sector bonds have not fallen as much as those on government bonds; while AAA corporates have fallen over recent months, they remain above the Fed funds target. However, bonds issued by borrowers of low credit standing have risen significantly.
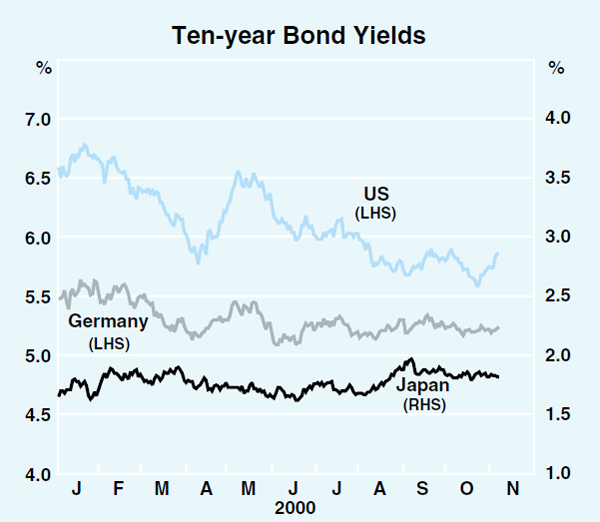
European bond yields have generally been more stable, with the 10-year German yield moving between 5.10 and 5.35 per cent since June. Japanese long bond yields increased around the time of the tightening in Japanese monetary policy, but have since been steady at just above 1.8 per cent.
In emerging markets, bond yields have been rising, with the spread to US bond yields widening sharply, to around 800 basis points in early November from a low of around 630 basis points earlier in the year.
Equity markets
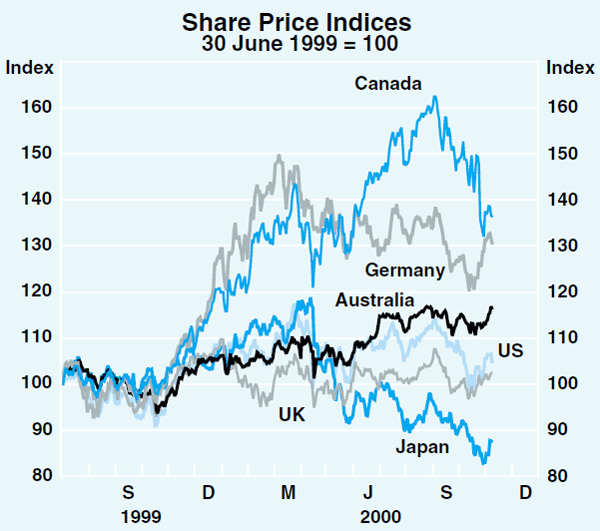
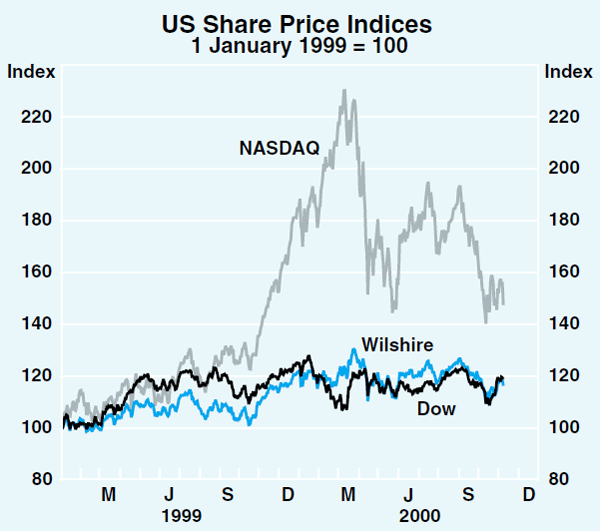
The prospect of slower economic growth and market disappointment with earnings announcements, particularly by ‘technology’ companies in the US, have weighed on equity markets over recent months. Looking through the volatility, overseas markets have fallen in recent months (Graph 11), with the lead clearly coming from the US (Graph 12). After surging to an all time high in March, the Nasdaq is now down 32 per cent from its peak and a net 16 per cent for the year. The Wilshire index, the broadest measure of US share prices (accounting for over 90 per cent of listed companies) is down by 3 per cent for the year and the Dow Jones Industrial Average is down by around 5 per cent. These broadly-based indexes of share prices in the US are now showing little net change over a period of at least 12 months. This is the first time since the mid 1990s that there has been no net change in US share prices over a twelve-month period (Table 5).
| Net change for year to date (%) |
Change since 2000 peak (%) |
||
|---|---|---|---|
| US | – Wilshire | −3 | −9 |
| – Dow Jones | −5 | −7 | |
| – S&P 500 | −3 | −6 | |
| – Nasdaq | −16 | −32 | |
| Germany | – DAX | 2 | −12 |
| Japan | – Nikkei | −19 | −26 |
Despite the falls in US share prices, the traditional measure of share valuations – P/E ratios – remain significantly higher than average. For the S&P 500 index, for example, the current P/E ratio is 28, down from a peak of 36 in May 1999, but still well above the long run average of about 16. In the case of the Nasdaq, the average P/E ratio is still around 100.
Share prices in countries such as Hong Kong, Canada, Germany and Japan, where market indices are heavily influenced by the technology sector, are down sharply over recent months. The share market in Australia has been resilient in the face of these overseas trends (see Chapter on ‘Domestic Financial Markets’).
Falls in the emerging Asian share markets this year have been very pronounced, with most of the decline concentrated in the Initial Crisis Economies – specifically Indonesia, Korea and Thailand. Share prices in these countries have dropped by an average of over 40 per cent since the start of 2000 and are now not much above the low point reached during the crisis. Financial markets assess these economies as vulnerable to a slowing in world growth, in part because their financial sectors are still recovering from the crisis. Share markets in Latin America have held up much better than those in Asia, weakening only modestly this year.
Exchange rates
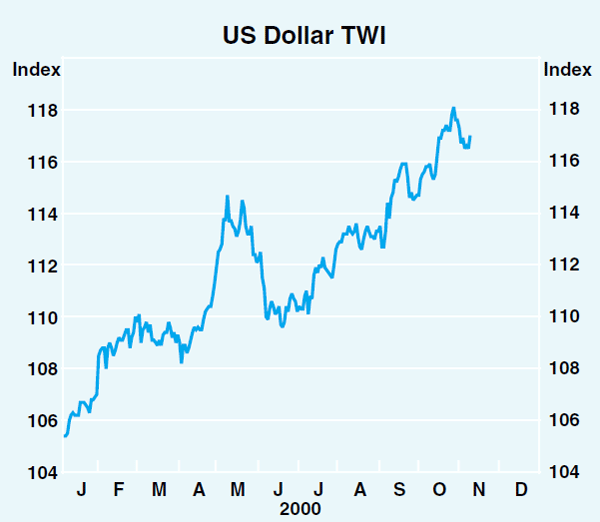
The US dollar has continued to rise on a trade-weighted basis in recent months, even though the factors that were used to explain its strength earlier in the year – strong US asset markets, a strengthening economy and rising interest rates – no longer apply (Graph 13). This raises questions about the extent to which the rise has become simply a reflection of trend-following or momentum trading. The strength of the US dollar has been most pronounced against the euro, but was also evident against other major currencies with the exception of the yen.
The weakening of the euro against the US dollar triggered a round of intervention by G7 countries in support of the euro in mid September, after the euro had fallen very quickly to record low levels and appeared to be the subject of ‘one-way bet’ speculation in financial markets (Graph 14).
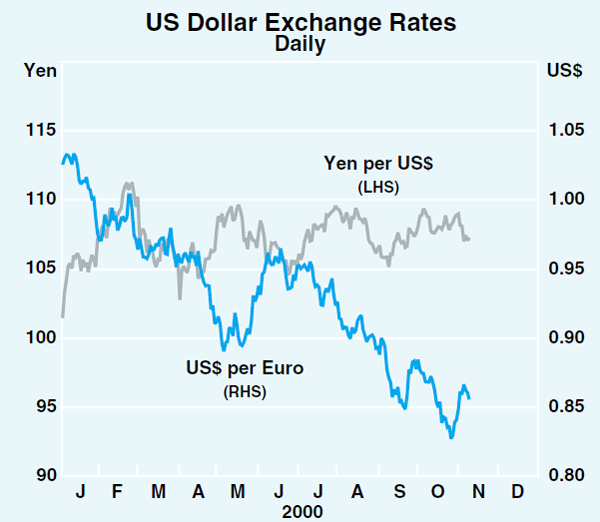
The European Central Bank followed up with further intervention, this time unilaterally, in early November. This intervention seems to have helped steady the euro which is now trading around levels at which the ECB first intervened.
In contrast to the variability in the euro/US dollar exchange rate, the Japanese yen has continued to trade in a tight range against the US dollar. Elsewhere in Asia, the countries with floating exchange rates have depreciated against the US dollar, though to varying degrees. Some currencies, such as the Singapore dollar, are down only a little, but others have fallen significantly. The biggest falls were in the Philippines, where political uncertainty undermined confidence and the peso fell by 22 per cent from its level at the start of the year, and in Indonesia where the rupiah fell by 24 per cent. General US dollar strength was also reflected in a depreciation of floating currencies in Latin America.
Australian dollar
In the period during which it has been floating, the Australian dollar has shown quite large medium-term movements in both directions (Graph 15). The fall during 2000 was the fourth time it has moved down by a significant amount, but the first time it has done so without the presence of a significant negative external shock such as a fall in commodity prices, a world recession or a contraction amongst our major regional trading partners. What stands out about the current fall is that it has occurred at the time when Australia's international trading environment remains very robust, and was therefore generally unexpected. As a consequence, there has been much conjecture as to its causes.
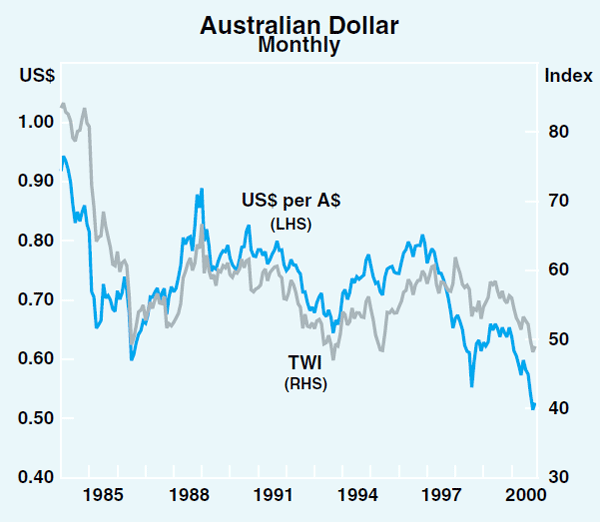
Analysis of the factors causing changes in exchange rates is often difficult because the influences on the demand for currencies are ill-defined and variable. Nonetheless, when looking at the causal factors in the Australian dollar's fall this year, some patterns emerge. In the first seven months of the year, changes in the exchange rate tended to be concentrated into a relatively small number of abrupt moves, and were associated with economic news which were interpreted as changing the growth outlook for Australia and the US, and therefore actual and expected interest rate differentials. More recently, the fall in the exchange rate has tended to be characterised by a series of smaller but persistent declines, and not associated with any particular pieces of economic news. The events of the past year are therefore best analysed in terms of these two phases.
January to July
As noted, during this phase changing expectations of interest differentials between Australia and the US seem to have played an important role in the fall of the Australian dollar. The significance of economic news and interest rates emerges clearly when the large individual moves in the exchange rate are examined in detail. For example, from the first sharp fall in the exchange rate in late January through to July, there were ten occasions when the exchange rate moved by more than US0.70 cents in a day. Seven of these moves were falls, and in total they accounted for virtually all the net fall in the exchange rate over the period. All but two of these moves in the exchange rate came after economic news which changed market assessments of the growth outlook for either Australia or the US, and therefore expectations of future interest rate differentials. For example, weak economic data on Australia caused market participants to lower their expectations of future Australian economic growth and inflation, and therefore the likelihood of a rise in Australian interest rates. In turn, this meant that the expected interest rate differential relative to the US moved in favour of the US dollar, resulting in sales of Australian dollars and purchases of US dollars. Box B summarises the factors that were reported to be linked to each of the large moves in the exchange rate.
Other pieces of evidence supporting this interpretation of events can be found from graphs of the relevant variables. When data on the expected growth differential, the expected cash rate or the long-term bond differential between the two countries are plotted against the exchange rate, a clear relationship emerges during the first seven or so months of 2000. During this period, for example, forecasts of the growth differential between Australia and the US prepared by Consensus Economics were revised down progressively. Whereas in January it was expected that Australian growth in 2000 would exceed US growth by 0.3 of a percentage point, by mid year it was expected that US growth would exceed Australian growth by 1 percentage point (Graph 16).
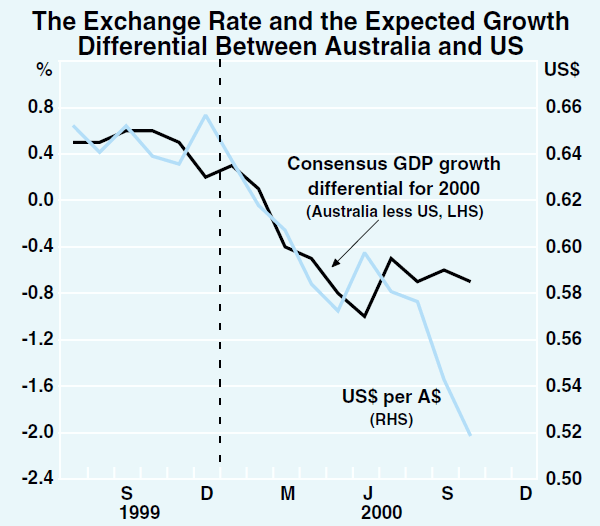
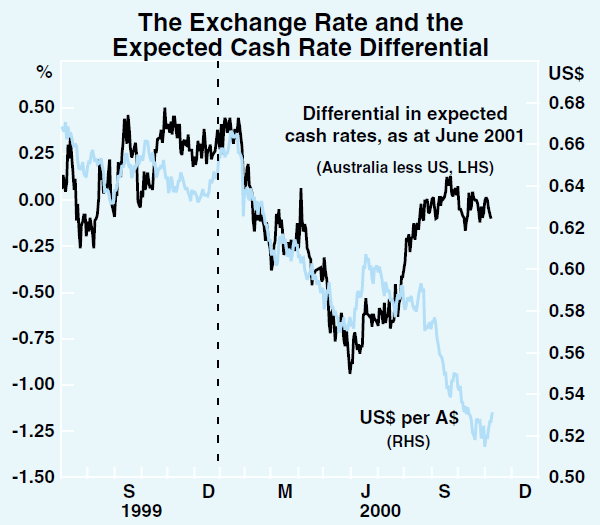
Against this background, not surprisingly, market expectations of the cash rate differential were also revised down sharply during this period (Graph 17). Similar sentiment was reflected in a decline in the bond spread between Australia and the US, from about 60 points at the start of the year to close to zero mid year (Graph 18). These adjustments went hand in hand with the fall in the exchange rate.
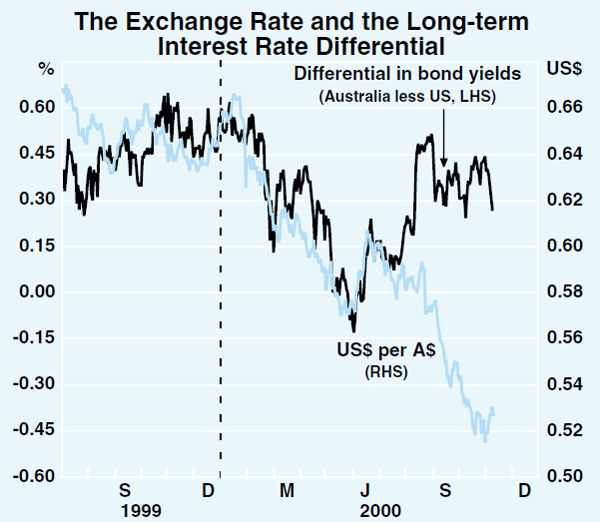
Through the early part of this period, a lot of the fall in the exchange rate reflected independent weakness of the Australian dollar, so that the bilateral rate against the US dollar and the trade-weighted index moved similarly. From late April, however, the continued fall of the Australian dollar against the US dollar became more a reflection of the strength of the latter, following a run of very strong economic data in the US and a tightening of 50 basis points by the Fed, a bigger move than its earlier increases of 25 points. Similarly, the recovery of the Australian dollar in June was again largely a reflection of movements in the US dollar, this time a weakening. This followed a run of softer US data which caused the earlier upward revisions to expectations of US interest rates to be unwound. From late April through June, the trade-weighted index of the Australian dollar was much steadier than the bilateral rate against the US dollar.
In net terms, over the whole period from January to July, the Australian dollar fell by about 11 per cent against the US dollar and by about 6 per cent in trade-weighted terms.
The period since August
In the period since August, the exchange rate of the Australian dollar has fallen further, by about 9 per cent against the US dollar and 7 per cent against the trade-weighted index (Graph 19). While the net fall is nearly as large as that which took place over the first seven months of the year, in this latest episode there have been only three large daily falls, and they account for only about one-third of the net move over the period. As noted, most of the fall in the exchange rate has come about because of a series of small but persistent daily falls.
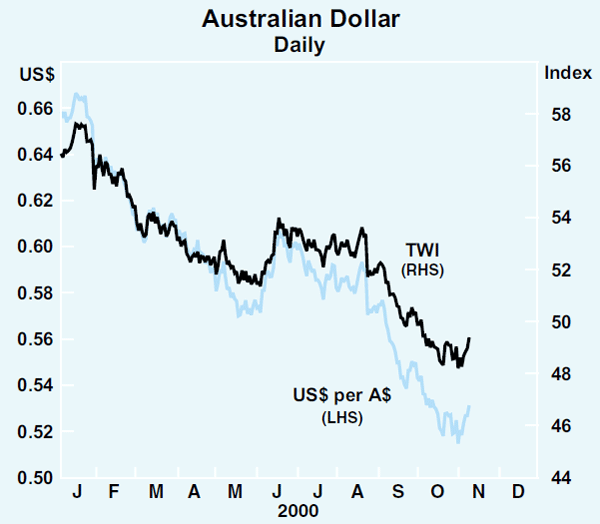
Perhaps reflecting this pattern, market dealers have been less able to pinpoint the factors driving the exchange rate. Explanations have been varied and somewhat inconsistent. Also, there has been increased recourse to explanations based on chartist behaviour and market dynamics such as trend-following or momentum trading.
Interest rates have become much less important in explaining exchange rate moves. Movements in interest rate differentials, either the expected cash rate differential or the bond differential, have reversed some of the falls earlier in the year (Graphs 17 and 18). Most of this adjustment to the interest rate relativities has come from the US side, with economic data tending to confirm that the US economy has slowed. Market expectations of where US short-term interest rates will be in mid 2001 have been lowered by more than 100 basis points since their peak in May, with the market now pricing in the possibility that the next change in US monetary policy will be an easing. In contrast, expectations for Australian interest rates are little changed, so the differential has moved in a direction favourable to the Australian dollar.
Despite the changed outlook for US interest rates, the US dollar continued to rise for most of the period. All currencies apart from the yen fell against it. The euro/US dollar exchange rate fell to new lows almost daily in September, sterling reached 15-year lows, and both the Australian dollar and New Zealand dollar exchange rates also hit new lows against the US dollar.
With many currencies falling simultaneously against the US dollar, correlations between the Australian dollar and some other currencies have increased recently. This was particularly the case for the euro, against which a relationship had already started to emerge in the first half of the year. This relationship has recently strengthened, with the correlation of daily movements increasing to 0.49, twice its first-half reading. The close relationship with the euro has caused widespread puzzlement because, traditionally, the two currencies had not been related, and the cyclical positions of the respective economies, as well as their overall structure, do not indicate any reason for such a close relationship.
In recent weeks, with the US dollar levelling out in trade-weighted terms and the euro rising, helped in part by central bank intervention, the Australian dollar too has started to stabilise. In net terms, the Australian dollar's exchange rate against the US dollar has shown little change since mid October, while the TWI has shown little change since early October.
Because developments in the Australian dollar over recent months have mainly reflected international factors rather than domestic events, the case for independent action by the Reserve Bank to try to avert its fall seemed rather limited for much of the period. In recent weeks, however, the Bank has entered the market on several occasions to support the exchange rate and reinforce the emerging tendency towards stability.
Box B: Large Movements in the Australian Dollar Exchange Rate During 2000
Since late January there have been 15 days on which the exchange rate of the A$ to the US$ moved by a large amount – defined here as a move of more than US0.7 cents. Consistent with the overall decline of the exchange rate during the year, ten of these were falls.
The main causal factors reported to the Bank by market dealers at the time of the moves are listed below. In the first part of the period, most of the factors related to news affecting interest rate expectations (see Table B1). More recently, the tendency has been for dealers to attribute the moves in the exchange rate to a range of non-economic factors.
| Date | Exchange rate move (US cents) |
News affecting interest rate expectations |
Other factors |
|---|---|---|---|
| 28 January | −1.6 | * | |
| 24 February | −0.7 | * | |
| 1 March | −1.2 | * | |
| 17 April | −1.1 | * | |
| 3 May | 0.7 | * | |
| 8 May | −1.3 | * | |
| 15 May | −0.8 | * | |
| 2 June | 0.8 | * | |
| 6 June | 0.7 | * | |
| 5 July | −0.9 | * | |
| 16 August | 0.9 | * | |
| 22 August | −0.8 | * | |
| 23 August | −0.9 | * | |
| 7 September | −0.9 | * | |
| 20 October | 1.0 | * |
28 January: US1.6 cent fall
Lower Australian CPI figures
Stronger US GDP & wage
data
The change in sentiment towards the A$ began with the release of lower-than-expected CPI figures which reduced expectations of monetary tightening in Australia. During local trading, the currency declined. In the US that evening, December quarter GDP figures and the employment cost index were both stronger-than-expected, increasing the expected degree of Fed tightening and therefore the extent to which expected interest rates favoured US assets. This added to the downward pressure on the A$.
24 February: US0.7 cent fall
Weaker Australian investment data
Strong US durable goods figures
In Australia, the currency fell after weaker-than-expected domestic capital expenditure figures for the December quarter. That evening, stronger-than-expected US durable goods figures for January saw the currency fall further.
1 March: US1.2 cent fall
Declining Australian retail sales data
The release of much weaker-than-expected retail sales data for January saw the exchange rate fall over US 1 cent in local trading.
17 April: US 1.1 cent fall
No local or US releases
Strong rally in US share prices
No economic news to affect interest rate expectations. The A$ fell against the US$ in offshore markets, as did other major currencies. Market participants attributed this to a strong rally in US stock markets, which underpinned buoyant US$ sentiment.
3 May: US0.7 cent rise
RBA policy tightening
Improved current account data
The announcement of the 25 basis points rise in the cash rate to 6 per cent pushed the A$ higher. The release of lower-than-expected current account data for March added to the better tone and the A$ rose.
8 May: US 1.3 cent fall
Slower Australian retail sales growth
Falling Australian
job vacancies
The release of lower-than-expected March retail sales, a decline in ANZ job vacancies for April, and the NAB business survey showing weakening conditions in April saw the currency slip in local trading and continue to decline in offshore markets.
15 May: US0.8 cent fall
Falling Australian housing data
Stronger US industrial
production
News that housing finance for March fell sharply saw the A$ fall in the local market. Overnight, the release of strong US industrial production numbers added to the US dollar's firm tone and caused the Australian dollar to slide further.
2 June: US0.8 cent rise
Weaker US employment data
Weaker US payrolls data for May saw the US$ fall against all major currencies. The A$ rose against it.
6 June: US0.7 cent rise
No local or US releases
Rumours of Bundesbank intervention
No economic news to affect interest rate expectations. Other than reports that the Bundesbank was active in the foreign exchange market, there was no specific news to trigger the temporary bout of US$ weakness. All major currencies rose against the US$, including the A$.
5 July: US0.9 cent fall
No change in Australian monetary policy
The RBA did not announce a change in the cash rate. The A$ gradually slipped over the local day and in London, and was sold more aggressively in New York.
16 August: US0.9 cent rise
Weaker US housing data
Release of RBA quarterly report
The release of weak US housing data saw the A$ rise in New York. This was consolidated after the release of the RBA's quarterly report which was regarded as hawkish.
22–23 August: US 1.7 cent fall
No local or US releases
Weak euro and NZ dollar
No economic news to affect interest rate expectations. Dealers attributed the fall to weakness in the euro and the NZ dollar.
7 September: US0.9 cent fall
No local or US releases
A$/yen selling and weak euro
No economic news to affect interest rate expectations. A rise in the yen triggered a bout of stop-loss selling of the A$ when the A$-yen cross rate fell to 60. A fall in the euro that evening took the A$ lower.
20 October: US1 cent rise
No local or US releases
Strong euro and NZ dollar
No economic news to affect interest rate expectations. Dealers reported that news of the possible sale of assets by a major telecommunications company had added to demand for A$. Strength in the euro and NZ dollar reinforced the rise.
Domestic Economic Activity
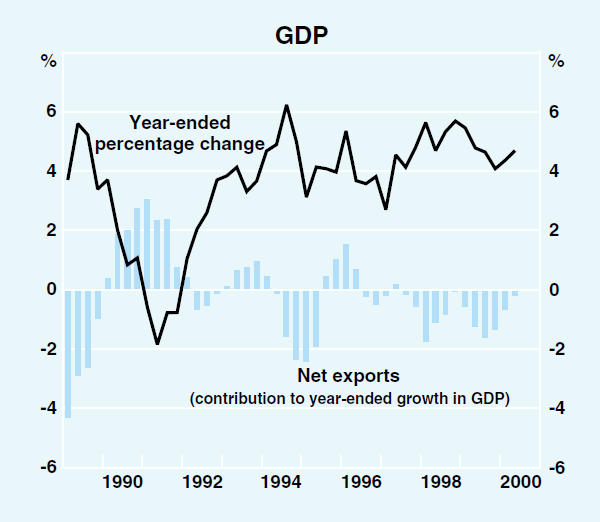
The Australian economy has continued to grow strongly, although the introduction of the GST in the middle of the year and the staging of the Olympics Games in September have made interpreting recent data more difficult than usual. Over the year to the June quarter, real output expanded by around 4¾ per cent (Graph 20), and most indicators suggest that further solid growth occurred in the September quarter. The composition of growth, however, has clearly changed during the last year. Consumer spending has slowed from the very strong rates of growth recorded in 1999, while export growth has accelerated (Table 6).
| Year to: | ||
|---|---|---|
| December 1999 | June 2000 | |
| Consumption | 5.3 | 4.1 |
| Dwelling investment | 7.0 | 23.1 |
| Business investment(a) | 3.4 | 3.7 |
| Private final demand(a) | 5.3 | 5.5 |
| Public final demand(a) | 6.7 | 7.2 |
| Domestic final demand | 5.6 | 5.9 |
| Change in inventories(b) | −0.1 | −1.2 |
| Exports | 7.4 | 12.2 |
| Imports | 13.2 | 11.3 |
| Net exports(b) | −1.3 | −0.2 |
| Gross domestic product | 4.1 | 4.7 |
| (a) Excluding transfers between the public and private sectors (b) Contribution to growth in GDP |
||
The rate of growth of the economy in the first half of the year is likely to have been boosted by the introduction of the GST on 1 July, as some spending on goods whose prices were expected to be increased by the change in taxation arrangements was brought forward from the second half of the year. The largest transitional effects have clearly been in the housing sector, which recorded extraordinary levels of activity in the first half of 2000, and for which forward indicators imply that a sharp slowing is in train. The net impact on consumer spending and purchases of investment goods, by contrast, appears to have been small. In the September quarter, the Olympics are likely to have provided a further net boost to output.
Household consumption
Over the first half of 2000, consumer spending grew at an annual rate of around 2½ per cent, less than half the rate of growth recorded in the second half of 1999. Underlying these figures was a fall in expenditure on goods and a slowdown in the rate of growth of expenditure on services. Some moderation in growth from the high rates experienced in the second half of 1999 was expected, given that monetary policy has been progressively tightened since November last year, and the gains in wealth, which have probably boosted consumption spending over the past couple of years, have slowed. The rise in petrol prices over the past year could have also contributed to this slowdown in consumer spending, as some households may have curtailed their expenditures on other goods and services.
The indicators of consumer spending around the middle of the year were, as expected, very volatile, as consumers responded to the relative price changes caused by the change in the indirect taxation system (Graph 21). Overall, and despite survey evidence suggesting that consumers were not well informed about the details of the tax package, consumers' responses to the anticipated changes in relative prices were broadly as expected. In the month immediately preceding the tax change, large increases were recorded in sales of items whose prices were expected to rise, such as clothing and footwear, with sales being correspondingly weaker in July. These effects were amplified by the decision made by a number of major retailers to hold their mid-year sales in June, rather than July. Sales of motor vehicles, by contrast, were subdued through much of the first half of the year, in anticipation of lower prices after 1 July, and then boosted in July and August. Once again, these swings were amplified by the manufacturers' decisions to delay the launch of a number of new models onto the Australian market until after 1 July. Little transitional effect on sales was evident for goods, such as food items, the prices of which were not expected to be affected by the tax changes. By international standards the distortions to consumer spending were relatively small.
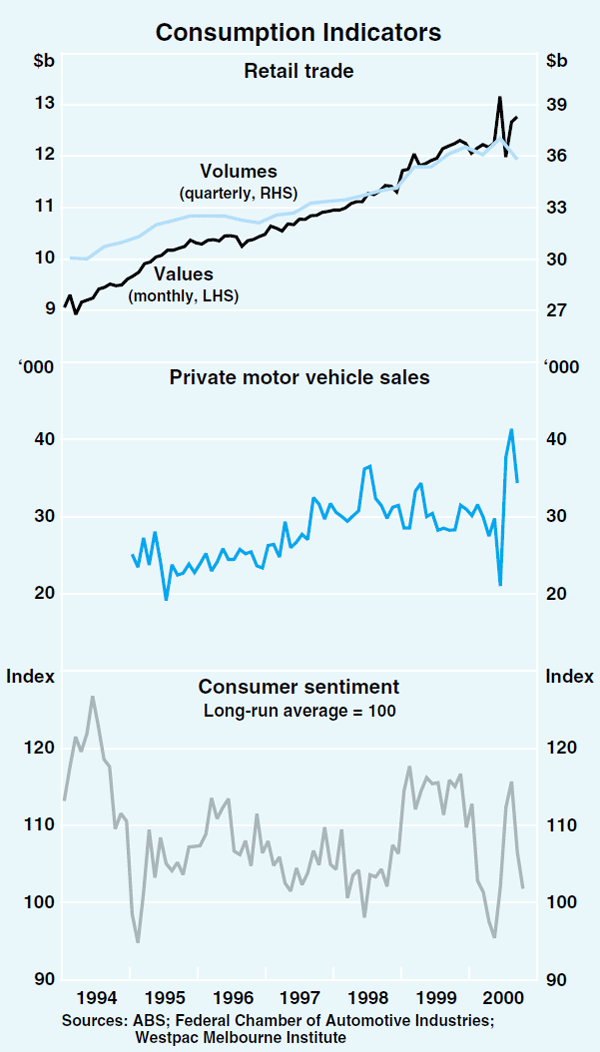
In net terms, consumer demand was brought forward in anticipation of the tax changes, and this resulted in a decline in retail sales in the September quarter in real terms, after the strong growth recorded in the June quarter. Looking through the mid-year volatility, consumer spending appears to be continuing to grow quite well. In September, the value of retail sales was 4.2 per cent higher than in May, the last month for which data appear to have been relatively unaffected by the tax changes. With retail prices up by around 3 per cent over that period (including tax effects), this would imply growth in real terms of around one per cent. Sales in September were boosted in some areas by the Olympics, with sales in New South Wales particularly strong in the month. At the same time, Olympic-related spending by consumers and their tendency to stay at home during the Olympics may have temporarily dampened other areas of expenditure such as in restaurants and department stores. The overall impact of the Games on the retail sales data therefore remains unclear.
Consumer sentiment has fluctuated over quite a wide range since the beginning of the year, possibly reflecting a number of factors including uncertainties about the tax changes, higher interest rates and financial market volatility. In aggregate consumer sentiment, after recovering strongly in the middle of the year when much of the uncertainty about the tax package was resolved, has weakened again in recent months and remains lower than levels recorded a year ago. Most components of the survey, however, remain around their long-run averages and would be consistent with continued moderate growth in consumer spending.
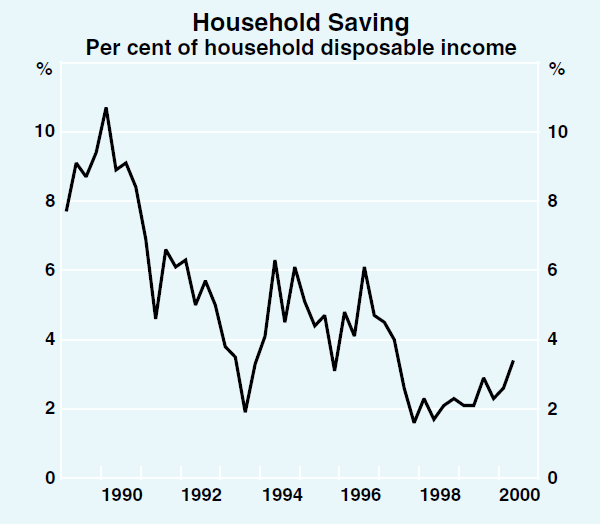
Household disposable income grew by a little over 2 per cent in the June quarter, reflecting increases in wage and salary earnings and an increase in dividends received by households, and the household saving ratio increased to 3.4 per cent, its highest level since June 1997 (Graph 22). The reductions in personal income taxes and increases in social benefits since 1 July imply that stronger growth in disposable income is likely to be recorded in the September quarter. The demutualisation of the NRMA could provide a small boost to household spending, as it has made a small proportion of household wealth more liquid, although it is only worth around $4½ billion or 0.2 per cent of total household assets. To some extent this may be offset by the payment deadline for Telstra 2 instalment receipts, which could also have been a cash-flow consideration for some households.
Household assets have continued to rise, increasing by 3 per cent in the June quarter, and 12 per cent over the last year, although growth has moderated from the very rapid pace recorded in 1999 (Table 7). Increases in the value of both dwellings and financial assets have contributed to the latest rise. The estimated value of dwellings rose by just under 4 per cent in the June quarter, more than reversing a fall in March. This was driven by increases in dwelling prices in all capital cities and most country areas but, as discussed below, these figures may have been boosted by compositional effects which are likely to be unwound in the September quarter. Household financial asset holdings increased by 2 per cent in the June quarter, driven by both net acquisitions of shares and increases in share prices.
| Level at June 2000 $b |
Average annualised growth (per cent) Six months to: |
|||
|---|---|---|---|---|
| June 1999 | December 1999 | June 2000 | ||
| Tangible assets | 1,789 | 16.3 | 21.2 | 2.5 |
| – Dwellings | 1,665 | 17.5 | 22.7 | 2.5 |
| – Consumer durables | 124 | 2.9 | 4.0 | 3.2 |
| Financial assets | 1,182 | 10.9 | 13.9 | 7.9 |
| – Currency and deposits | 247 | −0.3 | 5.4 | 1.3 |
| – Equities | 237 | 12.8 | 36.4 | 9.5 |
| – Superannuation and life offices | 613 | 16.5 | 13.1 | 9.3 |
| – Other | 86 | 5.3 | −5.3 | 13.9 |
| Total assets | 2,972 | 14.1 | 18.3 | 4.6 |
Households are continuing to increase their indebtedness, although this too has moderated in recent months. An acceleration in housing credit, probably fuelled by attempts to expedite payments ahead of the GST, took growth to an annual rate of above 19 per cent over the six months to June. Since then it has eased back to around 13 per cent over the six months to September. Personal credit growth has also moderated slightly since earlier in the year but remains strong at around 14 per cent on a six-month-annualised basis. Within this component, margin lending has slowed, perhaps reflecting the more mixed performance in equity markets.
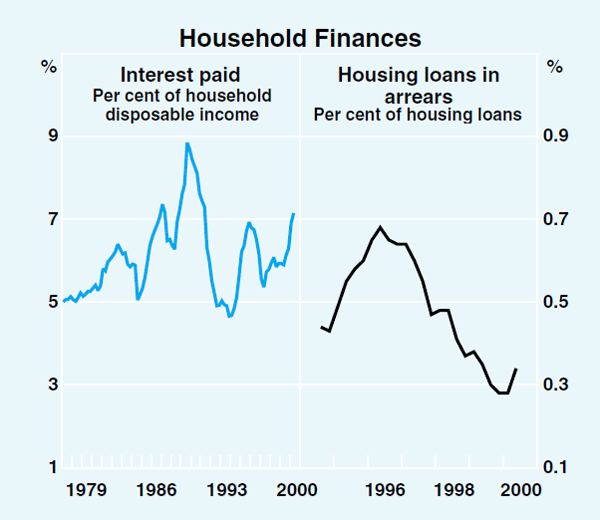
The effect of the tightening in monetary policy since last November is clearly evident in household interest payments. In the June quarter, the household interest burden increased to be 7.1 per cent of household disposable income, which is slightly above the recent peak recorded in late 1995 (Graph 23). This rise has reflected increases in nominal interest rates and a larger household debt burden. The ratio of household debt to income increased to around 103 per cent of disposable income in June, up from around 98 per cent at end 1999. Despite the increase in household debt, the ratio of household debt to assets has remained steady at around 13 per cent for the past four years, which implies little change in the leverage of households. Information on housing loans in arrears provides another indication of the impact of recent interest rate increases on households. Housing loans in arrears still remain very low, accounting for only one-third of one per cent of all housing loans outstanding, although they increased in the June quarter after trending downwards for the past three years.
Dwelling investment
Household spending on dwellings reached record levels as a percentage of GDP in the first half of the year; private dwelling investment grew by 10 per cent in the June quarter and by 23 per cent over the year. The strong growth in dwelling investment in the first half of the year appears to have been strongly influenced by the incentive to complete as much work as possible prior to the introduction of the GST. This factor reinforced a housing upswing that had already been underway.
The unwinding of the pre-GST surge, combined with the dampening effects of rising interest rates and higher house prices on affordability, are evident in the leading indicators of dwelling activity (Graph 24). Private building approvals have fallen for the past eight months, and are 47 per cent below the January peak. The recent falls have been driven by approvals for houses, which had experienced the strongest growth in the second half of 1999. The value of loan approvals has also been falling sharply, although a modest rise in August (for both owner-occupiers and investors) suggests that the outlook may be stabilising. Total loan approvals are now 20 per cent lower than their peak, or 9 per cent lower than a year ago. The declines in loan approvals and building approvals from their recent peaks have been about the same as those that occurred in the mid 1990s.
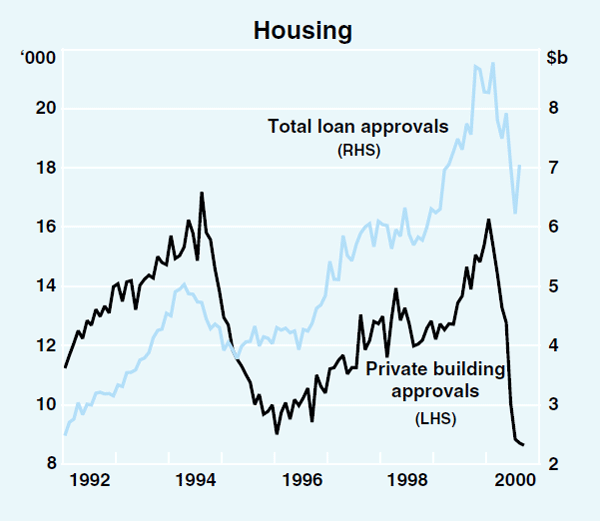
All states have experienced both the exceptionally strong growth in building approvals over 1999 and the sharp declines more recently. The pick-up was strongest in Melbourne and Adelaide, which had experienced relatively low levels of dwelling investment earlier in the decade, while the recent weakening has been sharpest in NSW, which had been investing at a very high rate for several years. A similar pattern is evident in the state loan approvals data (Table 8).
| Private Building(a) | Loan(b) | |
|---|---|---|
| New South Wales | −42.7 | −15.8 |
| Victoria | −25.5 | −13.5 |
| Queensland | −28.7 | −7.2 |
| Western Australia | −37.1 | −10.9 |
| South Australia | −31.1 | 1.2 |
| Tasmania | −28.9 | 8.5 |
| Australia | −33.9 | −12.4 |
| (a) Value; houses and medium-density dwellings; latest observation is September (b) Value; for owner-occupation; latest observation is August |
||
The housing sector will clearly subtract from growth of domestic demand over the coming year, primarily due to the unwinding of the GST-related surge in investment. In the near-term, however, the increased presence of first home buyers in the market after 1 July should see renewed interest at the lower end of the market. In the months prior to the introduction of the GST, the share of loan approvals attributed to first home buyers reached record lows, but then rebounded to 24 per cent in July, and has since stayed around that level. This pattern has reflected the incentive for first home buyers to delay purchases until after 1 July when they would be eligible to receive the Commonwealth Government's first home-owners' grant.
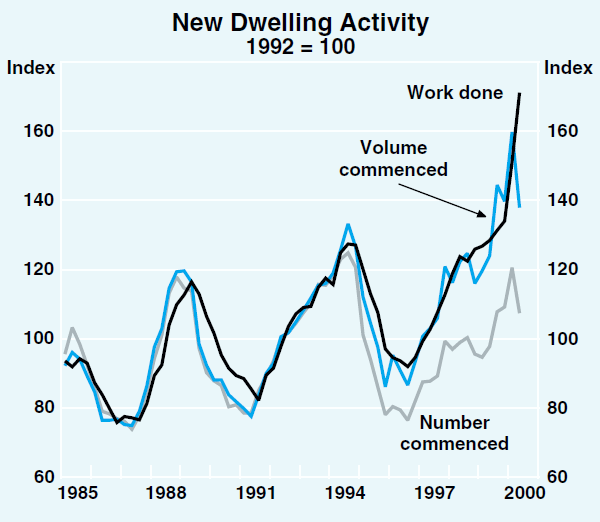
Despite the recent surge in housing construction activity, it appears unlikely that this will lead to a large build-up of excess supply in the sector. While the current housing cycle, as measured by dwelling investment as a share of GDP, has exceeded the strength of previous cycles, this is because much of the strength of the current upturn has been due to consumers building bigger and better dwellings (Graph 25) and spending more on alterations and additions. The number of dwellings commenced, even including the recent build-up, remains well below the levels of the two previous cycles. Other indicators of excess supply, such as vacancy rates and rental rates also suggest that, at this stage, there is little evidence of over-investment in housing. Rents have, if anything, been increasing across most capital cities, and although vacancy rates have increased in Sydney, Melbourne and Adelaide, they remain at historically moderate levels.
House prices continued to rise through the middle of the year. Established house prices, as measured by both the REIA and the ABS, grew strongly in the June quarter after having softened earlier in the year. The latest figures may, however, have been boosted by compositional change, as the withdrawal of first home buyers from the market may have led to lower than usual turnover at the cheaper end of the market. To the extent that this is the case, these aggregate price measures will be correspondingly weaker in the September quarter. There are also signs that house prices more generally may be softening due to the weaker demand conditions now prevailing in the sector.
The business sector
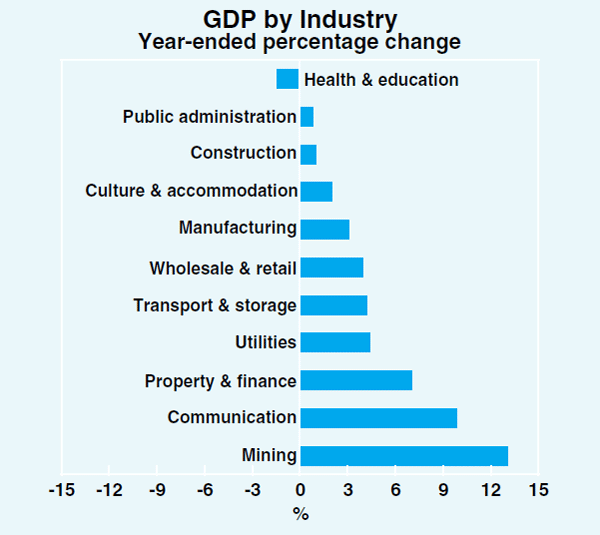
While the economy has grown strongly over the past year, conditions have varied quite widely across industries. The impact of the pick-up in world economic growth and the depreciation of the currency has been particularly evident in the mining sector, which has been the fastest growing sector over the past year with real output rising by 13 per cent (Graph 26). Growth in the output of black coal, iron ore and gold were particularly strong recently. The communications sector continued to grow rapidly, underpinned by the development of mobile telephone and fibre optic networks. Output growth in the services sector has also been buoyant. Property and business services, reflecting, inter alia, work associated with the implementation of the GST, as well as finance and insurance services, added to the strong gains earlier in the year, growing in aggregate by over 2 per cent in the June quarter and by 7 per cent over the year. Construction output rose only moderately as the very strong growth in dwelling construction was partly offset by falls in non-residential building work and engineering construction.
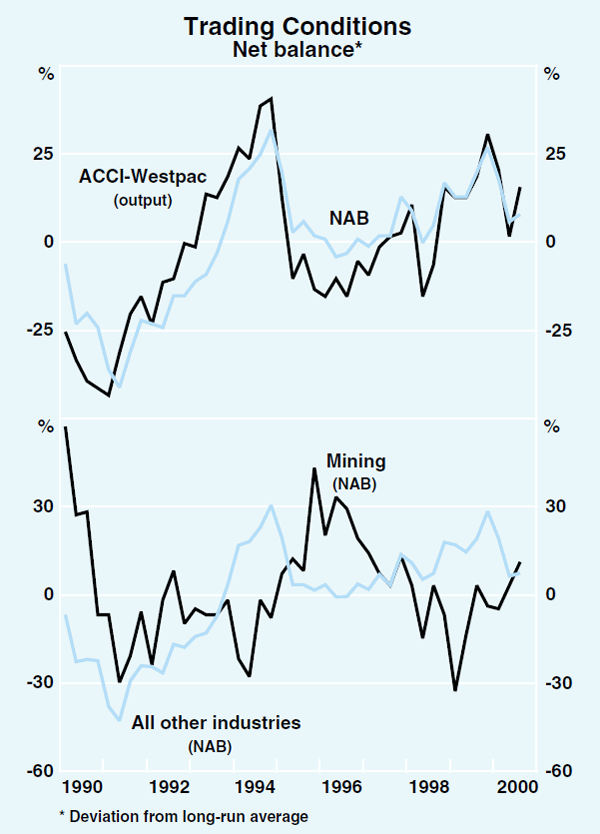
Recent business surveys suggest that trading conditions and levels of confidence have declined from the high levels seen at the end of last year. Both the NAB survey and the ACCI-Westpac survey recorded a softening in trading conditions in the first half of the year, with some pick-up occurring in the September quarter (Graph 27). The surveys suggest that perceived trading conditions remain close to or above their long-run averages. Not surprisingly, the expectations for export demand remain strong. Trading conditions for the mining sector have continued to improve after a period when confidence in the industry had been low. According to the Yellow Pages survey, confidence of small businesses also declined sharply in the first half of the year, although much of that decline was reversed in the September quarter.
Business investment has continued to be volatile from quarter to quarter, around a modest upward trend (Graph 28), with a decline in buildings and structures investment being offset by growth in the other components. Investment in machinery and equipment fell by just over 1½ per cent in the June quarter, but is 13½ per cent higher over the year. The outlook for machinery and equipment investment, according to the latest ABS Capital Expenditure Survey, is for further growth in the year ahead, though at a fairly modest pace. Firms have upgraded their machinery and equipment investment plans slightly for 2000/01 to around 3½ per cent growth in nominal terms. This is likely to have been boosted by the introduction of input tax credits as part of the tax reform process, though offsetting this, some investment intentions may have been dampened by the increased cost of imported capital goods on account of the depreciation of the Australian dollar.
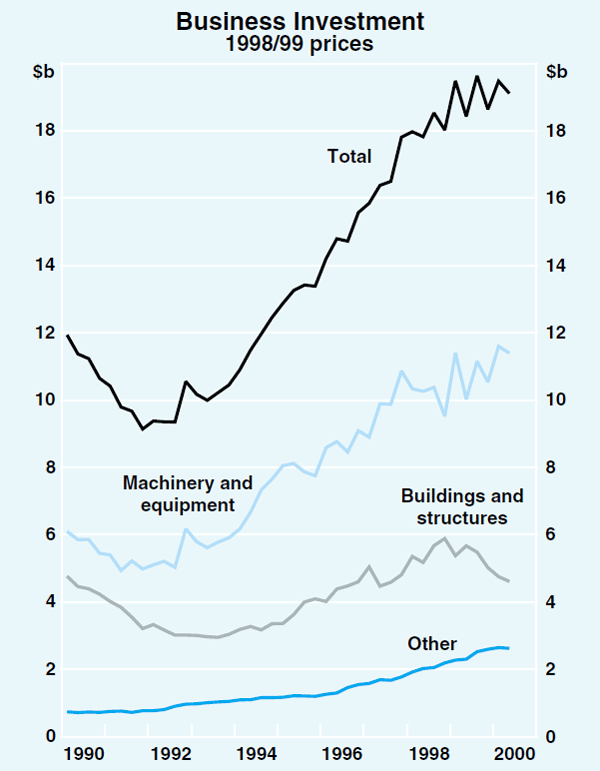
Investment in new buildings and other structures has been on a downward trend for the past year and a half. This trend continued into the June quarter, with buildings and structures investment falling by 3 per cent, as several large engineering projects were completed. Forward indicators for non-residential building activity, which accounts for about 60 per cent of investment in buildings and structures, have been more positive. The value of private non-residential building approvals in the June and September quarters was about 5 per cent higher than in the corresponding period last year. The increase was concentrated in offices and shops. The pick-up in approvals in offices has been supported by strong demand conditions in most major CBD office property markets, where average vacancy rates have fallen to their lowest levels since the late 1980s. Demand for new office space is particularly strong in Sydney and Melbourne, where there have been limited new completions in recent years, and where there has been a withdrawal of a considerable amount of office space due to strong demand for residential city properties. The strength in shops relates largely to refurbishments.
Engineering construction, which accounts for the remaining 40 per cent of investment in buildings and structures, has been particularly weak. Spending is one-third below its peak in December 1998, due largely to weakness in investment by the mining sector. Forward indicators, such as private sector commencements, work-yet-to-be done and the listing of projects in the Access Investment Monitor, point to subdued activity in the immediate future. On the other hand, the strength in commodity prices in Australian dollar terms, and the correspondingly high level of profitability of the mining sector, would appear to provide a more positive outlook if these conditions are sustained.
The other major component of business investment, expenditure on intangible fixed assets, fell in the June quarter, but has increased by 14 per cent over the past year. Falls in both computer software and minerals exploration contributed to the decline in the quarter, although this weakness appears unlikely to persist. In coming periods, mineral and petroleum exploration expenditures should be encouraged by the record high commodity prices in Australian dollar terms.
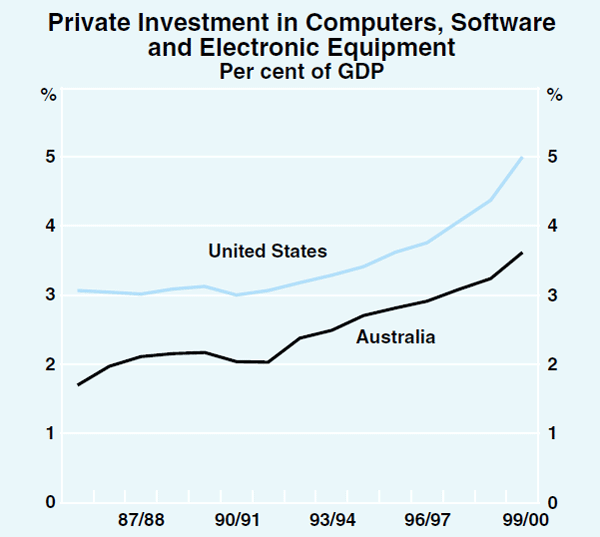
Total investment in computer hardware and software and other electronic equipment has continued to increase, as a share of GDP, in recent years. Private investment of this nature was over 3½ per cent of GDP in 1999/00, almost double its level of a decade earlier, and has been increasing at broadly the same rate as in the US (Graph 29). The lower recorded level of investment in Australia is, in part, related to the fact that some of Australia's telecommunications sector remains in majority public ownership and hence is not incorporated in these figures. By industry, investment in hardware and electronic equipment, as well as growth in this investment, has been concentrated in the communications, and property and finance services industries (Table 9).
| Industry | 1993/1994 | 1996/1997 | 1999/2000 |
|---|---|---|---|
| Communications | 0.5 | 1.8 | 4.6 |
| Property and finance | 2.1 | 2.7 | 3.0 |
| Utilities | 0.6 | 1.4 | 1.6 |
| Retail and wholesale trade | 1.3 | 1.3 | 1.6 |
| Manufacturing | 0.8 | 1.1 | 1.1 |
| Cultural, recreation and accommodation | 0.5 | 1.1 | 1.1 |
| Transport and storage | 0.5 | 0.5 | 0.5 |
| Agriculture and mining | 0.4 | 0.5 | 0.5 |
| Construction | 0.4 | 0.4 | 0.4 |
| Health, education and other | 0.3 | 0.3 | 0.3 |
| Total | 7.6 | 11.0 | 14.6 |
| (a) Note that private sector expenditure on software data are not available by industry and are therefore not included in these figures. | |||
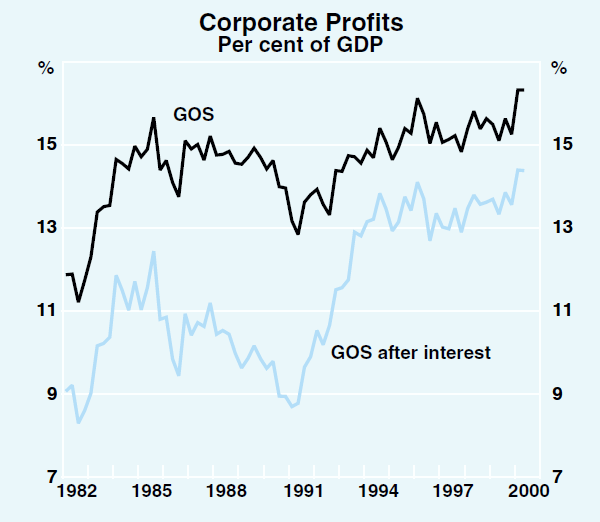
The profitability of the corporate sector overall remains high. Although growth in corporate profits moderated in the June quarter, profits as a share of GDP remained around 16 per cent, well above the historical average (Graph 30). Corporate net interest paid rose by only 2 per cent, so profits after interest also remained strong. The business sector's raisings of external finance also picked up further in the June quarter (Graph 31). Debt raising activity was particularly strong, both through intermediaries and markets.
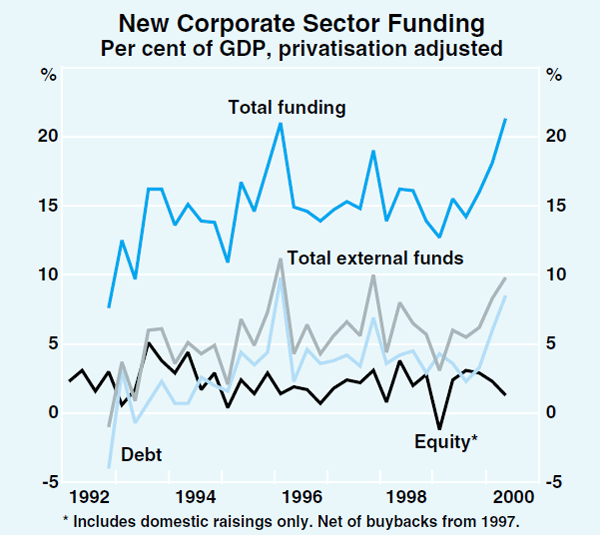
More recently, however, growth in external funding has moderated a little. Overall business credit growth eased to an annualised rate of around 9 per cent over the 6 months to September, around the same pace as was recorded in March. On the markets, the net amount raised through debt and equity also appears to have eased; firms are continuing to return surplus capital through equity buy-back activity. This moderation in external funding could imply that the interest rate increases have started to affect corporate funding and investment decisions. Since internal sources of funding have remained strong, corporates might, in particular, have taken the opportunity to reduce gearing. The GST and Olympic games, however, may also have influenced the timing of funding activity.
The labour market
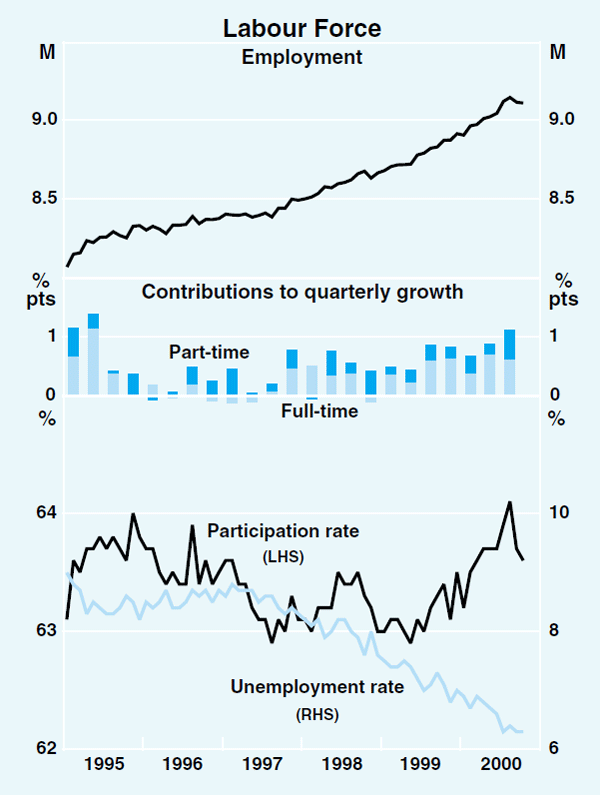
Over the year to the September quarter, employment increased by 3½ per cent, with the gains in employment shared fairly evenly between full-time and part-time positions. Much of the recent strength in employment growth has been in private-sector services, reflecting the relatively strong growth in output of these industries. The most recent monthly figures have shown some volatility in aggregate employment and suggest that some easing in employment growth may now be occurring from the very high rates seen earlier in the year. Nonetheless, labour market conditions overall remain strong.
The strength in employment growth has seen the unemployment rate fall by almost a full percentage point over the past year, with some increase in the participation rate also helping to meet the growing demand for labour (Graph 32). The unemployment rate averaged 6.3 per cent in the September quarter, its lowest level in a decade. At the same time, the participation rate rose to historically high levels. This resulted from an increase in the female participation rate of 1½ percentage points over the past 18 months, presumably buoyed by the recent labour market strength, after remaining flat for the previous three years.
Employment growth has been strongest in New South Wales and Victoria, although most States have continued to record above-trend growth in employment and declining unemployment rates (Table 10). The strength of employment in New South Wales does not appear to have been directly due to the Olympic Games. A rescheduling of the September labour force survey in New South Wales avoided much of the disturbance arising from the direct employment effects of the Games, and, although employment growth was quite strong in Sydney immediately prior to the Games, it was not unusually so. Overall, employment has grown as strongly outside the major capital cities as within them over the past year, with commensurate declines in the rates of unemployment. However, substantial differences persist between regions, with the average unemployment rate in non-metropolitan areas remaining above the national average.
| NSW | Vic | Qld | SA | WA | Tas | Australia | |
|---|---|---|---|---|---|---|---|
| Employment growth | |||||||
| –Year to Sep quarter 2000 | 4.2 | 3.9 | 3.3 | 2.6 | 2.5 | 1.2 | 3.5 |
| Unemployment rate | |||||||
| – Sep quarter 1999 | 6.5 | 7.3 | 8.0 | 8.3 | 6.7 | 9.0 | 7.1 |
| – Sep quarter 2000 | 5.4 | 6.2 | 7.6 | 7.6 | 6.1 | 9.5 | 6.3 |
Labour productivity, measured in terms of output per hour worked, increased by around 1½ per cent over the year to the June quarter. This was slightly slower than the average increase recorded during the course of the current economic expansion, and down from an increase of 2¾ per cent over the preceding year. The slower productivity growth appears to reflect a recent catch-up in employment to the unexpectedly strong output growth seen in the past couple of years.
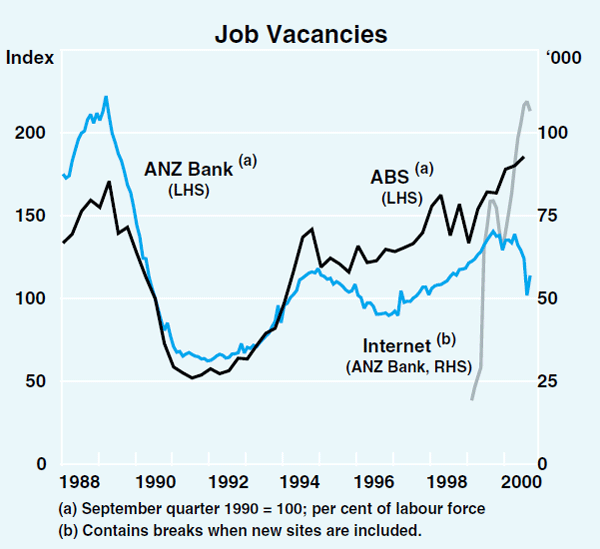
Forward-looking indicators of labour demand have been difficult to interpret for much of the past year, providing contradictory signals about near-term prospects. Newspaper-based measures of job advertisements have been declining for several months. In contrast, the level of job vacancies as reported by the ABS survey of employers has increased for the past six consecutive quarters, supported recently by large increases in the number of vacancies in Victoria (Graph 33). The declines in newspaper job advertisements may partly reflect a movement towards the use of the internet for job search. Internet-based job advertising has been growing rapidly during the past year, though its scope appears to be narrowly based, with advertisements seeking information-technology professionals still dominating internet recruitment sites. The strongest declines in newspaper advertisements have been for tradespersons; advertisements for professionals remain at a high level.
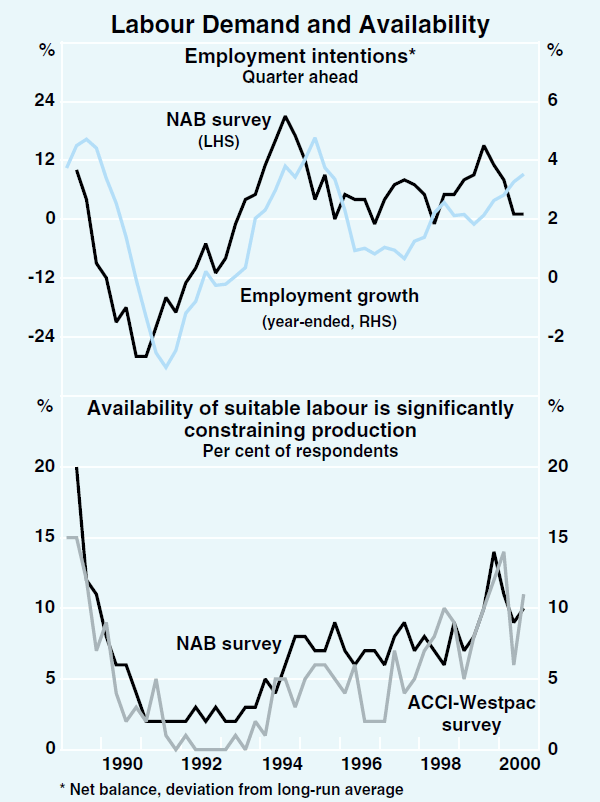
The difficulty firms face in finding suitable labour, as reported in both the ACCI-Westpac survey of manufacturers and the broader NAB survey of business conditions, has eased since a few quarters ago but remains quite high (Graph 34). Employment intentions according to these surveys remain around their long-run average, although they are now well below the high levels seen towards the end of 1999.
Balance of Payments
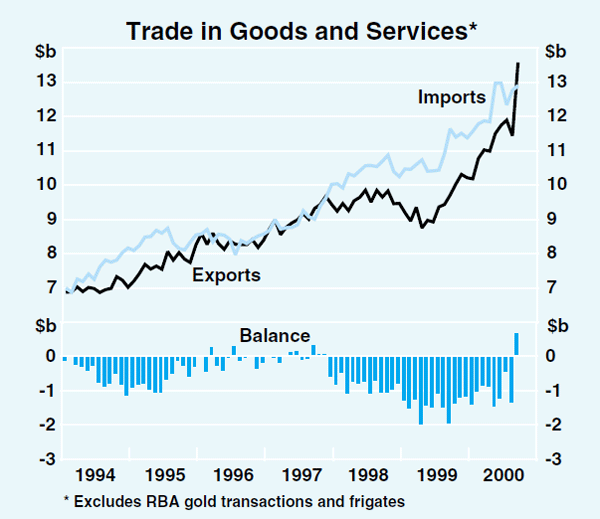
The external accounts have continued the trend improvement of the past year, reflecting robust trading partner growth and the depreciation of the Australian dollar. The Olympics also provided a sizeable once-off boost to exports in the September quarter. The trade deficit narrowed to $1.1 billion in the September quarter, around 0.7 per cent of GDP (Graph 35). Abstracting from the estimated direct effects of the Olympics, the deficit would have been around $2.5 billion, still considerably narrower than the peak reached in the middle of 1999. Assuming the net income deficit remains stable as a share of GDP, the current account deficit in the September quarter would be around 3½ per cent of GDP, or a little over 4¼ per cent excluding the effect of the Olympics.
The value of exports grew by almost 30 per cent over the year to the September quarter, reflecting both higher export prices and robust volume growth. While the growth in the value of service exports was particularly strong, principally due to the boost from the Olympics, strong export growth has also occurred in all major categories (Graph 36) and has been spread across all major destinations (Graph 37). Exports to non-Japan east Asia have grown most rapidly and have now regained the ground lost following the onset of the Asian crisis.
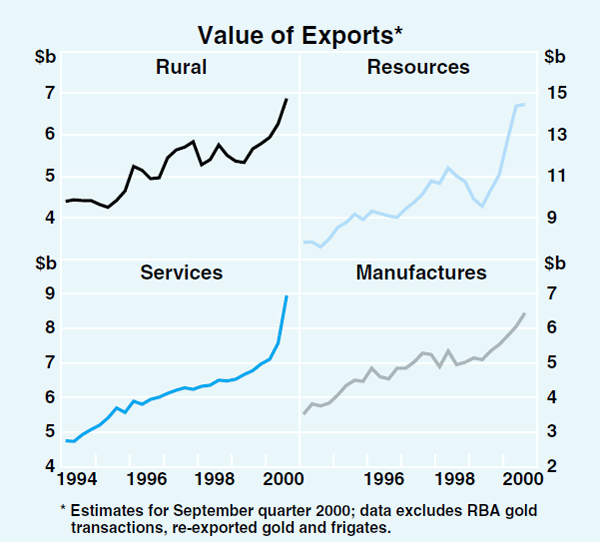
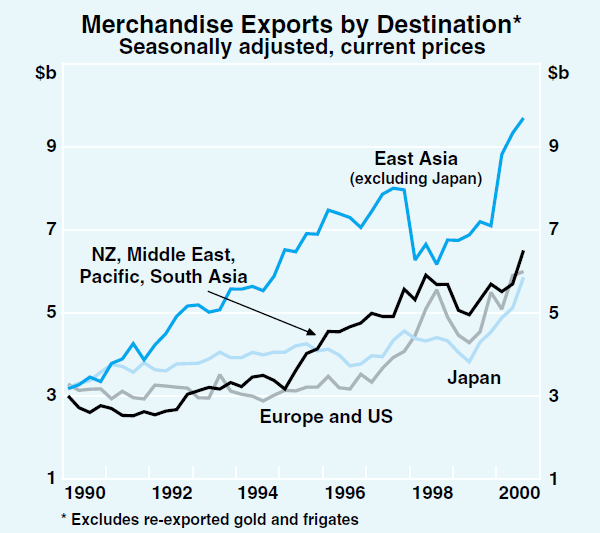
The Olympic Games is estimated to have added about $1.4 billion to service exports in the September quarter, through the sale of overseas broadcast rights and extraordinary inbound tourism, according to the Australian Bureau of Statistics. Increased revenue from tourism has been contributing to strong growth in service export revenue for a number of months: overseas arrivals increased by 6½ per cent in the six months to August, before the surge in September, when arrivals increased by a further 17 per cent. However, the composition of the arrivals changed noticeably in September with arrivals from the US increasing sharply, and those from Asia declining significantly.
Rural export revenues in the quarter were boosted by strong increases in rural prices, particularly for wheat and sugar, coupled with record levels of farm production. Rural export prices rose by about 4 per cent in the quarter while volumes increased by about 5 per cent. Farm production is expected to fall slightly this year according to the Australian Bureau of Agriculture and Resource Economics, from the record level of 1999/00. The wheat crop, in particular, is estimated to be significantly lower than last year's record crop, because of drought conditions in some of the major wheat-growing areas. A locust plague, which is expected to be one of the largest on record, poses a downside risk to the outlook.
The value of resource exports (excluding re-exported gold) has grown by around 40 per cent over the past year, primarily reflecting additional capacity coming on stream, the strong growth in east Asia and rising non-rural commodity prices and the depreciation of the Australian dollar. In particular, higher energy prices have boosted the value of Australia's exports of oil and natural gas. Increased demand for energy is evident also in stronger exports of coal. Resource exports to non-Japan east Asia grew by nearly 40 per cent over the year to September, while exports to Japan increased by around 50 per cent. This growth reflected approximately equal increases in prices and volumes.
Strong trading partner growth and the depreciation of the Australian dollar have also boosted the value of exports of manufactures, which increased by around 16 per cent over the year to the September quarter. Much of the growth continues to be in exports of transport equipment, particularly to the Middle East. Exports of manufactures to east Asia have grown by just under 30 per cent over the past year.
The value of imports of goods and services grew only slightly in the September quarter, with about half of the growth accounted for by higher import prices. The volume of imports has only risen by around 2 per cent in the past six months, considerably slower than the pace earlier in the year. Over the year to September, imports from non-Japan east Asia have increased most rapidly and now account for nearly one-third of all imports (Table 11).
| Share of total | Growth | ||
|---|---|---|---|
| 1999/2000 | 1990/1991 | Year to September quarter 2000 |
|
| East Asia (ex Japan) | 28.1 | 18.1 | 29.4 |
| European Union | 22.7 | 24.3 | 6.4 |
| United States | 21.2 | 23.8 | 9.0 |
| Japan | 13.2 | 18.3 | 21.2 |
| Rest of World | 14.8 | 15.5 | 22.5 |
| (a) Excludes imports of gold | |||
Consumption imports continued to grow strongly in the September quarter, despite the unwinding of pre-GST spending on some imports. Notably, growth in the value of imports of motor vehicles has eased, after stocks of motor vehicles were built up in the first half of the year. This stock build-up occurred in anticipation of stronger demand after 1 July due to tax-related falls in new car prices and the launch of a number of new models. After excluding aircraft, the growth in capital imports has maintained the pace of the first half of the year, reflecting healthy demand for electronic data processing and telecommunications equipment. The value of imports of intermediate goods was boosted by the higher prices for fuels and lubricants, which offset a large decline in imports of goods for processing, primarily gold.
The net income deficit widened slightly in the June quarter, though as a share of GDP, there has been a gradual improvement over the past couple of years. The increase in the deficit in the June quarter was primarily due to growth in dividends paid to foreign holders of Australian equities. Reflecting strong export growth, the ratio of net income payments to exports decreased by 1.6 percentage points over the first half of 2000 to be 13.6 per cent in the June quarter.
Australia's net foreign liabilities increased by $21 billion in the June quarter to $404 billion, around 64 per cent of GDP. Over a third of this increase reflected the better performance of the Australian equity market than those offshore, which boosted the value of foreigners' equity holdings in Australia relative to the value of foreign equities held by Australians. The composition of net inflows of debt and equity has shifted recently. After a few years where equity investment accounted for the bulk of capital inflows, recently debt inflows have been more prominent (Graph 38). This increase in net debt inflows reflects borrowing by the private sector as the public sector has continued to repay foreign debt. Over the year to March the outstanding stock of public sector foreign debt fell by almost $9 billion.
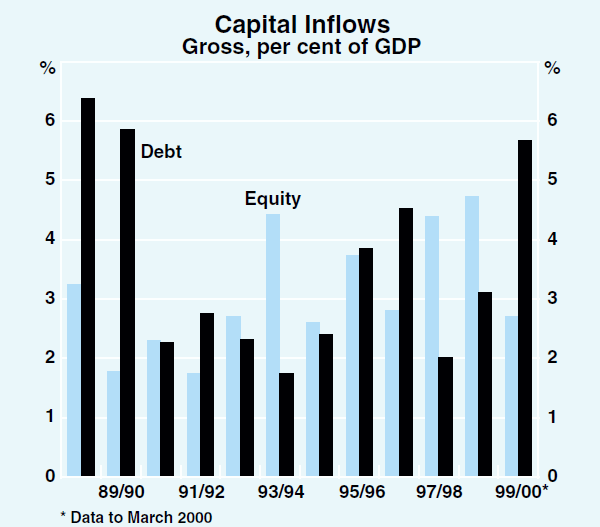
Commodity prices
Commodity prices have increased at a fast pace over the past year, reflecting the strength of the world economy. As discussed in Box A, oil prices have risen to levels not seen since the Gulf War in 1990, and this has boosted the prices of other energy commodities. The Bank's commodity price index increased by nearly 3 per cent in SDR terms over the September quarter and by 10 per cent over the year (Graph 39). In Australian dollar terms, the increase has been much greater, with the index 7 per cent higher over the quarter and nearly 22 per cent higher over the year.
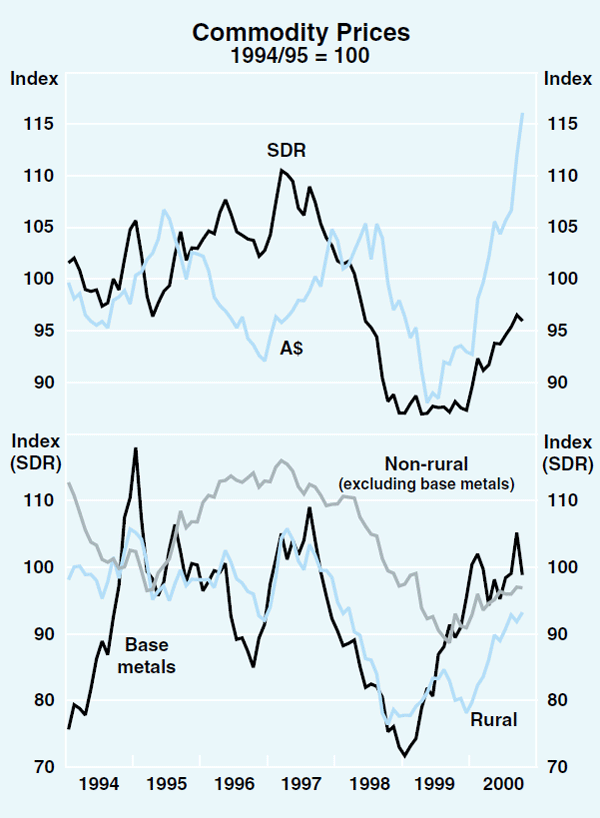
However, in recent weeks, the prices of some commodities, most notably base metal prices, have reversed the gains seen earlier in the year as sentiment about the global outlook has weakened. This is particularly the case for aluminium and nickel prices.
The price of West Texas Intermediate crude oil rose by around 10 per cent in the September quarter and has since risen further to be around 70 per cent higher than the average price for 1999. Some of the increase in price is due to the strength of the global economy, as evidenced by the low level of inventories of many petroleum products and the global shortage of oil tankers. The increase in tensions in the Middle East has contributed to the reversal of most of the fall in price that occurred in late September when the US government announced the release of oil from its strategic reserve. The rise in oil prices has boosted the price of coal and other energy commodities. Coal prices, along with the price of iron ore, have also benefited from a rebound in world steel production, the recovery in Asian demand and tightening supplies in the Asia-Pacific region.
Rural commodity prices rose by 4 per cent in SDR terms over the September quarter and increased further in October. The prices of wheat and sugar have been boosted by expectations of smaller harvests, but beef prices declined a little. Despite falling slightly in recent months, wool prices are 15 per cent higher than a year earlier, supported by demand from China.
Domestic Financial Markets
Market interest rates
The upward trend in short-term market interest rates that began in mid 1999 has levelled out in the past six months (Graph 40). After rising by about 150 points between mid 1999 and May this year, the yield on 90-day bank bills has shown little net change since, and is currently around 6.35 per cent.
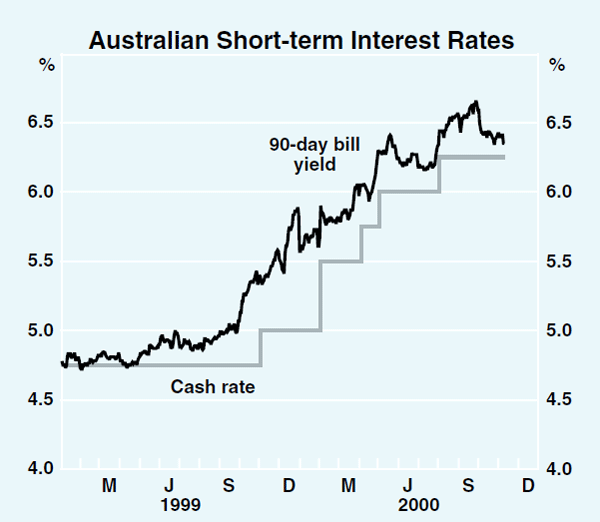
Just as the rise in market yields over the year to mid 2000 was in anticipation of the tightening of monetary policy that has taken place over the past year, the more recent flattening in these yields reflects a view that official interest rates may be at or near the peak, at least for the time being. For the first time since mid 1999, the pattern in short-term yields, including in futures markets, is suggesting that the probability of further monetary tightening is low.
Markets moved to this view following the Bank's decision to keep the cash rate constant in October and it was reinforced by the publication of inflation data which were better than expected. It is also in line with developments overseas, particularly in the US, where markets in the past six months have swung from expectations of further tightening by the US Fed to pricing in some likelihood of an easing in the first half of next year.
Since mid year, long-term bond yields in Australia have moved around a flat trend, within a range of between 6 and 6¼ per cent (Graph 41), which is about a percentage point lower than their level at the start of the year. The flat trend in Australian yields over the past four months is in contrast to some fall in US yields. As a result, whereas there was little difference between Australian and US long-term bonds yields around mid year, Australian yields are now about 30 basis points above corresponding US yields (still low by decade average comparisons).
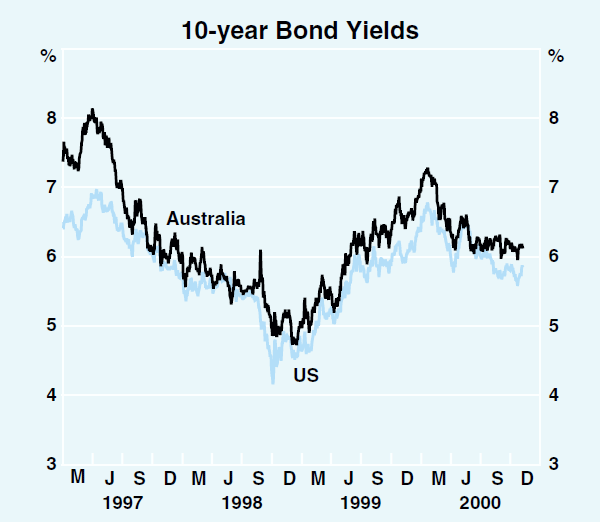
With the strong growth in the non-government bond market in Australia (the stock of non-government bonds is now larger than the stock of either Commonwealth or State government bonds), developments in this market segment have become more relevant.
Yields on bonds issued by highly-rated non-government borrowers (AA or better) have fallen by less in 2000 than yields on CGS (Graph 42). That is, the spread between these bonds and government bonds has widened. This mainly reflects the rise in the credit spread on the debt of Telstra, the largest corporate borrower in Australia. Credit spreads on debt of all telecoms around the world have risen in the past six months, as markets have become concerned that excessively high prices may have been paid in recent auctions of spectrum licences. Abstracting from Telstra debt, spreads on other highly-rated Australian borrowers have not changed much, although there has been some rise over the past month or so. Spreads on lower-rated debt have also risen somewhat recently, though the deterioration in spreads has been much less than in the US, where credit concerns have risen significantly in recent months. This less pronounced rise in spreads in Australia is due to the fact that, whereas in the US there are clear expectations of a slowing in economic activity, the economic outlook in Australia is more robust. The sharp downturn in the US share market would also have heightened credit concerns.
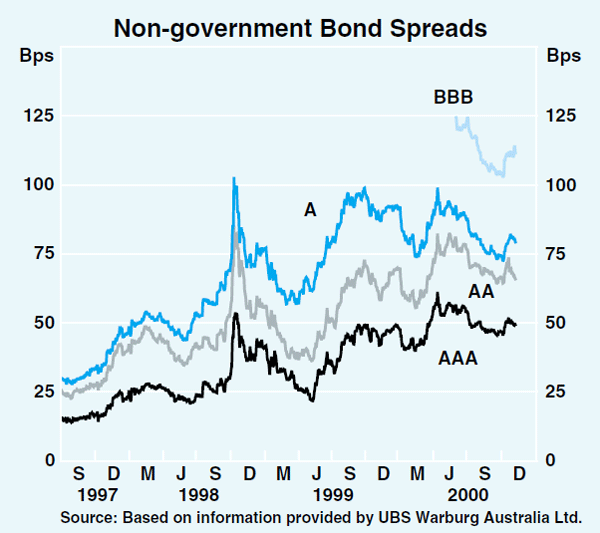
Less concern about a deterioration in credit quality in Australia may also explain the stronger performance of bank share prices in Australia relative to those in the US over the past year. Share prices of US banks have weakened significantly although they have recovered a bit as expectations have taken hold that the US interest rate cycle has peaked.
Issuance in the non-government market has remained strong over the past six months, with bonds outstanding rising by another $10½ billion, to $77.5 billion as at end October (Graph 43). The flow of new issues did slow in the June quarter as investor demand stalled temporarily in response to rising corporate bond spreads and the anticipated downgrading of Telstra's credit rating. But the September quarter saw a resurgence in issue activity to around previous record levels. This, however, was concentrated in the financial, non-resident and asset-backed sectors. Issuance by corporates has tended to slow. This is consistent with the pattern in other sources of corporate financing this financial year; both credit and IPOs have slowed over recent months (Table 12). It is too early, however, to conclude whether this reflects some underlying slowdown in the pace of financing, simply some noise in the data, or a lull due to the Olympics.
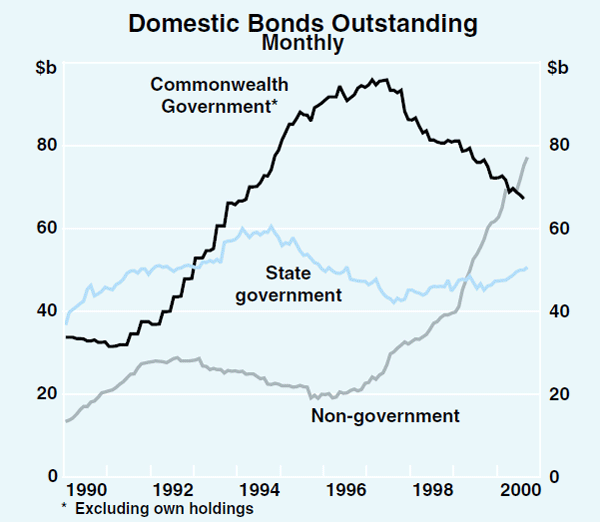
| Year to June 2000 |
July-October 2000 |
|
|---|---|---|
| Credit (per cent per month) | 0.7 | 0.4(a) |
| Bond issuance ($m/month)(b) | 590 | 536 |
| IPOs ($m/month)(c) | 525 | 190 |
| (a) July to September (b) Corporate issuance only (c) Excludes privatisations |
||
Intermediaries' interest rates
The major influence on intermediaries' interest rates over the past year or so has been the tightening of monetary policy. In addition, some banks increased rates on some business loans to reflect the fact that their overall wholesale funding costs had risen faster than the cash rate. Also, a range of rates was increased by a few basis points by some banks to cover costs associated with the introduction of the GST. (Financial services are ‘input-taxed’, meaning that providers of financial services cannot claim a tax credit for these costs.)
Movements in, and the level of, selected lending rates of intermediaries are summarised in Table 13.
| Change since October 1999 |
Current level |
Level of cyclical low in 1993/94 |
|
|---|---|---|---|
| Household | |||
| Housing | |||
| Standard variable | 1.50 | 8.05 | 8.75 |
| Basic | 1.55 | 7.50 | na |
| Personal | |||
| Residential-secured overdraft | 1.55 | 8.20 | 9.75 |
| Credit card(a) | 1.40 | 16.70 | 14.35 |
| Memo item: | |||
| Mortgage managers' rate | 1.60 | 7.80 | 7.70 |
| Business | |||
| Small Business | |||
| Residential-secured | |||
| – Overdraft | 1.65 | 8.60 | na |
| – Term | 1.55 | 8.20 | na |
| Other(b) | |||
| – Overdraft | 1.75 | 9.20 | 9.30 |
| – Term | 1.65 | 8.70 | na |
| Large Business | |||
| – Overdraft | 1.80 | 9.75 | 9.00 |
| – Term | 1.70 | 9.60 | na |
| Cash Rate | 1.50 | 6.25 | 4.75 |
| (a) With interest-free period (b) Both secured by other assets and unsecured |
|||
Banks matched rises in the cash rate in lifting their housing rates, with the standard variable rate now 8.05 per cent, on average. This remains 70 basis points lower than at the cyclical low-point in interest rates in 1994.
Interest rates on most personal loans have risen by a similar amount to the cash rate over the course of this tightening cycle. Business indicator rates have, on average, increased by a little more than the cash rate, for the reasons mentioned above, though rises in the interest rate on residentially-secured term loans for small businesses, a popular product, have been broadly in line with the cash rate (Graph 44). The all-up interest cost of variable-rate loans to small businesses (i.e. indicator rates plus applicable risk margins) has increased a little less than the cash rate. It increased about 1.1 percentage points between September 1999 and June 2000, compared with a rise in the cash rate of 1.25 percentage points over that period.
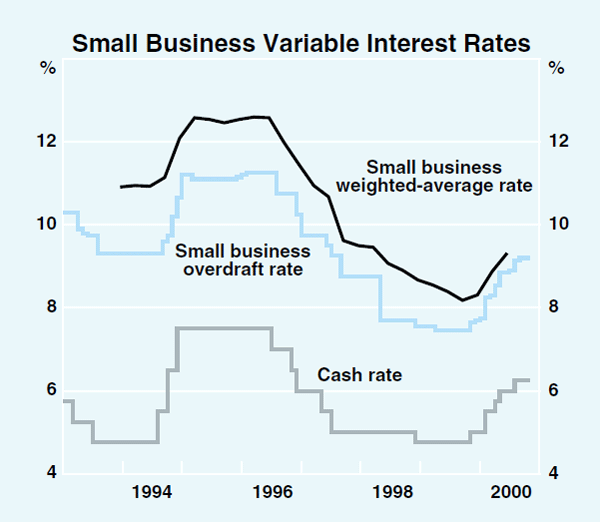
Interest rates on fixed-rate loans for housing and small businesses have fallen from their peaks of early this year. This reflects falls in capital market interest rates which form the basis for the banks' pricing of retail fixed rates (Graph 45).
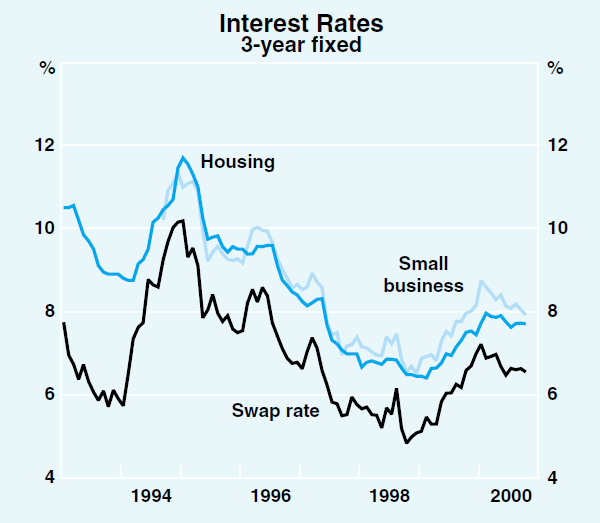
Share market
By international standards, the Australian share market has performed well over the past six months or so. The ASX 200 has risen by 8 per cent since end April, compared with a slight fall in broad-based share price indexes in the US over the same period (Graph 46). The Australian market reached a new high in August, and again in early November.
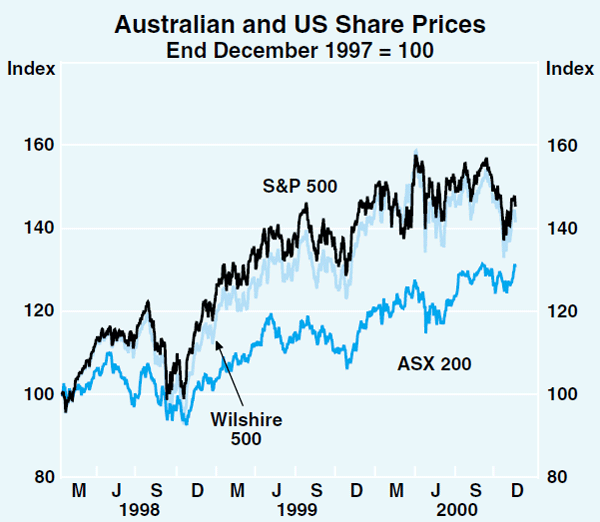
The relatively good performance of the Australian share market has been underpinned by the banking and finance sector and the resources (excluding gold) sector (Graph 47). Share prices of companies in banking and finance have risen by 19 per cent over the past six months, reflecting the sector's strong earnings record. The index of share prices of resource companies (excluding gold producers) rose by 14 per cent over the same period, due to a combination of strong earnings growth, takeover activity and higher commodity prices, including oil prices, especially when measured in Australian dollars. The industrial sector (excluding banks and insurance) has been volatile, often driven by fluctuations in the share price of News Corporation. (News Corporation accounts for about 13 per cent of total market capitalisation.) News Corporation's share price has recently fallen which, together with continuing weakness in the price of telecoms, has caused the price index for the ‘other industrials’ segment of the market to show little net change in recent months. The fall in telecom stocks in Australia is part of a global trend (Graph 48).
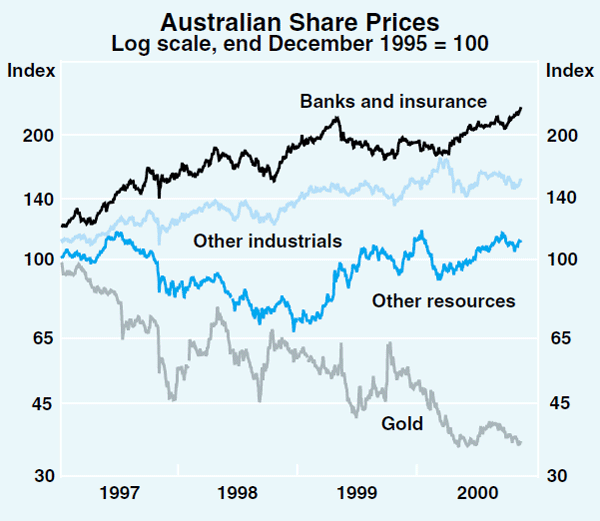
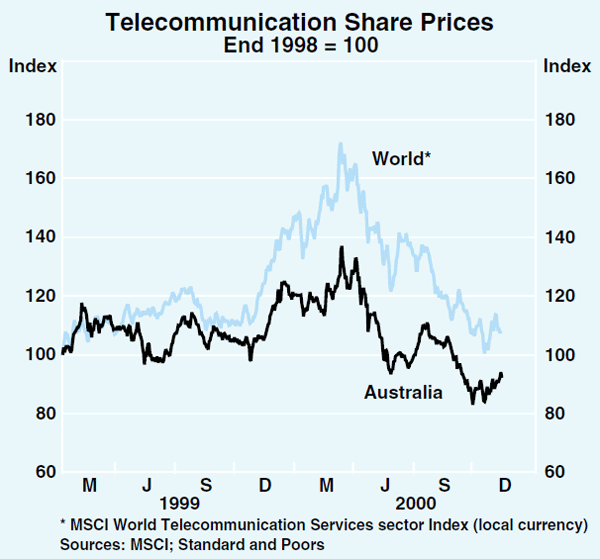
Share prices of technology stocks, particularly online retailers, have also fallen sharply in Australia, as they have in all countries. The earlier extreme optimism that characterised investors in these shares has been deflated in part by disappointing earnings results (Table 14). Compared with earlier highs, share prices of online retailers have, on average, fallen by around 70 per cent in both Australia and the US. These stocks now also tend to be significantly below their issue prices.
| Australia | US | |||
|---|---|---|---|---|
| Since end 1999 |
Since peak in 2000 |
Since end 1999 |
Since peak in 2000 |
|
| Overall market | 7 | 0 | −3 | −6 |
| Telecommunication stocks(a) | −22 | −31 | −18 | −18 |
| Technology stocks(b) | −6 | −32 | −16 | −32 |
| Online retailers | −67 | −72 | −69 | −71 |
| (a) Weighted average of S&P Telecommunications (Long Distance) Index
and S&P Telephone Index (b) UBS Warburg Technology Index for Australia and Nasdaq for US |
||||
Financial aggregates
Credit growth remains strong, although it has moderated in recent months (Graph 49). Total credit grew at an annual rate of 12 per cent over the 6 months to September, compared with the 15 per cent growth recorded over the six months to June (Table 15).The deceleration, which is evident in both business and household activity, may reflect a response to earlier increases in interest rates, although the GST and to a lesser extent the Olympic Games are likely to have affected recent data. Both housing and business borrowing accelerated in the June quarter but subsequently slowed, probably reflecting a tendency to draw down loans and finalise payments ahead of the GST. The Olympic Games may have also served to dampen lending activity in both sectors in September. Overall, annualised 6-month growth in household and business credit is running at around 16 per cent and 9 per cent, both around 2 percentage points below growth rates in March.
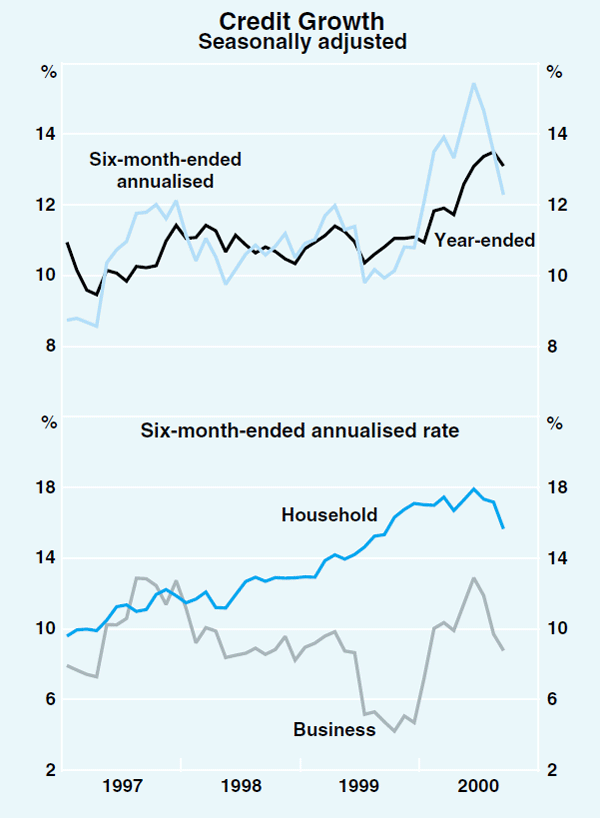
| Six months to: | Three months to: | ||||||
|---|---|---|---|---|---|---|---|
| March 2000 | June 2000 | September 2000 | March 2000 | June 2000 | September 2000 | ||
| Total Credit | 13.9 | 15.4 | 12.3 | 15.6 | 15.3 | 9.4 | |
| – Personal | 18.4 | 15.0 | 14.1 | 17.4 | 12.8 | 15.4 | |
| – Housing | 17.2 | 18.7 | 16.1 | 18.0 | 19.4 | 12.9 | |
| – Business | 10.4 | 12.9 | 8.8 | 13.3 | 12.5 | 5.2 | |
| Currency | 7.0 | 6.1 | 10.4 | 4.0 | 8.2 | 12.8 | |
| M3 | 5.2 | 10.1 | 9.2 | 7.0 | 13.3 | 5.2 | |
| Broad money | 6.9 | 8.7 | 8.5 | 11.4 | 11.0 | 6.0 | |
| (a) Adjusted for privatisations and infrastructure bond purchases. | |||||||
Growth in the deposit aggregates has generally picked up since March, with growth particularly strong in the June quarter. The rates of increase in M3 and broad money have subsequently eased to be running at annual rates well below their mid-1999 peak. The continuing slower growth of money relative to credit reflects the fact that intermediaries are funding some domestic lending with international raisings. Over the 6 months to September, funds raised internationally by all financial institutions grew at an annualised rate of 37 per cent.
Funds under management grew by a robust 3.6 per cent in the June quarter, to be 13 per cent higher than a year earlier (Table 16). The increase in assets in June reflected strong growth in Australian equities outweighing a decline in foreign assets, and was consistent with the outperformance of the Australian equity market over the period. Domestic equities and units in trusts now account for nearly one-third of total assets of managed funds. The addition of overseas assets, which are predominantly equities, increases the ratio to 50 per cent, a 4 percentage point increase since end June 1999.
| Percentage change | % of total | ||
|---|---|---|---|
| June 2000 | Year to June 2000 | ||
| By Asset: | |||
| Cash & deposits | 6.3 | 6.8 | 7 |
| Loans & placements | 2.0 | 13.8 | 5 |
| Short-term securities | 3.4 | −8.8 | 10 |
| Long-term securities | 2.9 | 7.0 | 13 |
| Equities & units in trusts | 8.0 | 23.0 | 31 |
| Land & buildings | 2.6 | 13.2 | 11 |
| Assets overseas | −3.6 | 22.0 | 19 |
| Other assets | 11.7 | 3.4 | 4 |
| Total | 3.6 | 13.0 | 100 |
Growth in margin lending for equities has slowed. In the September quarter, it rose by 3 per cent, whereas it had been growing at a quarterly rate of about 10 per cent at around the turn of the year. Margin lending now represents about 8 per cent of all personal loans (excluding housing).
In the September quarter, the main lending institutions have provided additional information about margin lending. This is summarised in Table 17.
| Total margin debt ($b) | 6.7 |
|---|---|
| Total margin loans approved ($b) | 12.2 |
| Credit limit use (per cent) | 55.0 |
| Value of underlying shares ($b) | 13.2 |
| Leverage (per cent) | 51.0 |
| Number of margin loans ('000) | 86.4 |
| Average loan size ($'000) | 78.0 |
| Number of margin calls ('000) | 12.1 |
Total margin debt is currently about $6¾ billion, representing slightly more than half of the limits approved by financial institutions. These loans are backed by a total share portfolio of about $13.2 billion, representing about 2 per cent of total share market capitalisation. The average leverage ratio (the ratio of loans to shares) is 51 per cent, well below the maximum rate of 70 per cent that banks say they will make available for ‘blue chip’ shares.
Banks and brokers had about 86,000 customers with margin loans at end September, with an average loan of just over $78,000. There were just over 12,000 margin calls to customers in the September quarter. Anecdotal evidence is that the frequency of margin calls has recently increased and that, when calls are made, instead of subscribing new money, borrowers usually instruct the lending institution to sell shares.
Inflation Trends and Prospects
Recent developments in inflation
Consumer prices
The Consumer Price Index increased by 3.7 per cent in the September quarter and by 6.1 per cent over the year (Graph 50). Most of the rise in the quarter reflected the net effect on prices of the introduction of the GST and the removal of wholesale sales tax (WST) on 1 July. However, the size of the net tax effects cannot be determined with certainty. Standard measures of underlying inflation that are normally used to extract temporary factors were also significantly affected by the tax changes (Table 18), and hence they cannot be used as indicators of the non-tax-related component of inflation. Based on earlier estimates of the tax effects published by the Treasury and the Australian Competition and Consumer Commission (ACCC), the tax changes appear to have contributed around 2½–3 percentage points to the CPI increase in the September quarter. While estimates of the tax effects are subject to a range of uncertainty, underlying inflation net of tax effects appears to have been around 2¼ per cent over the year to the September quarter.
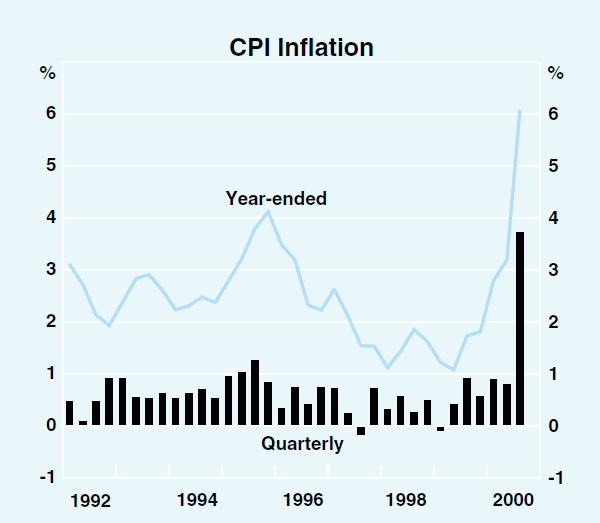
| Quarterly | Year-ended | ||||
|---|---|---|---|---|---|
| June 2000 | Sep 2000 | June 2000 | Sep 2000 | ||
| Headline CPI | 0.8 | 3.7 | 3.2 | 6.1 | |
| – Tradeables | 1.0 | 2.1 | 2.0 | 3.4 | |
| – Non-tradeables | 0.7 | 5.1 | 4.2 | 8.4 | |
| CPI excluding volatile items | 0.6 | 3.5 | 2.6 | 5.5 | |
| Market goods and services excluding volatile items | 0.6 | 3.7 | 2.4 | 5.6 | |
| Weighted median(a) | 0.4 | 3.6 | 2.4 | 5.4 | |
| Trimmed mean(a) | 0.6 | 3.9 | 2.7 | 5.9 | |
| (a) For details on the calculation of these measures, see ‘Measuring Underlying Inflation’, RBA Bulletin, August 1994. | |||||
The net effect of taxes on the September quarter CPI appears to have been less than was expected, a result that is open to a number of possible interpretations. Some businesses may have delayed passing on the tax increases to consumers and instead absorbed part of the tax in their profit margins, presumably with the potential to reverse some or all of that absorption at a later date. Another possibility is that the WST removal may have flowed through to final prices more quickly than anticipated. In that case, the price reductions that had been expected to come from this source in the next couple of quarters would be correspondingly less. Still another possibility is that the initial estimates of the long-run tax effects may turn out to have been too high. Most likely, more than one of these factors is at play, and their relative importance should become clearer as future developments in consumer prices unfold.
The September quarter is the first quarter of data for the 14th series CPI, which introduces a new set of weights based on the 1998/99 Household Expenditure Survey and a re-organisation of expenditure components into eleven expenditure groups, compared with the previous eight. The revision of weights in the CPI basket is one factor that contributed to a smaller net tax effect than previously estimated for the September quarter, in part due to a higher weight on motor vehicles, the prices of which were reduced by the tax changes.
Increases in retail petrol prices, of around 10 per cent, also contributed significantly to CPI inflation in the September quarter. Over the year to the September quarter, retail petrol prices have increased by 24 per cent, contributing 1 percentage point to inflation. The increases continue to reflect a combination of a higher world price for crude oil and further depreciation of the exchange rate.
Apart from rising petrol prices, the major contributions to the CPI increase in the September quarter were from prices of items that became subject to GST but whose costs were not previously heavily affected by the WST, for example house purchase, tobacco, domestic holiday travel and accommodation, meals out and take-away foods, and telecommunication. Partly offsetting these increases were price falls mainly for items that were formerly taxed at relatively high rates under the WST regime, for example motor vehicles and audio, visual and computing equipment. Prices of the latter items appear to have fallen more during the past year than could be explained by the removal of WST. Some government subsidies, which were introduced as part of the tax package on 1 July, also had an influence on prices in the September quarter CPI. The First Home Owners' Scheme, which provides a grant of $7,000 to first home buyers, had a small negative effect on the recorded rise in house purchase prices in the quarter, and is likely to have subtracted around 0.1 percentage point from the CPI. The new Child Care Benefit Scheme, which replaces two previous assistance schemes, led to a 15 per cent fall in the effective price of child care, and also subtracted close to 0.1 percentage point from the CPI in the quarter.
The exchange rate and inflation
In import-weighted terms, the Australian dollar has depreciated by around 14 per cent since the beginning of the year (Graph 51). Over the course of the year, the exchange rate depreciation has contributed to the increase in the Australian-dollar price of crude oil, with the pass-through to the retail petrol price, and therefore CPI inflation, occurring quite rapidly. Apart from the effect via oil prices, the exchange rate depreciation has also been evident more broadly in import prices at the docks and in the prices of manufacturing inputs, with some of that effect likely to have flowed through to prices of final manufactured goods.
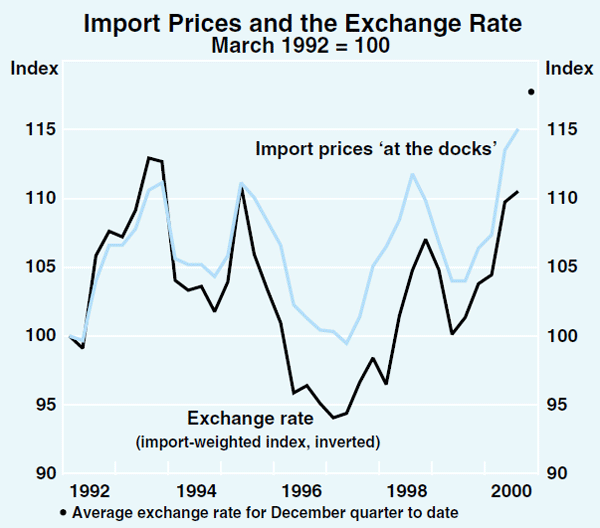
The effect of the depreciation on the prices of items in the CPI other than petrol is more difficult to establish, partly due to the dominant influence of tax effects on the September quarter CPI, and partly due to the more protracted pass-through of exchange rate movements to retail prices in recent years. Nonetheless, a smaller than expected fall in the retail price of imported motor vehicles (of 1.3 per cent in the quarter) may be partly attributable to the depreciation of the exchange rate in recent quarters. Moreover, the further depreciation over the past two months is yet to appear in the consumer prices data. While firms might be expected to offset some of the depreciation with temporarily reduced margins and the use of exchange-rate hedges, their scope to absorb the price impact of a sustained depreciation may be limited, particularly if margins have already been squeezed by absorption of some of the tax effects and by the effects of earlier exchange rate depreciation which was not fully passed on.
Producer prices
Aggregate indices of producer prices by stage of production have recorded strong increases during the past year, particularly at the preliminary and intermediate stages of production (Table 19). With the exception of construction prices, where input costs had been affected by the WST, producer price indices are not affected by the recent tax changes. The increases over the past year have in part reflected rapidly rising prices of commodities such as petroleum and basic metal products, as well as more broadly based increases in other raw materials costs. Final producer prices, excluding export prices, increased only moderately in the September quarter but are still significantly higher over the year. Around a third of the increase in final prices over the past year reflects the rise in petroleum and chemical product prices; excluding this item, final prices increased by 3.2 per cent.
| September quarter 2000 | Year to September quarter 2000 | |
|---|---|---|
| Stage of production | ||
| Preliminary | 2.4 | 8.8 |
| Intermediate | 1.8 | 7.1 |
| Final (excluding exports) | 0.5 | 4.6 |
| Manufacturing | ||
| Input prices | 3.5 | 18.0 |
| – Domestic | 4.3 | 19.8 |
| – Imported | 2.1 | 15.5 |
| Final prices | 1.9 | 7.2 |
| – Excluding petroleum | 0.2 | 3.9 |
| Construction | ||
| Materials used in house building | −0.8 | 3.3 |
| Materials used in other building | −1.6 | 0.3 |
| Services | ||
| Transport and storage | 0.0 | 1.7 |
| Property and business services | 2.0 | 6.6 |
| Merchandise trade | ||
| Export Prices | 2.1 | 17.9 |
| Import Prices | 1.3 | 10.9 |
Part of the disparity between the price increases at earlier and later stages of production reflects the greater importance of raw commodities as a share of costs at the earlier stages of production. As inputs from earlier stages of production represent only a portion of the cost of producing final goods, final prices would not need to rise by as great a percentage as the increase in input costs for profit margins to be maintained. Even allowing for that, however, there may have been some absorption of rising input costs recently, which could imply further upward pressure on final prices if the higher input costs are sustained.
Industry-specific price indices point to relatively strong increases during the past year in manufacturing (in both input and output prices) and in some service industries. In the construction industry, materials prices fell in the September quarter following the removal of the WST. Excluding this effect, the prices of construction materials for both housing and other building increased in the quarter, but at a slower pace than had been evident during the previous year, consistent with recent indications of a decline in demand pressures in the building industry.
Labour costs
The wage cost index (WCI) and average weekly ordinary-time earnings (AWOTE) measures continue to provide differing pictures of recent wage developments (Graph 52, Table 20). The WCI increased by 2.8 per cent over the year to the June quarter 2000, unchanged from the year-ended rate recorded in the March quarter. In contrast, preliminary estimates suggest that AWOTE increased by 5.9 per cent over the year to August, a sharp pick-up from the growth rate of 2.1 per cent recorded a year earlier. The differences between these two measures reflect their differing sources and methods of construction as well as an important conceptual difference, with the WCI being a measure of the change in wage rates, while AWOTE is a measure of the change in the wage bill. Some implications of these differences are discussed in Box C.
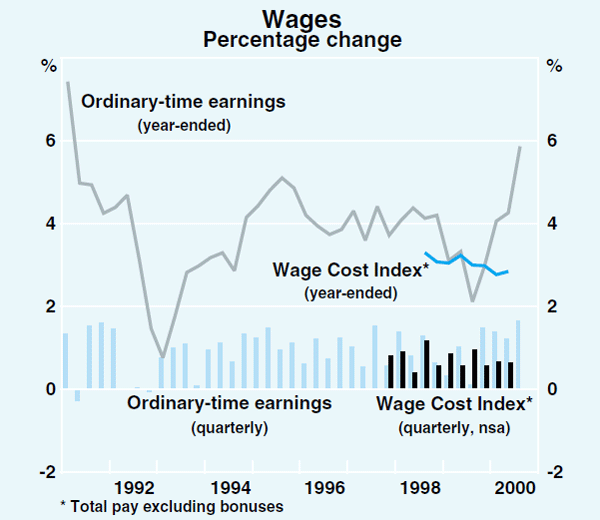
| Mar 2000 | June 2000 | Sep 2000 | |
|---|---|---|---|
| Wage cost index(a) | |||
| Private | 2.9 | 2.9 | |
| Public | 2.5 | 2.7 | |
| Total | 2.8 | 2.8 | |
| Average weekly earnings survey | |||
| AWOTE | 4.1 | 4.3 | 5.9 |
| AWE | 2.8 | 3.9 | 6.5 |
| Executive remuneration | |||
| Base salaries | 4.6 | 4.5 | 4.6 |
| New federal enterprise agreements(b) | |||
| Private | 3.6 | 3.8 | |
| Public | 3.1 | 3.0 | |
| Total | 3.4 | 3.4 | |
| (a) Total pay excluding bonuses (b) Average annualised increase |
|||
The volatile nature of the AWOTE data makes it difficult to assess the extent to which these data may indicate an increase in underlying wage pressures at present. The series is susceptible to compositional change in the employment survey underlying the estimates, and the recent strong increase could at least partly represent a reversal of any such effects that may have contributed to the unusually low growth recorded a year ago. That interpretation would be consistent with the overall picture presented by other wage indicators, which do not record either the sharp dip or subsequent pick-up in wage pressures. On the other hand, in an environment of declining unemployment, strong growth and, more recently, rising inflation, it is possible that the survey is signalling some genuine pick-up in wages growth, even if its extent is overstated. A clearer interpretation of these trends should be possible once the other major measures of wages for the September quarter become available.
At this stage, data for new enterprise agreements appear broadly consistent with the wages picture given by the WCI up to the June quarter. The average annualised wage increase yielded by enterprise agreements certified in the June quarter was 3.4 per cent, unchanged from the previous two quarters and noticeably below the figures being recorded two to three years ago. There are some signs, however, that these may have begun to pick up, with a number of more recent agreements yielding somewhat higher increases than were observed earlier in the year.
Recent business surveys also point to some modest upward pressure on wages growth in the context of a tightening labour market. The NAB survey of non-farm businesses indicates that growth in actual and expected labour costs has continued to pick up, albeit slowly. The September quarter ACCI-Westpac survey of manufacturers indicates that the net balance of firms finding it more difficult to obtain labour remains close to cyclical peak levels. Both surveys suggest that where firms are due to complete a new enterprise agreement, these are expected on average to provide for higher wage increases than the agreements they replace.
In some instances, wage increases from enterprise agreements could be subject to modification in light of the effect of the recent tax changes on the CPI. Some agreements contain clauses that provide for a full or partial indexing of wages to the CPI, while others provide for wage increases to be reviewed in the event that the effects of the GST on inflation exceed expectations or exceed some defined benchmark. In these latter cases, agreements vary as to how the benchmark is defined and the period over which the tax effect is to be assessed, and the provisions are in many cases open to interpretation by the parties to the agreement. Hence the overall impact of such renegotiation clauses remains uncertain. Nonetheless, the proportion of agreements that contain a GST-related clause has remained quite low, and the lower-than-expected outcome for the CPI in the September quarter appears at this stage to have reduced the likelihood of significant additional wage increases being generated by this mechanism.
The Mercer Cullen Egan Dell salary review indicates that growth in executive pay has been relatively stable for some time now. The September quarter survey indicates that the base salary of executives has been growing at around 4½ per cent over the past year. The base salary component does not incorporate any bonuses or returns from participation in corporate share schemes.
The Australian Council of Trade Unions announced in early November that it intends to make an application to the Australian Industrial Relations Commission to vary award rates of pay. The claim, to be heard as part of the Safety Net Review early next year, will seek a $28 per week increase in pay for all weekly award rates from the federal minimum wage ($400.40 per week) up to $492.20, and a 5.7 per cent increase for award rates above this level.
Inflation expectations
Consumers' expectations of inflation have declined considerably in recent months after the sharp increases seen in the period leading up to the implementation of the GST (Graph 53). According to the Melbourne Institute survey, the median inflation expectation in October was 4.5 per cent, about the same as had been recorded in the previous couple of months but well down from the peak of over 8 per cent in June. The survey also suggests a tighter concentration of responses in the 2–3 per cent range, with a declining number of consumers expecting inflation of 10 per cent or more. The results thus seem consistent with consumers increasingly expecting the effect of the tax changes to be of a one-off nature rather than representing a general rise in ongoing inflation. The recent declines bring consumers' inflation expectations back to around the levels prevailing in early 1999.
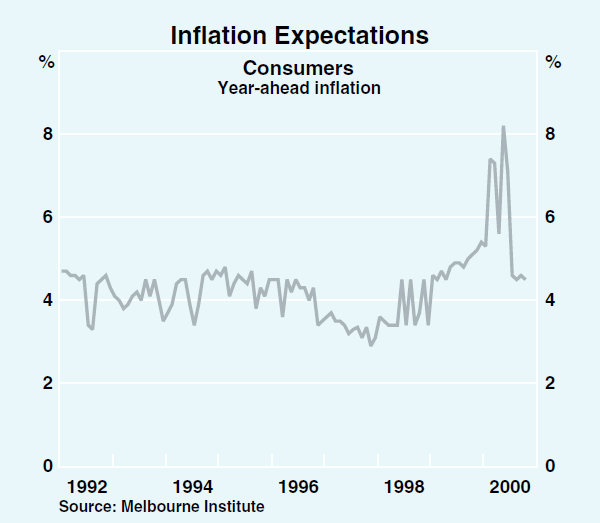
The latest business surveys indicate that price increases following the introduction of the GST were lower than expected, although there was a pick-up from earlier quarterly rates. The outlook reported by businesses for the coming quarter is for a smaller increase in prices than occurred in the September quarter, but one that is still relatively high. Abstracting from the September quarter, both the broad NAB survey and the ACCI-Westpac survey of manufacturers suggest that there has been some upward trend in ongoing inflation in recent quarters. In part, this is likely to have reflected the effects of higher oil prices and the recent depreciation of the Australian dollar.
The inflation forecasts of financial-market economists changed only slightly in the latest survey conducted by the Bank following the release of the September quarter CPI (Table 21). The median forecast for the year to June 2001 declined to 5.4 per cent; excluding tax effects, the forecast was unchanged at 2.8 per cent, which implies that the downward revision comes from lower estimates of the effect of the tax changes on the CPI over this period. The median inflation forecast for the year to June 2002 increased slightly to 2.4 per cent. The majority of respondents do not expect the tax changes to affect inflation over the year to June 2002. It is likely that respondents' inflation forecasts incorporate assumptions of some reversal of recent exchange rate and oil price movements.
| Year to June 2001 | Year to June 2002 | |||||
|---|---|---|---|---|---|---|
| May 2000 | August 2000 | November 2000 | August 2000 | November 2000 | ||
| Market economists(a) | ||||||
| CPI | 5.3 | 5.5 | 5.4 | 2.3 | 2.4 | |
| – Excluding GST | 2.6 | 2.8 | 2.8 | 2.4 | 2.4 | |
| Union officials(b) | ||||||
| ‘Inflation’ | 4.8 | 5.3 | 6.0 | 4.2 | 5.0 | |
| (a) RBA survey (b) ACIRRT survey |
||||||
Trade union officials, as surveyed by the Australian Centre for Industrial Relations Research and Training (ACIRRT) following the release of the September quarter CPI, continue to revise up their forecasts for inflation for the year to June 2001. Somewhat surprisingly, union officials expect inflation to remain high in the following year, despite the tax effects dropping out of the annual inflation rate.
Longer-term inflation expectations of financial market participants, measured by the difference between nominal and indexed 10-year bond yields, have remained relatively stable since April, at between 2¾ and 3 per cent, after reaching a peak of 3¾ per cent in mid January.
Inflation outlook
The tax effects which caused the headline measure of inflation to increase sharply in the September quarter will keep the headline inflation rate high in year-ended terms until they drop out of the calculation in the September quarter 2001. As discussed above, there are considerable uncertainties in estimating the net contribution of the tax changes to the quarterly and annual inflation figures, and hence it is more difficult than usual to extract a measure of the underlying trend. At this stage inflation excluding tax effects, and also excluding the effects of oil and other temporary factors, appears to have been around 2¼ per cent over the latest year.
On this basis, inflation remains noticeably higher than it was a year ago, even if the upward trajectory does not appear to have continued into the September quarter. The overall increase in inflation over the past year has had some industry-specific elements, notably in relation to house prices and petrol prices, but looks to have been driven more broadly by the continued strength of the domestic economy. With GDP having grown at an annual rate of 4¾ per cent during the past three years, and levels of capacity utilisation increasing, demand conditions have clearly been placing greater upward pressure on prices than was the case a couple of years ago.
At this stage, the recent depreciation of the Australian dollar does not seem to have had a noticeable impact on consumer prices apart from petrol, but, if the exchange rate remains around current levels, it will clearly represent a source of upward pressure on prices in the next one to two years. In import-weighted terms, the exchange rate has depreciated by a further 6 per cent in the past two months, to be 14 per cent lower than it was at the beginning of the year. While importers may to some extent be able to hedge against currency movements and temporarily absorb exchange rate changes within their profit margins, their scope to do so may be quite limited given that margins may already have been squeezed by absorption of some tax effects and higher input costs.
Another important near-term factor for inflation will be developments in international oil prices. Higher crude oil prices, with the lower exchange rate, have resulted in a large increase in domestic petrol prices. As in other countries, this has added about 1 percentage point to the CPI increase over the latest year, and has added significantly to business input costs. In assessing underlying inflation prospects, the Bank seeks to abstract from the initial impact of oil prices in much the same way as is done for tax effects, but to be alert for signs that higher fuel costs are feeding into inflation on a more sustained basis through indirect channels. Oil prices are unlikely to contribute to headline inflation in the year ahead to the same extent that they have in the recent past, and indeed the Bank's forecasts assume that there will be some decline in international oil prices in the period ahead. Were oil prices to remain at current high levels, that would probably imply some upward pressure on underlying inflation in the near term as the indirect effects of higher fuel costs flow through to the general price level.
Longer-term prospects for inflation will depend importantly on developments in labour costs. Wage indicators have provided mixed signals recently, with the wage cost index and data on new enterprise agreements indicating that wages growth remained moderate up to mid 2000, while more timely data on ordinary-time earnings point to a sharp pick-up in wages growth over the year to August. These latter figures are often subject to spurious volatility and should therefore not be relied upon too heavily, but some pick-up in wages growth would appear consistent with the continued tightening in labour market conditions seen over the past year and more recent signs of somewhat higher settlements being reached in enterprise agreements. Recent business surveys also suggest modest upward pressure on wages growth at present.
While the September quarter CPI result was a little weaker than expected, the combined effects of several years of strong growth, a tightening labour market, high oil prices and a low exchange rate could still be expected to generate further upward pressure on inflation over the next year or two. There does, however, appear to have been some change in the mix of these forces over recent months. On balance, the risks to inflation arising from domestic demand pressures may have eased slightly, while the further depreciation of the Australian dollar has added to inflationary pressures.
A forecast made on the standard technical assumption that the exchange rate stays at or near recent levels, would have inflation in underlying terms, net of tax effects, gradually increasing further, to be around 3 per cent by the end of 2001, and likely to remain at that rate for some time thereafter. Until the June quarter 2001, CPI inflation measured on a four-quarter-ended basis can be expected to remain high – probably over 5 per cent – because of the effects of tax reform. Subsequently, with these effects dropping out, and assuming a reduction in international oil prices (and hence domestic fuel costs), CPI inflation would be somewhat lower than underlying inflation after June 2001, although tending to drift back up towards it as those temporary factors waned. These projections assume that there is no response of wages or price expectations to the temporarily higher headline rates of inflation now being observed.
The forecast is subject to a number of sources of uncertainty. On the upside, the assumption that wage and price expectations will be unaffected by the current high rates of CPI inflation may still prove to be unfounded, although that risk appears to have diminished recently. This source of upside risk to the forecast would, however, be amplified if oil prices were to remain high or if they were to increase further, instead of gradually declining as assumed. The forecast is also sensitive to the assumption about the exchange rate, and any further currency depreciation would similarly add to upside risks to inflation. On the other hand, with the currency already at historically low levels, there is clearly potential for it to appreciate in the forecast period. Were that to occur, it would imply a more benign inflation outlook than would be generated from an exchange rate close to its current level.
Box C: Alternative Measures of Labour Costs
The growth of labour costs is an important factor in assessing trends and prospects for inflation. In Australia there are several different measures that attempt to summarise economy-wide developments in wages or labour costs.[1] Of these, four are commonly cited:
- average weekly earnings (AWE) per non-farm wage and salary earner;
- average weekly ordinary-time earnings (AWOTE), which is derived from the AWE survey but includes only the ordinary-time earnings of adults working full-time;
- average compensation per wage and salary earner, published in the national accounts; and
- the wage cost index (WCI).
The behaviour of these four measures during the past decade is shown in Graph C1.
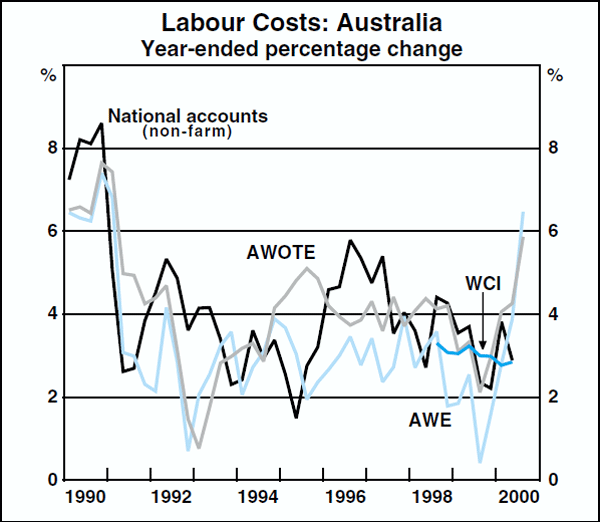
Why do the measures differ?
The first three indicators listed above are measures of the labour cost or wage bill per employee. At times, there can be significant divergences among them, arising partly from differences in coverage and sources; for example, the national accounts measure can differ from the other two because it is derived from a different survey, and because it includes non-wage costs.
All of the wage-bill measures are subject to variability induced by compositional change, arising because fluctuations in the relative representation of low- and high-wage employees in a survey will affect the recorded level of average wages. In the case of the AWE measure, a particularly important issue is the impact of changes in the relative shares of full-time and part-time workers – an increase in the proportion of part-time workers will reduce AWE because part-time workers earn less per week than the average. In addition to generating short-run volatility, this effect is likely to result in a longer-run understatement of wages growth by the AWE measure, due to a trend increase in the share of part-time workers in total employment. The ordinary-time earnings measure, which is based only on full-time workers, is not affected by this form of compositional change, and in this respect is conceptually closer to an hourly wage measure. Its growth is likely, however, to have been boosted on average by a tendency for ordinary-time working hours to increase, and it remains subject to the more general problems of volatility affecting all wage-bill measures.
The WCI differs from the other three indicators in that it is a measure of wage rates rather than the wage bill. It attempts to measure changes in the cost of purchasing a fixed quantity and quality of labour input. The characteristics of each selected job in the WCI are specified in detail and jobs with the same description are matched over time, allowing the index to be constructed from the change in hourly wage rate for each job. As a result of these features, the WCI might be expected to generate a lower average growth rate in the long run than would be recorded by an hourly wage-bill measure. This difference would arise if there was a tendency over time for lower-skill jobs to be replaced by higher-skill jobs, which typically attract higher earnings.
Without a longer run of historical data, it is difficult to say how large such a difference might be. The experience of New Zealand suggests that the average difference between wage-bill and wage-rate indicators could be quite significant. Statistics New Zealand publishes a labour cost index (LCI), which is similar in concept to the WCI, and an average hourly earnings (or wage bill) measure. The difference between the two series has averaged close to 1 percentage point per annum since the early 1990s (Graph C2). On the other hand, in the United States, which also publishes an employment cost index (ECI) similar to Australia's WCI, there appears to be little systematic difference between that measure of wages growth and an hourly earnings measure.
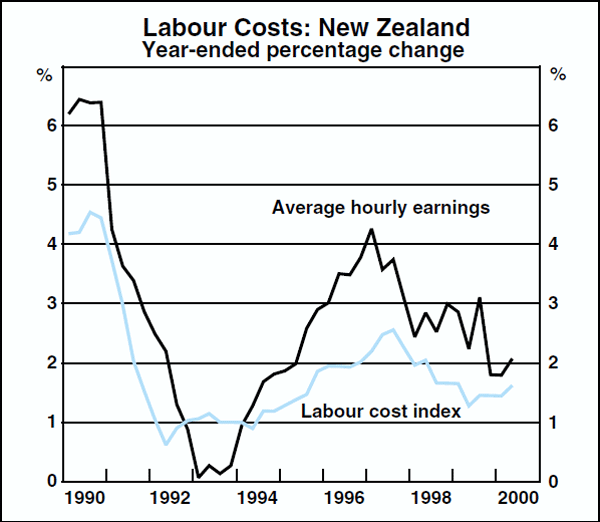
Which is the best indicator for assessing trends in inflation?
In order to assess developments in inflation, wages need to be compared with productivity to derive a measure of unit labour costs. In practice, none of the indicators discussed above is likely to be ideal for this purpose. Wage-bill measures, such as those derived from the AWE survey or national accounts data, are conceptually the most appropriate, since unit labour costs can be thought of as representing the overall wage bill per unit of output. However, these measures, as noted above, can be subject to significant short-run volatility driven by fluctuations in the composition of employment between surveys. This can make short-run developments in the series difficult to interpret.
The WCI, being a wage-rate measure for a fixed basket of jobs, is not fully compatible with economy-wide productivity measures for the purposes of deriving unit labour costs. For the reasons discussed above, the WCI appears likely to grow less rapidly on average than measures derived from the wage bill, and hence a unit labour cost series constructed by combining the WCI with economy-wide productivity would tend to understate the inflation trend. The extent of this effect is difficult to assess, given the short history of the series. At the same time, since the WCI is less affected by short-run compositional change, it can be expected to be less volatile than wage-bill measures in the short run. This implies that the WCI may give more reliable signals of changes in the trend in wage rates, although, given its relatively short history, its behaviour has not yet been tested over an economic cycle.
Footnote Box C
Some of these issues were discussed in more detail in ‘Measuring Wages’, Reserve Bank of Australia Bulletin, December 1996. [c1]