Reserve Bank Bulletin – May 1998 Semi-Annual Statement on Monetary Policy
Download the complete Statement 343KB
Introduction
The Australian economy recorded a favourable combination of good growth and low inflation in 1997. Real non-farm GDP expanded by 3¾ per cent, led by strong private-sector domestic demand. Underlying consumer price inflation was 1½ per cent, influenced by declining prices for imports but also containment of domestic costs. This performance compares well with international experience.
In 1998, on present indications, growth is likely to be somewhat lower, and inflation higher, than the 1997 outcomes. The principal reason for this is that the international environment facing the Australian economy has become increasingly difficult over the past year or so. The financial crisis in east Asia is, not unexpectedly, requiring very sharp contractions in the countries directly concerned, and indirectly is dampening growth around the region generally. This has reduced Asian demand for goods and services produced in the rest of the world, including Australia, and it is clear that Australian exporters are suffering a significant fall in sales to east Asia at present.
Economic conditions in the United States remain very strong, and they are improving in Europe. The direct impact of the east Asian problems on these important regions is probably not large, although the US economy is likely to slow in 1998 in response to several factors. Perhaps the biggest uncertainty in the global growth outlook at present is in respect of Japan, where the economic situation has deteriorated further over recent months. This has not had much effect on Australian exports to Japan, but is adding to the impact of the east Asian problems on global growth, and could dampen prospects for recovery in the east Asian economies. Overall, it seems unlikely that there will be an early improvement in the international trading environment.
Financial markets in Australia, although not directly caught up in the financial turmoil that engulfed the region, have nonetheless been affected by the actual and expected economic consequences of the crisis – notably weakening export demand and falling commodity prices. This has led to a fall in the exchange rate of the Australian dollar and lower bond yields; the share market, while rising, has underperformed markets in most other industrial countries. These adjustments in financial prices have taken place over a period of nearly a year and, apart from a brief period in January, have occurred in an orderly manner.
There is nothing that Australian economic policy can do to prevent this worsening of external conditions. The task for policies is to support the economy's capacity to adjust to changed circumstances. In this regard, at the macroeconomic level at least, past policy investments are paying off. Public finances are in good shape, inflation is low, and balance sheets of businesses and financial institutions are strong. It is inevitable that the current account deficit will widen in 1998 – that process is already well under way. A short-term widening of this nature does not reflect inadequacies in current economic policies and, in itself, is not an issue of direct concern for monetary policy.
At this stage, the Bank's assessment remains that domestic demand has sufficient momentum, despite some weaker statistics just recently, to drive moderate growth in output in 1998. That process is being given considerable assistance by the current stance of monetary policy. Credit is readily available on attractive terms, and financial intermediation is proceeding at a strong pace. Few borrowers are under any cash-flow constraint as a result of interest payments. Those areas of private spending usually thought to be interest sensitive, such as housing, business investment and certain consumer durables (such as motor vehicles) have been strong. Asset markets have been reasonably buoyant, although generally not overheated, and the increase in private financial wealth over the past year was the strongest for a number of years. The exchange rate has declined relative to most other currencies (which will give some assistance to exporters seeking to find new markets, just as it is cushioning the prices of commodities measured in Australian dollars). These are all signs that the declines in interest rates over the past couple of years have been having their expected effect.
The lower exchange rate also means that the period of declining underlying consumer price inflation which began in 1996 has now reached an end. Falls in prices for traded goods and services which occurred during 1997 are in the process of being at least partly reversed. At the same time, the trend in domestic costs has shown signs of gradual deceleration over the past couple of years. Overall, the Bank's central forecast is that there will be a modest increase in the annual underlying inflation rate, to around 2 per cent by the end of 1998, and around 2½ per cent by the middle of 1999 – a result in line with the inflation target.
Under these circumstances, the Bank is comfortable for the present in maintaining the current structure of short-term interest rates. The stance of policy will, naturally, be continually reviewed as new information comes to hand about the likely course of inflation and activity, including the impact of the Asian crisis on growth and the strength of domestic demand.
International Economic and Financial Developments
East Asia
The turmoil in Asian financial markets reached its peak in January. Indonesia was the country most affected, its exchange rate at one point depreciating by about 80 per cent from mid-1997 levels, but the exchange rates of Korea, Thailand and Malaysia also had fallen sharply to levels about 50 per cent below pre-crisis levels (Graph 1). Singapore and Taiwan, and to a degree, the Philippines, managed to negotiate this period with smaller depreciations. In fact, the falls in the Singaporean and Taiwanese currencies against the US dollar were of similar magnitude to that of the Australian dollar. Hong Kong and China have been able to maintain unchanged exchange rates against the US dollar throughout the entire crisis.
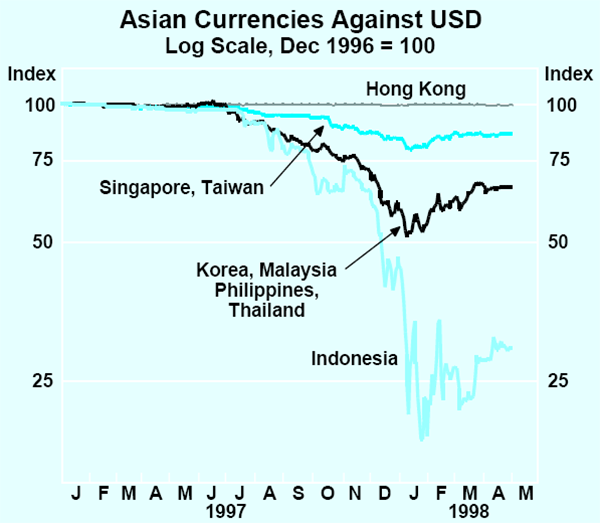
Since January, the situation in financial markets has improved. Confidence began to return as Thailand and Korea proceeded with the implementation of measures agreed as part of their IMF packages. (Details of the size of the various packages are outlined in Box A.) Both countries have begun the process of liquidating insolvent financial institutions and the restructuring of viable ones. Moves have also been made to reschedule foreign debt and, in Korea, to reform the labour market. Korea was able to roll over the bulk of the short-term debt incurred by its banks, first on a temporary basis, and then into bonds of up to three years maturity. Useable foreign reserves have been substantially rebuilt in both countries. As a result of these confidence-building developments, the currencies of Korea, Thailand, Malaysia and the Philippines have recovered ground, although they still remain around 30 per cent lower than pre-crisis levels; the exchange rates of Singapore and Taiwan are now down by only 10–15 per cent against the US dollar compared with mid-1997 levels. The pace of improvement in confidence has, however, slowed in recent weeks due to concerns about the regional implications of the weakness in Japan (see below).
For a time, Indonesia was an exception to this general trend. While the announcement of the original IMF package was well received initially, this gave way early in 1998 to a lengthy period of uncertainty over how closely the Indonesian authorities would adhere to the agreement. During this period, the Indonesian rupiah slid to extremely low levels, and Indonesian banks and corporates were unable to carry on their normal dealings in international markets. The currency was briefly supported by speculation about the introduction of a currency board involving a peg of the rupiah to the US dollar at a much higher level, but this was later ruled out as unsustainable.
In early April, the IMF and the Indonesian authorities negotiated a new agreement, reflecting the changed circumstances of the Indonesian economy. The new agreement includes, amongst other things, a process for managing the large foreign-currency debt owed by Indonesian banks and companies. The package should allow the resumption of financial assistance to Indonesia, conditional on the Indonesian authorities' implementation of agreed measures. This has seen some firming in the value of the rupiah and, as of early May, it had risen to about 8000 to the US dollar, still down by about 70 per cent from pre-crisis levels. This size of depreciation will make economic management in Indonesia very difficult, as indicated by the sharp increase in inflation to about 40 per cent in recent months.
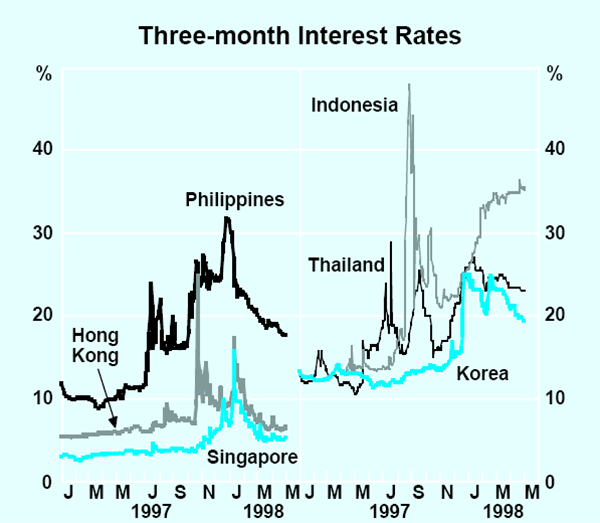
With exchange pressures generally easing in the region, it has been possible for all countries, apart from Indonesia, to start to reverse the sharp increases in interest rates that occurred in late 1997/early 1998 (Graph 2). In most cases, however, interest rates still remain at high levels; only Hong Kong and Singapore have been able to reverse most of the earlier rise.
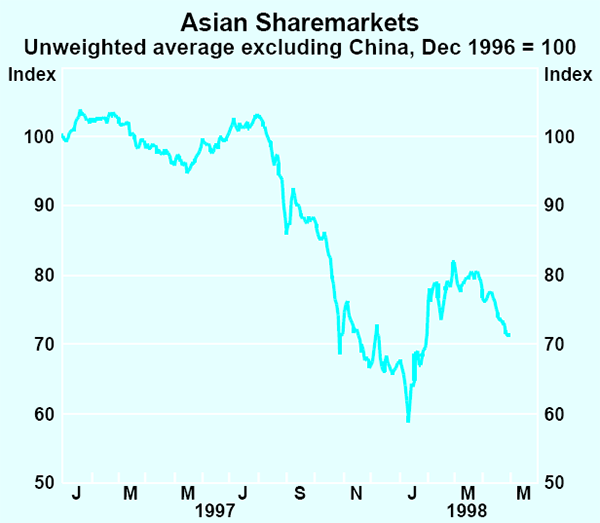
Share markets in the region have also recovered. At their lows around the turn of the year, share prices were down by about 40 per cent on average from early 1997 levels (Graph 3). Through January and February, about half of this fall was reversed. More recently, markets have weakened again; flow-on effects of the weakness in Japan have contributed to this but, more generally, share markets are likely to remain nervous until clear signs emerge of economic recovery in these economies. In summary, the situation in south-east Asian financial markets is improving, but confidence remains fragile.
Box A: Financing Activities of the International Monetary Fund
One of the key functions of the IMF is to provide financial assistance to member countries experiencing balance of payments difficulties. This role has been prominent over the past year as a result of the large-scale assistance provided to Thailand, Indonesia and Korea. The attention given to these support packages has tended to obscure the fact that financing of this sort is an ongoing function of the IMF – many facilities, both large and small, are offered during the course of an average year. A broad overview of these activities is provided below in order to place the recent Asian facilities in perspective.
IMF financing facilities
Reflecting the varied nature of circumstances and problems facing its 182 member countries, the IMF has a number of different facilities available for dealing with balance of payments needs. Each differs in terms of the size of the facility, the period over which it can be drawn upon, and the repayment period once drawn. The main facilities are: Stand-by Arrangements, Extended Fund Facilities, and the newly created Supplemental Reserve Facility.
Stand-by Arrangements and Extended Fund Facilities are used for overcoming balance of payments difficulties stemming from short and longer term problems, respectively. The Supplemental Reserve Facility was introduced late last year and is aimed at addressing situations where a country is facing large short-term capital outflows, in particular where such outflows have the potential to trigger contagion. It provides short-term funding in excess of that available under other facilities, but at a higher rate of interest.
In addition to the Fund's regular facilities, there are a number of special facilities available for countries facing particular circumstances, such as temporary shortfalls in export earnings, and concessional facilities for low-income member countries facing protracted balance of payments problems.
The composition of IMF financial assistance
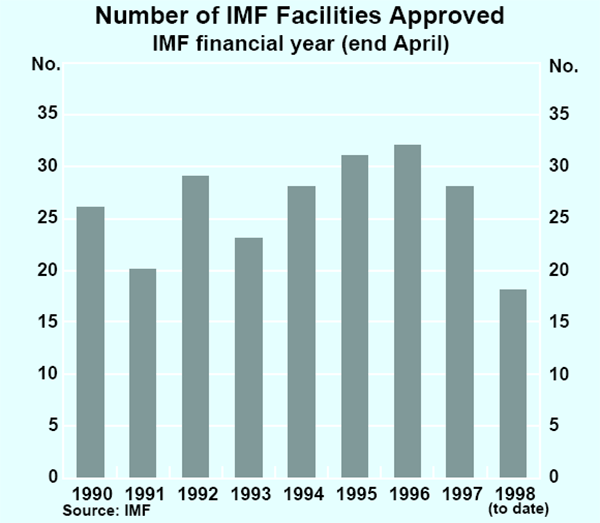
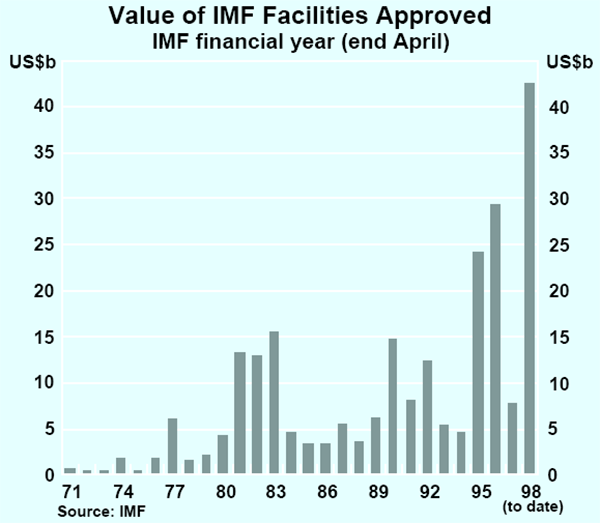
Graph A1 shows the number of financing facilities approved by the Fund each year. They have generally fluctuated between 20 and 30 per annum in this decade. In the past year, the number of new facilities has been smaller than this, but the size of those facilities has been large by historical standards, with the result that the overall value of new IMF commitments has been the largest ever, at around US$40 billion (Graph A2). Approvals in 1995 and 1996 were also quite high, largely because of the very large size of the facilities provided to Mexico and Russia.
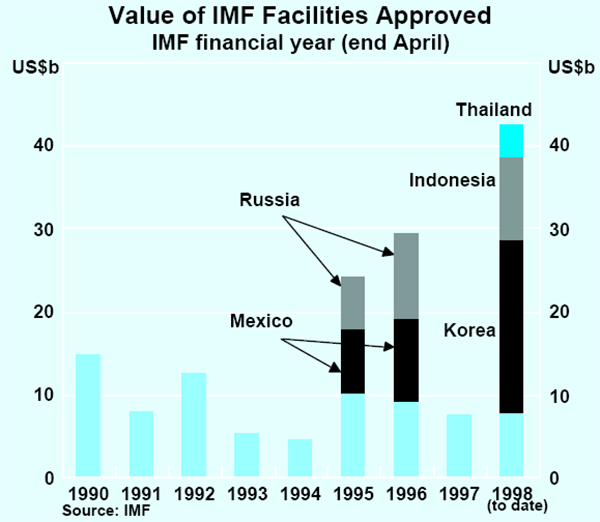
It should be noted that the IMF has not been the only contributor to the support packages for these countries; other international bodies and individual countries contributed around US$30 billion to the 1995 Mexican package and have signed up for US$13 billion to the Thai package, US$37 billion for the Korean package and US$25 billion for the Indonesian package. Not all this has been drawn, and some of the bilateral funds promised may never be drawn. Details of the various packages are shown in Table A1.
| Borrower | Donor | Amount (US$ Bn) |
|---|---|---|
| Mexico (Feb 95) |
IMF | 17.8(a) |
| United States | 20 | |
| BIS/G10+Spain | 10 | |
| Canada | 1 | |
| Argentina | 1 | |
| Brazil | ||
| Colombia | ||
| Total | 49.8 | |
| Thailand (Aug 97) |
IMF | 3.9 |
| World Bank | 1.5 | |
| ADB | 1.2 | |
| Japan | 4 | |
| Australia | 1 | |
| China | 1 | |
| Hong Kong | 1 | |
| Malaysia | 1 | |
| Singapore | 1 | |
| Brunei Darussalam | 0.5 | |
| Indonesia | 0.5 | |
| Korea | 0.5 | |
| Total | 17.1 | |
| Indonesia (Nov 97) |
IMF | 10.1 |
| World Bank | 4.5 | |
| ADB | 3.5 | |
| Japan | 5 | |
| Singapore | 5 | |
| United States | 3 | |
| Australia | 1 | |
| China | 1 | |
| Hong Kong | 1 | |
| Malaysia | 1 | |
| Total | 35.1 | |
| Korea (Dec 97) |
IMF | 21 |
| World Bank | 10 | |
| ADB | 4 | |
| Japan | 10 | |
| United States | 5 | |
| France | 1.25 | |
| Germany | 1.25 | |
| Italy | 1.25 | |
| United Kingdom | 1.25 | |
| Australia | 1 | |
| Canada | 1 | |
| Belgium | 1.25 | |
| Netherlands | ||
| Sweden | ||
| Switzerland | ||
| New Zealand | 0.1 | |
| Total | 58.4 | |
| (a) US$7.8 billion was committed in the IMF's 1995 financial year and a further US$10 billion in the 1996 financial year. | ||
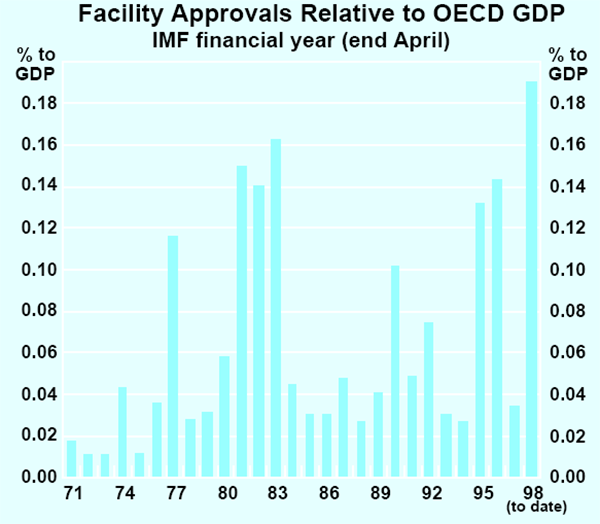
Graphs A3 and A4 place the events of the past couple of years in a longer historical context. While the past few years clearly stand out, so do the early 1980s. In fact, if scaled against developed world GDP, assistance provided directly by the IMF in the early 1980s was similar to the recent period. The latter part of the surge in Fund commitments in the early 1980s reflects the Latin American debt crisis, while the earlier years reflect facilities for a wide range of countries, particularly India, Yugoslavia, Turkey and Pakistan.
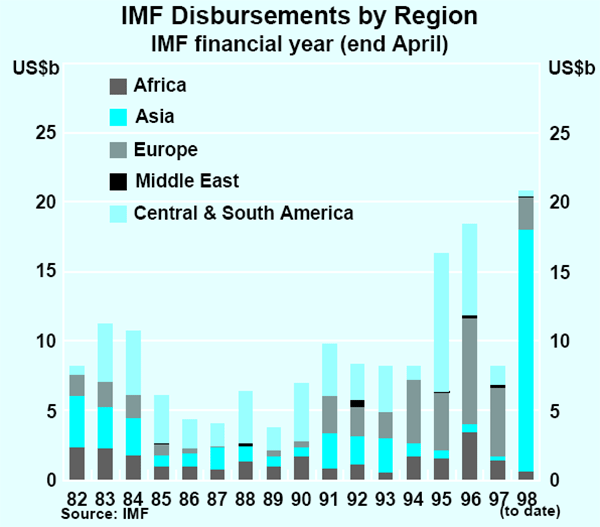
A point of interest is that the Asian crisis has resulted in an historic shift in the geographical focus of IMF assistance. As Graph A5 shows, 1997 marks the first year in which Asia has drawn substantially on Fund resources. Traditionally, the Americas and Europe have been the main users of Fund resources, with Europe's share increasing steadily over the course of the 1990s following the collapse of communism in Eastern Europe. Asia made a modest call on funds in the early 1990s, largely through India, Pakistan and the Philippines.
The economic fall-out from the currency and financial crises is, of course, far from over. In the countries most affected by the crisis, current account positions have moved into surplus. This is common in cases where there is a more or less complete loss of investor confidence: current account deficits which were formerly the counterparts of substantial inflows of private capital have to close abruptly, as capital flows out. Since last June, the total current account adjustment of Thailand, Korea and Indonesia combined has been of the order of US$40 billion (at an annual rate).
So far, the vast bulk of the balance of payments adjustment has been via lower imports (Graph 4). Measured in US dollar terms, imports have fallen by about one-third from their pre-crisis levels. To date, exports have shown little tendency to increase more quickly in US dollar terms, although this probably disguises some volume increase as exporters lowered their US dollar prices. In some other Asian countries, exports appear to have slowed, which would be at least partly explained by the decline in trade with other countries under strain.
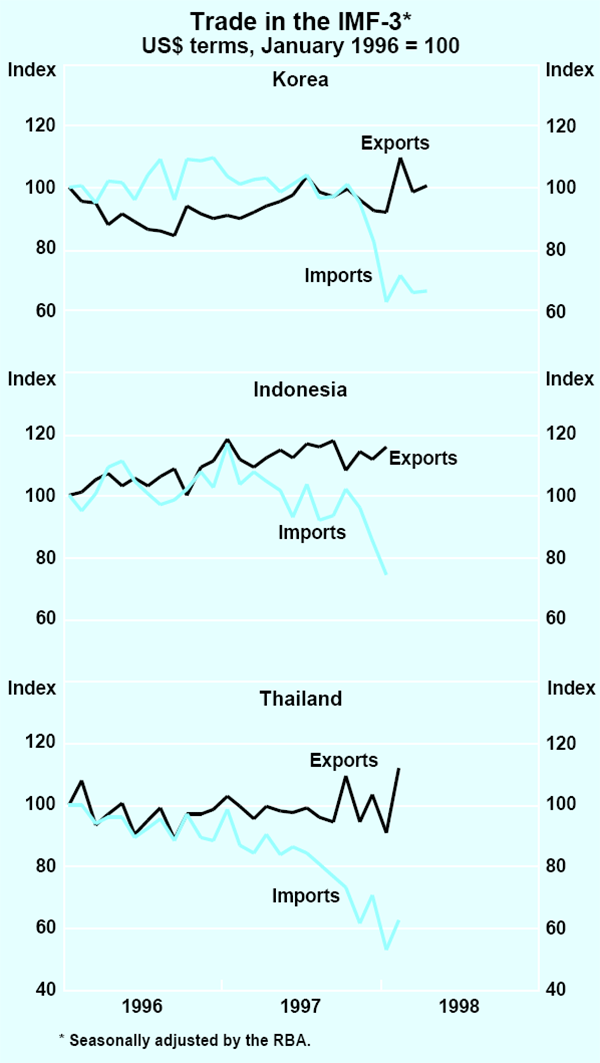
The fall in imports has been produced partly by the depreciation of currencies, which has made imports much more expensive (and which is also pushing up inflation rates), but more importantly reflects sharp contractions in domestic demand. The latter in turn have been a result of much higher interest rates, tighter budgetary policies and the adjustments flowing from deflating asset prices and the unwinding of over-stretched financial positions. As a result, domestic production is declining, and business bankruptcies and unemployment are increasing.
The stress on banks in several countries has also resulted in a severe reduction in the availability of trade credit. This form of credit is crucial to the flow of traded goods. It relies on banks being prepared to assume risk in the form of a letter of credit drawn on another bank in a foreign country. The difficulties being faced by banks in some of the troubled Asian countries have tended to make banks in countries which trade with the Asian region wary of trade-financing activities. Since many Asian exports rely on imported components of one kind or another, this can amount to a constraint on the ability to export. Governments in some other countries, including Australia, have been prepared to alleviate this problem by increasing the availability of insurance for export sales into Asia. The reliance of Asian producers on imported components and raw materials also lessens somewhat the degree of gain in competitiveness conferred on them by the depreciation of their currencies.
The impact of the decline in intra-regional trade in Asia, as well as of the general tightening of financial conditions in most countries in the region, is now beginning to have an impact on some countries not directly in crisis. Domestic demand in Hong Kong and Singapore, for example, appears to be slowing. Growth in China, for many years very strong, also appears to be gradually slowing down, although this is mainly due to domestic factors. An exception to this general trend is Taiwan, which seems to be weathering the storm better than most.
Because of these developments, most expectations are that the east Asian region as a whole will record much more subdued growth in 1998 than has been the norm in the past. Pronounced recessions are already under way in Thailand, Indonesia and Korea; other countries will continue to record growth, but in most cases it will be the weakest performance in over a decade.
If the recent stabilisation in financial markets signifies some easing in the financial constraints facing the countries in crisis, then production and demand might be expected to reach a trough at some time in the next year. If financial markets can be kept on a stable footing, and the progressive implementation of the various reform programs continued, then the preconditions for a gradual recovery in economic activity beginning in 1999 may come into place. In several important instances in east Asia, this appears to be the current trend, but it is too early yet to say that a general recovery is beginning. Even when it does commence, the likelihood is that growth rates will be considerably lower than seen between 1990 and 1996.
Economic developments in the major economies
The United States economy recorded an exceptionally good combination of strong growth and low inflation during 1997. Strong gains in employment reduced the rate of unemployment to below 5 per cent for the first time in a generation. This tightening of labour markets has led to some pick-up in the rate of growth of labour costs, but consumer price inflation declined during 1997, a result of a higher US dollar, gains in productivity and lower energy prices.
Most observers expect that US growth will have slowed by the end of 1998, and that this will prevent a pick-up in inflation. Early indications are that domestic demand has remained reasonably robust so far this year, but the US traded-goods sector is being affected by the reduction in demand in east Asia and, more importantly, the rise in the value of the US dollar.
The major European economies continue to present a mixed picture. The UK is apparently at or near a growth peak. France and Italy are both recording a pick-up in growth, led by domestic demand. Activity is also strengthening in Germany. Until recently, this has been heavily dependent on export expansion, with significant restructuring in the German corporate sector dampening employment and consumer confidence, and hence domestic demand. There are now signs that conditions in the labour market are improving, although this is yet to translate into a sustained pick-up in consumer spending.
This strengthening of domestic demand in Europe is being supported by easy financial conditions, with both short- and long-term interest rates at quite low levels. Any dampening effects on activity of fiscal consolidation required to meet the Maastricht criteria also are likely to be waning over the year ahead. It therefore seems likely that growth in Europe in 1998, led by domestic expansion, will match the quite good rates achieved in 1997, despite the impact of lost sales to the Asian region.
In fact, the direct exposure of both the US and European economies to east Asian countries other than Japan is relatively small (Table 1). Lost export sales to these countries are likely to be of far less importance to the European economies and the US than they will be to Australia. For this reason, it seems unlikely that the financial crisis in east Asia will precipitate a major global slowing in growth – although there will be some effect. A major slump is also less likely if policy-makers in major economies take the effect of Asia into account in their deliberations, which they appear to be doing.
| United States | Japan | 4 major Europeans |
Australia | New Zealand | |
|---|---|---|---|---|---|
| Export destinations: | |||||
| G7 | 3.6 | 3.4 | 8.7(a) | 5.5 | 8.2 |
| of which: | |||||
| – Japan | 0.9 | – | 0.5 | 3.1 | 3.3 |
| Troubled Asia(b) | 0.7 | 1.7 | 0.6 | 3.0 | 2.4 |
| Other east Asia | 0.8 | 2.0 | 0.8 | 2.6 | 2.1 |
| Rest of world | 3.0 | 1.7 | 10.9 | 4.5 | 9.0 |
| Total | 8.2 | 8.9 | 20.9(a) | 15.6 | 21.8 |
|
(a) Excluding intra-European trade, exports to G7 and total merchandise
exports are 2.4 per cent and 14.7 per cent of GDP respectively. Source: IMF Direction of Trade and International Financial Statistics |
|||||
A bigger risk to the global outlook is the economic situation in Japan, where the economy relapsed into recession around the middle of 1997. Real GDP recovered some of the large June quarter decline in September, only to fall again in December. If anything, downward pressure on economic activity has intensified over recent months, with industrial production declining further in the early part of 1998. Consumer demand has been weakening, and inventories rising, suggesting that further weakness in output is likely in the short term.
Most significant business cycle events occur because of a combination of forces, and this is no exception. The process of fiscal consolidation last year began to have its effect just as the economies of some of Japan's important regional trading partners were about to retrench sharply. This was a coincidence which could not have been foreseen. The deeper structural weakness in the Japanese economy, however, has for some years been the weak state of the financial system resulting from the lingering effects of the collapse of the ‘bubble economy’ of the late 1980s and early 1990s. Over recent months, the dampening forces on the economy have been amplified as banks have restrained the expansion of credit in an effort to strengthen their own balance sheets. An indication of the weakness of these balance sheets is that loans outstanding to bankrupt companies were at their highest-ever level in 1997.
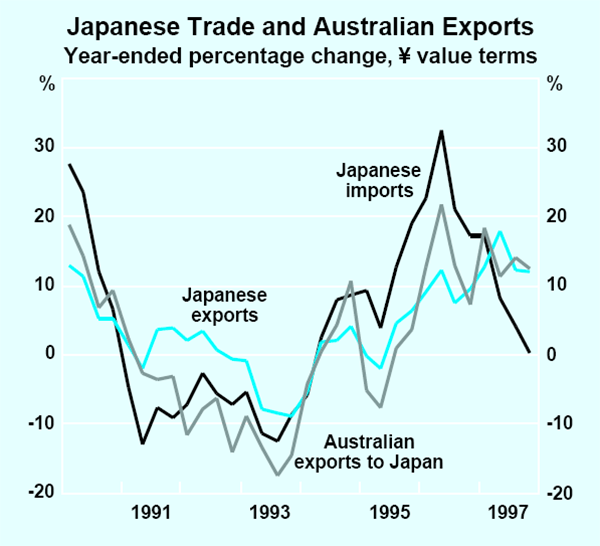
Japanese exports performed quite well through 1997, assisted by the more competitive exchange rate relative to other major countries. This helps to explain a quite strong performance of Australian exports to Japan during 1997, after a number of years of very little growth (Graph 5), although more recently these have weakened. Australia's exports to Japan are dominated by resources, which are an input into the Japanese export industries. Japan's exports to Asia, however, are being affected by the crisis in those countries. At the same time, the sluggish state of domestic demand in Japan weakens prospects for the east Asian countries to grow through export.
The main short-term requirement in Japan is macroeconomic measures which will re-start growth in domestic demand, boost confidence and stabilise the banking system. Some of these elements have been gradually coming into place over the past six months or so, with the most recent development the announcement of a sizeable fiscal stimulus package in late April. The package is costed at 17 trillion yen (3 per cent of GDP) and includes a temporary income tax cut and an increase in public-works spending.
The extent of the crisis in east Asia and the separate, although related, problems in Japan have seen a significant downward revision to global growth estimates published by the official international institutions such as the OECD and the IMF, as well as those of international private forecasters. In the IMF's recently released forecasts, a downward revision of 1¼ percentage points for world GDP growth (to 3.1 per cent) in 1998 is fully accounted for by the direct effect of lower growth in east Asia and Japan (Table 2).
| 1996 | 1997(e) | 1998(f) Oct 1997 | 1998(f) Apr 1998 | 1999(f) Apr 1998 | |
|---|---|---|---|---|---|
| Industrial countries | 2.5 | 2.9 | 2.6 | 2.4 | 2.4 |
| of which: | |||||
| – United States | 2.8 | 3.8 | 2.6 | 2.9 | 2.2 |
| – Japan | 3.9 | 0.9 | 2.1 | 0.0 | 1.3 |
| – European Union | 1.7 | 2.6 | 2.8 | 2.8 | 2.8 |
| Troubled Asia | 7.1 | 4.3 | 5.5 | −2.2 | 2.9 |
| Other east Asia | 9.2 | 8.5 | 8.6 | 6.7 | 7.2 |
| World | 4.1 | 4.1 | 4.3 | 3.1 | 3.7 |
International financial markets
In the US, financial markets have seen at least one positive aspect of the Asian crisis as well as the familiar negative ones. The positive aspect is that, by depressing commodity prices and encouraging further strength in the US dollar, events in Asia have allowed rapid growth in domestic demand in the US to continue for longer than might otherwise have been possible without adding to inflationary pressures. As a result, US financial markets have continued to perform very strongly. The US dollar has risen by 12 per cent in trade-weighted terms over the past 18 months, the share market has continued to set records and US bond yields have fallen to low levels. At 5.6 per cent, the yield on 10-year US bonds is barely above the US cash rate – i.e. financial markets are so confident about the continuing good outlook for inflation that lenders are willing to invest for 10 years at much the same interest rate as that on overnight money.
The low interest rate environment and good company profitability have supported the US share market. But, after a rise of close to 140 per cent over the past three years or so, share valuations have reached unprecedented levels, and can be sustained only by continuing good news on inflation and company profitability. With the economy pushing hard against capacity, this will prove increasingly difficult.
Share markets in many other industrial countries have strengthened along with that in the US and, in fact, the increases in share prices in Europe have run ahead of those in the US in recent times (Table 3). As in the US, low interest rates, due in some cases to the convergence of rates in the lead up to European monetary union, are an important part of the explanation. Signs of a more sure-footed economic recovery and the flow-through to profits of corporate cost-cutting in recent years have also contributed.
| Change since: | ||
|---|---|---|
| End 1994 | 1997 Peak | |
| United States | 140 | 11 |
| Canada | 84 | 7 |
| Japan | −21 | −25 |
| Germany | 152 | 20 |
| United Kingdom | 96 | 13 |
| France | 111 | 28 |
| Italy | 136 | 40 |
| Spain | 232 | 40 |
| New Zealand | 17 | −15 |
| Australia | 47 | 1 |
In Japanese financial markets, further weakness in the economy has produced the usual responses: bond yields have fallen to new lows of 1.5 per cent, the lowest long-term bond yield in any country for several centuries; the share market has fallen by about 25 per cent since mid 1997 to levels about 60 per cent below the early 1990s peak; and the exchange rate of the Japanese yen has fallen against other major currencies (15 per cent against the US dollar and 10 per cent against the German mark). Short-term interest rates remain at their historic lows of 0.5 per cent, where they have been for the past 2½ years.
Australian Financial Markets
The exchange rate
The fortunes of the Australian dollar over the past six months have mainly reflected developments in east Asia. The exchange rate has declined against the US dollar over this period, reaching its weakest point in January when the turmoil in Asia was at its height (Graph 6). The low point was US63.2 cents, a fall of US12 cents from the mid-1997 level, and the lowest exchange rate against the US dollar since the mid 1980s.
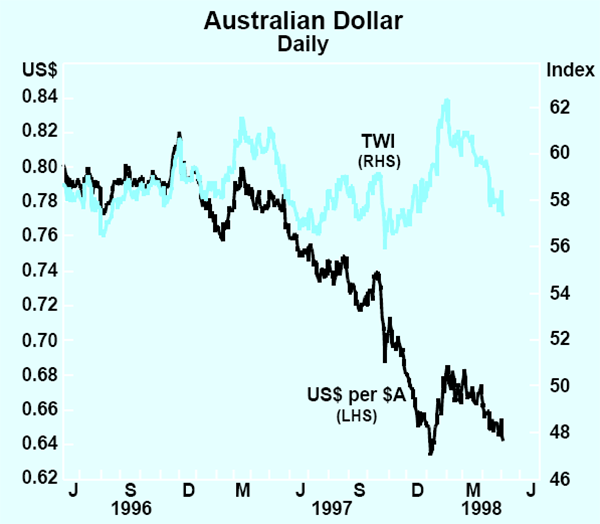
With the Asian situation subsequently improving, the Australian dollar recovered to some degree, at one point regaining US68 cents. However, as was the general experience of other currencies in the region, it has been affected recently by events in Japan and has returned to under US65 cents. This represents a net depreciation of 18 per cent against the US dollar over the past year.
The independent strength of the US dollar on world markets has been an important factor in this, but it is only part of the explanation. The Australian dollar has fallen against most currencies. Over the past year, for example, it has fallen against 19 of the 26 countries in the trade-weighted index. Such developments would normally be reflected in a fall in the trade-weighted index, but this has not happened on this occasion because of the exceptionally large increases against the currencies of the troubled Asian economies.
As was discussed in the article on ‘Alternative Measures of the Effects of Exchange Rate Movements on Competitiveness’ in the Bank's January Bulletin, the widely divergent path of the Australian dollar as between the major currencies and the currencies of east Asia means that the trade-weighted index has not been as useful a measure of overall exchange rate moves of the Australian dollar as in more settled times. The recent moves in the index are difficult to interpret because they combine a sharp appreciation against the currencies of countries to which Australia exports with a sharp depreciation against those of countries from which Australia imports. The Bank's judgment is that, on the whole, the movements in bilateral exchange rates have had a stimulative effect on economic activity and inflation in Australia.
In the unsettled conditions of late 1997 and January 1998, with exchange rate movements threatening to become self reinforcing, the Bank undertook some modest intervention in the market to restore orderly conditions. This was the first such intervention since November 1993. It involved total purchases of Australian dollars of $400 million; so far in 1998, a purchase of $100 million in early January has been the only intervention. Although the exchange rate has passed through a wide range since then, trading has remained orderly and the Bank has not seen a need to intervene.
Long-term interest rates
The bond market in Australia participated in the global bond rally (Graph 7). Since the previous Semi-Annual Statement on Monetary Policy, the yield on 10-year bonds has shown a net fall of 20 basis points, to around 5.75 per cent. This is the lowest level since the early 1970s, a time when interest rates were set by the Government and financial institutions were required to hold substantial amounts of bonds under the so-called ‘captive’ arrangements.
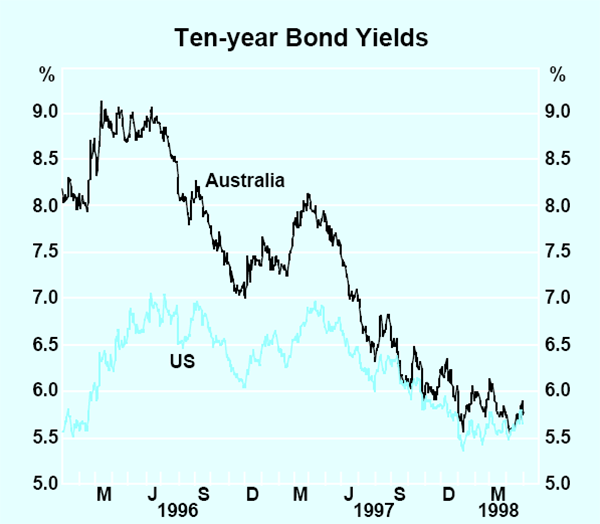
While bond yields in most countries have fallen sharply since the peak in late 1994, the fall has been larger in Australia than in most other countries. Accordingly, the spread between yields on Australian and overseas securities has fallen. The premium for Australian bonds over US security yields, which had been as high as 300 basis points as recently as three years ago, is currently less than 10 basis points and has averaged 25 basis points since mid 1997 (Graph 8). Continuing good news on inflation and the strong fiscal position have been the main factors driving this narrowing of the spread.
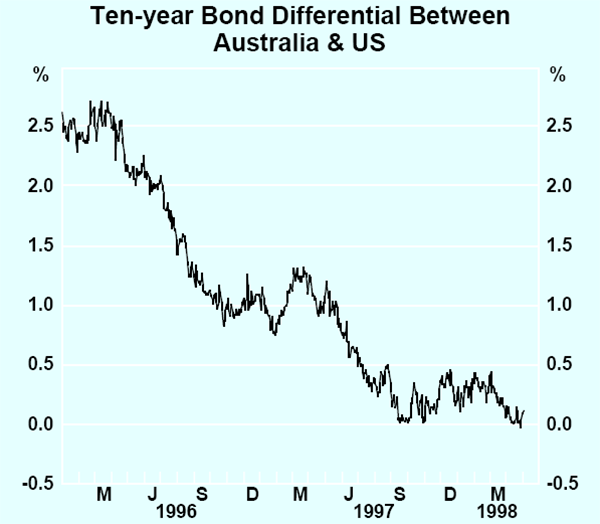
Spreads between bonds issued by different countries reflect both credit risk (i.e. differences in credit standing) and currency risk, i.e. the risk of changes in exchange rates, an important element of which, over the long term, is differences in rates of inflation. It is not possible to measure directly the extent to which each of these factors is contributing to the current spread between Australian and US bonds as the Australian government has no actively-traded borrowings in the US dollar market. However, other sovereigns with credit ratings similar to Australia who borrow in the US market are paying spreads of 20–30 basis points over US Treasury securities. This implies that the inflation risk built into the current Australian/US bond spread is, in fact, negative – i.e. markets are pricing Australian bonds on the basis that Australian inflation, which is currently below that in the US, will remain so.
Another indication of the good inflation outcomes priced into Australian bonds can be seen in the difference between nominal yields and the real yields on indexed bonds; this gap largely reflects inflationary expectations over the life of the bond, and is about 2 percentage points at present.
Short-term interest rates
Following the five easings of monetary policy between July 1996 and July 1997, the cash rate has been held unchanged at 5.0 per cent. Over this time, the market assessments of future changes to monetary policy have varied between expectations of a tightening and a loosening, mainly in response to short-run fluctuations in the economic data becoming available.
Market expectations about monetary policy can be observed in a variety of ways, but one relatively simple way is by comparing the market yield on three-month securities to the overnight cash rate. This is because arbitrage by market participants works to ensure that three-month interest rates reflect the expected average cash rate over that period. Expectations for an easing of policy – i.e. a reduction in the cash rate – will result in three-month yields falling below the current cash rate, while expectations of a tightening will result in the reverse.
As can be seen from Graph 9, in the months immediately following the easing in July 1997, markets continued to price in some expectations of further easings. Such trend-following behaviour is not uncommon in markets, both here in Australia and overseas; it was also evident in early 1995 after the tightenings of late 1994.
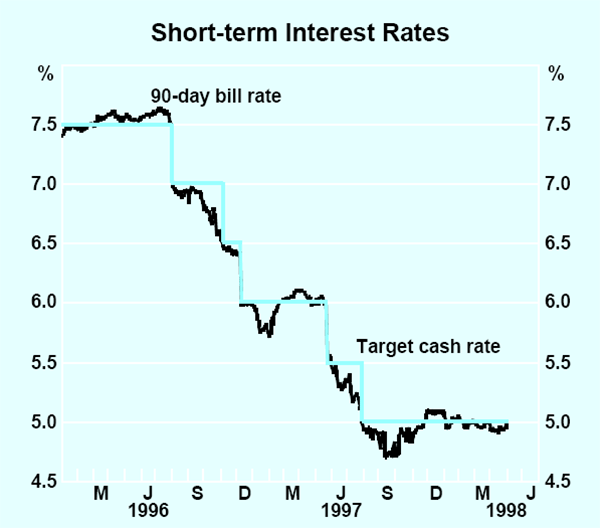
By December 1997, however, following the run of strong data on economic activity, markets had moved to price in a tightening of policy. Thereafter, as the Asian crisis worsened, and market observers began to predict a significant negative impact on the Australian economy, those expectations of a tightening were unwound. By March, they had been replaced by expectations of an easing, although these expectations are not as confidently held as back in the September quarter 1997. These swings in sentiment have been relatively mild and the frequency with which they have changed suggests that expectations are not confidently held.
Around the world, official interest rates have been relatively steady by past standards, but, to the extent that there has been any trend over the past year, it has been towards tightening (see Table 4, which shows the net change in official interest rates in industrial countries over the past year). Three countries – New Zealand, Canada and the United Kingdom – have implemented significant increases in interest rates. The former two have done so largely because of weakness in their exchange rates, the last because of the strength of its economy. Most European countries have also raised interest rates. Four industrial countries have reduced interest rates; apart from Australia, the other three were those European countries with above-average interest rates which reduced them as part of the convergence of rates in the lead up to European monetary union.
| Current rate | Change since 30 April 1997 |
|
|---|---|---|
| New Zealand | 8.40 | 205 |
| Canada | 4.75 | 175 |
| United Kingdom | 7.25 | 125 |
| Norway | 5.75 | 50 |
| Netherlands | 3.30 | 40 |
| Finland | 3.40 | 40 |
| Germany | 3.30 | 30 |
| Belgium | 3.30 | 30 |
| Denmark | 3.75 | 25 |
| Sweden | 4.35 | 25 |
| France | 3.30 | 20 |
| United States | 5.50 | 0 |
| Switzerland | 1.00 | 0 |
| Japan | 0.50 | 0 |
| Australia | 5.00 | −100 |
| Spain | 4.50 | −100 |
| Portugal | 4.70 | −160 |
| Italy | 5.00 | −175 |
Domestic Economic Activity
The Australian economy is now entering its seventh year of low-inflation expansion. The pace of growth picked up during 1997, with real non-farm GDP expanding by 3¾ per cent over the year. In the latter part of the year, this strength began to flow through to the labour market, generating stronger employment growth and a noticeable drop in the unemployment rate.
The general pick-up in momentum reflected stronger growth in most components of private demand, with strength particularly evident in consumer spending and housing construction. Overall, private demand grew by 6½ per cent over the year and total domestic demand by 5½ per cent (although, as noted in Box D (p. 28), this strength is slightly over stated by conventional constant-price estimates). Some of the growth in private demand was absorbed by a rundown in stocks and by faster growth in imports (Table 5).
| Six months to: | Year to Dec 1997 |
|||||
|---|---|---|---|---|---|---|
| June 1997 | Dec 1997 | |||||
| Expenditure (1989/90 prices): | ||||||
| Private final demand(a) | 6.2 | 7.0 | 6.6 | |||
| Consumption | 3.0 | 7.1 | 5.0 | |||
| – Goods | 2.7 | 8.1 | 5.4 | |||
| – Other(b) | 3.7 | 7.7 | 5.7 | |||
| Dwelling investment | 22.8 | 4.2 | 13.1 | |||
| Business fixed investment(a) | 14.2 | 8.2 | 11.1 | |||
| – Equipment(a) | 25.2 | 8.0 | 16.3 | |||
| – Non-dwelling construction(a) | −10.8 | 9.0 | −1.4 | |||
| Public final demand(a) | 2.6 | −1.6 | 0.5 | |||
| Increase in private non-farm stocks(c) | −0.5 | −0.2 | −0.3 | |||
| Net exports(c)(d) | −1.0 | −1.1 | −1.1 | |||
| Gross domestic product (1989/90 prices): | ||||||
| GDP(E) | 4.0 | 3.5 | 3.8 | |||
| GDP(A) | 4.0 | 3.2 | 3.6 | |||
| Non-farm GDP(A) | 3.9 | 3.7 | 3.8 | |||
|
(a) Excluding transfers between the public and private sectors. (b) Excluding dwelling rent. (c) Contributions to growth in GDP(E). (d) Excludes RBA gold transactions and frigate export. |
||||||
Early indications are that domestic demand has maintained momentum in the early part of 1998, but that the effects of the slowdown in Asia are becoming more apparent in the form of declines in export sales to a number of countries in the region. Although other markets have remained strong, the result has been a weaker aggregate export performance in the latter part of 1997 and early 1998. Weaker external conditions are thus providing some offset to the strength in domestic demand. The net effect will depend importantly on the extent of any indirect effects acting on business and consumer confidence. Overall, growth in 1998 is likely to be slower than that recorded in 1997.
Household income and expenditure
Strong growth in consumer spending has been an important contributor to overall growth in activity over the past year. Consumer spending increased by 5 per cent in real terms over the year to December 1997, and over the second half of the year the increase was just over 7 per cent at an annual rate. This followed a much weaker period in the second half of 1996. The pick-up has been widespread across most categories of consumer spending but was particularly noticeable for spending on retail goods, motor vehicles and entertainment and recreation.
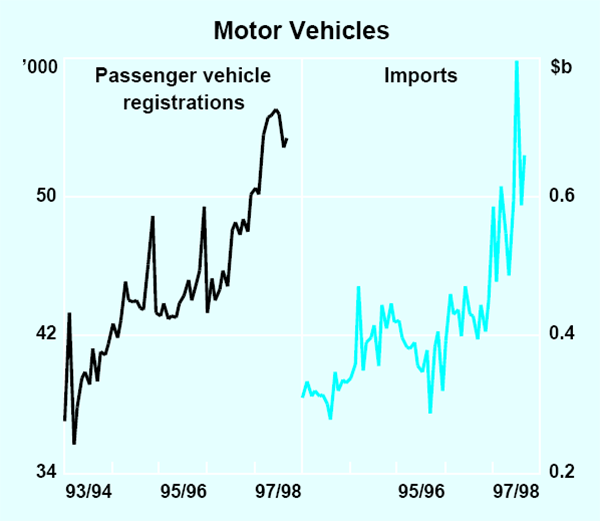
Taking 1997 as a whole, the most striking area of growth was in purchases of motor vehicles (Graph 10). Spending on this component increased by more than 25 per cent over the year to the December quarter, contributing a full percentage point to the growth in consumption over the period. One factor contributing to the increase in sales has been a period of intense price competition in the industry, which has seen motor vehicle prices decline by around 10 per cent over the past two years. As well as being influenced by short-term movements in the exchange rate and resultant effects on prices of imported vehicles, this trend seems to reflect a more fundamental condition of over-capacity in the world car industry which has helped to maintain a general downward pressure on prices. Another factor has been the low level of interest rates and ready availability of finance for car purchases. The value of loan approvals for the purchase of new motor vehicles increased by around 25 per cent over the year to the December quarter. Latest monthly figures on vehicle registrations suggest that there has been a pause in growth of vehicle purchases in the early months of 1998, which is not surprising given the extraordinary growth that occurred over the previous year. There have also been reports of local manufacturers having difficulty keeping up with demand.
Retail trade has maintained an upward trend in recent months but at a slower pace than was recorded in the second half of 1997 (Graph 11). In the March quarter, sales increased by 0.3 per cent in real terms, to be up by 2.8 per cent over the year, following an increase of 3.9 per cent over the year to December. Individual monthly figures continue to be quite volatile, particularly those relating to department stores, where ongoing changes in seasonal patterns make interpretation of the data difficult. It is likely that total consumption has continued to grow more strongly than its retail component, given the strong medium-term trend in spending on services such as entertainment and recreation which are not included in retail trade.
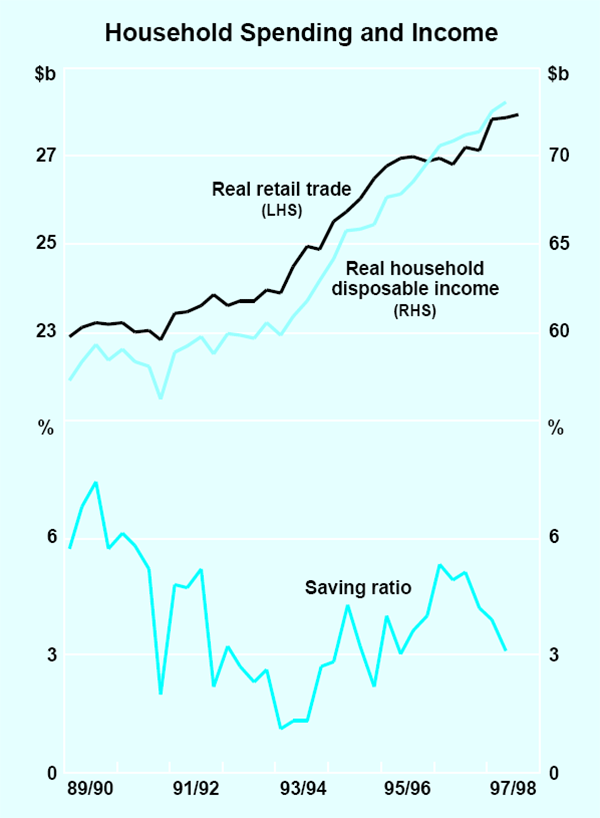
The strong growth in spending through 1997 was supported by solid rises in household incomes. Real household disposable income increased by 3 per cent over the year, and at an annual rate of 5 per cent in the second half of the year, boosted by stronger growth in employment. Financial conditions and buoyant levels of consumer confidence were also supportive of spending growth, which outpaced growth in incomes during the year, implying a declining saving ratio. Capital gains arising from the Telstra float may also have boosted household spending in the recent period (see Box B).
In the early part of 1998, consumers may be adopting a more cautious attitude in the face of greater uncertainties about the international outlook and about employment prospects. Some lessening of consumer confidence is suggested by recent results from the Westpac-Melbourne Institute consumer sentiment survey. The survey points to greater pessimism in recent months in relation to general economic conditions and employment prospects, although consumers have remained relatively up-beat about their personal financial situations, and overall consumer confidence remains above its long-term average. Consumer spending is likely to be boosted later in the year by the impact on household wealth of AMP demutualisation (Box B).
Demand for residential property has continued to increase over the past year, leading to solid growth in activity in the housing sector. In the December quarter, the number of private house commencements increased by 11 per cent, to be up by more than 20 per cent over the year as a whole (Graph 12). In dollar terms, the increase over the year was nearly 30 per cent. Local government building approvals have shown broadly similar growth to that in commencements, although with slightly different timing, and they suggest further growth in the early part of 1998. In the March quarter, the number of private dwellings approved for construction increased by about 1½ per cent, continuing the upward trend seen over the past year. Given lags in the completion of residential construction, these increases in approvals and commencements will flow through into further expansion in building activity during 1998.
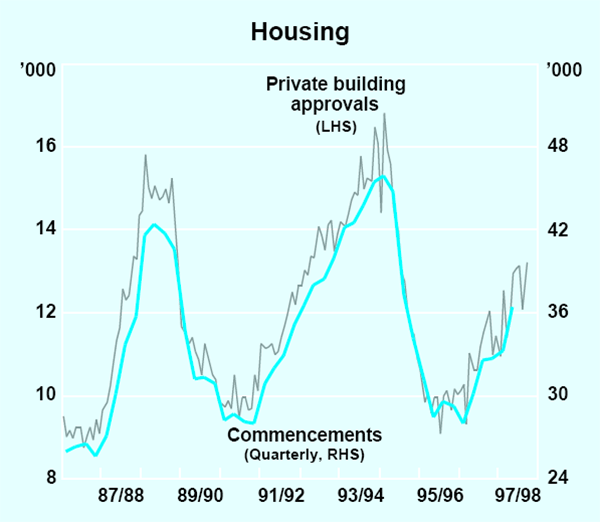
The difference in growth rates between number s and values of dwelling commencements points to one significant difference between the current and previous housing upswings. In the current cycle to date, the number of houses being built has increased less rapidly than in previous cycles, but this has to some extent been offset by faster growth in the average value per dwelling being built, reflecting improvements in average size and quality (Box C).
The strength in housing demand continues to be facilitated by a high level of finance commitments. In the three months to February, the value of loan approvals for housing was 18 per cent higher than a year earlier (Graph 13). Lending to investors in residential property has grown particularly strongly in the current upswing, with the value of new loan commitments almost doubling over the past two years. As has been the case during previous upswings, the expansion in finance commitments was initially led by loans for the purchase of existing dwellings but, more recently, lending for the finance of new construction activity has been accounting for more of the growth.
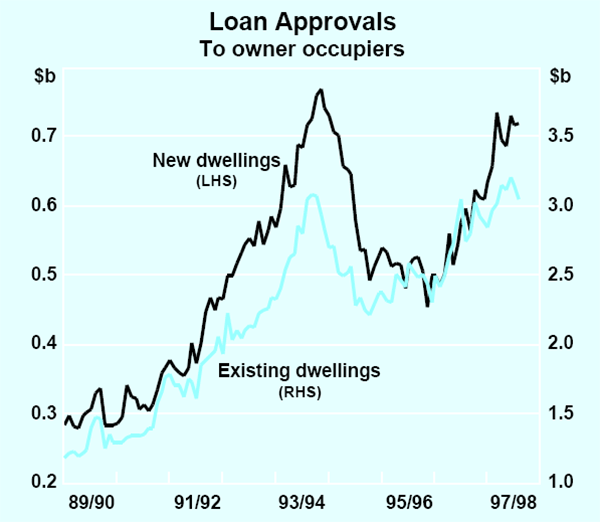
Latest indications are that the pace of lending growth may have been easing in recent months, although that would not be the first time that such a pause has occurred in the current upswing. Another weaker sign is that there has been a leveling out of activity in the medium-density component of housing construction. Nonetheless, demand for housing continues to be supported by historically high levels of affordability and by a rising aggregate level of household income. Interest rates on housing loans are at their lowest levels since the late 1960s, and measures of repayment burdens in relation to household incomes are also historically low. The strength of investor interest has been driven by attractive financing terms, an expanding rental market and low levels of vacancy rates in rental properties. Vacancy rates have begun to increase in Sydney, however, as a large volume of stock has come on to the market.
Box B: Telstra Float and AMP Demutualisation
The partial privatisation of Telstra in November 1997 and demutualisation of the AMP Society are the largest financial-sector events of their kind to have occurred in Australia (Table B1). Both are likely to have significant effects on the real economy. The Telstra privatisation probably had a small positive effect on consumer demand in the December 1997 and March 1998 quarters, while the AMP demutualisation may have a somewhat larger effect during 1998 and 1999.
| Privatisations over $2.5 billion | ||
|---|---|---|
| Asset | Proceeds ($ billion) | Year(s) of privatisation |
| Telstra | 14.3 | 97/98–98/99 |
| Commonwealth Bank of Australia | 8.2 | 91/92–97/98 |
| Loy Yang A | 4.7 | 96/97 |
| Power Net | 2.6 | 97/98 |
| Demutualisations | ||
| Institution | Value ($ billion)(a) | Year of demutualisation |
| AMP Society | 13½–17½(est.) | 97/98 |
| National Mutual | 3.1 | 95/96 |
| Colonial Mutual | 2.0 | 96/97 |
| (a) Market capitalisation one month after listing. | ||
One-third privatisation of Telstra
The sale of one-third of Telstra will yield around $14.3 billion to the Commonwealth. Households were allocated 60 per cent of Telstra shares on offer. The remaining shares were purchased, in about equal proportions, by domestic and foreign institutional investors. The persistent strength in the price of Telstra instalment-receipts[1] (IRs) since their listing on 17 November reflects strong demand from institutions seeking to hold share portfolios that mirror the composition of the All Ordinaries index, which now includes one-third of Telstra. It also reflects an international re-rating of telecommunications stocks associated with a flight to quality following the Asian financial crisis. The possibility that the utility will be fully privatised after the next federal election may also have underpinned demand for IRs.
Households may have reduced consumption initially to help fund the purchase of Telstra IRs, although many of the purchases were financed by borrowings. Households who purchased IRs, however, have experienced a substantial capital gain as IRs have traded at a premium of 100 per cent to the issue price. This is likely to have led to a more recent boost to consumption both from retail investors who have sold their IRs in recent months, and from investors spending some of the added wealth implicit in the higher price of their IRs. Part of the approximately $900 million oversubscription money returned to retail investors in early December may also have been spent, especially given the proximity of these receipts to Christmas.
AMP demutualisation
The demutualisation of the AMP Society earlier this year gives current policyholders a readily transferable share of the wealth that has accumulated in the AMP since its inception. Current estimates suggest that when the renamed AMP Ltd lists on the stock exchange on 15 June, its market capitalisation will be in the range $13½ – $17½ billion. Most policyholders are likely to have ignored, or heavily discounted, this component of their wealth before the demutualisation was mooted. In this sense, the demutualisation may be seen as a ‘windfall gain’ by current policyholders.
Australians are estimated to be entitled to around 75 per cent of the AMP Ltd shares, with most of the remainder going to citizens of New Zealand and the UK. Of the Australian shares, about 10 per cent will be allocated to superannuation trustees. Based on these estimates, individual Australian policyholders will be allocated about two-thirds of the AMP shares on offer. These individual policyholders are likely to increase their spending on consumption and dwelling investment, based on the experience in the United Kingdom following the conversion of building societies and the demutualisation of insurance companies in 1997.
The increase in spending is likely to come from two types of policyholders. The first type are those who sell AMP shares and spend some of the proceeds. (Some of these policyholders might be unable to increase current spending without selling AMP shares, because they lack a buffer of savings.) The UK experience suggests that the additional expenditure from policyholders who sell shares could amount to about $1.3 billion in the two years following the demutualisation, using the midpoint of current estimates of market capitalisation, with most of this expenditure occurring this year. The second type of policyholders are those who keep their AMP shares (at least for several months after the listing), but who nevertheless have sufficient savings to increase current expenditure. These policyholders might be expected to raise their expenditure in response to the ‘windfall gain’ implicit in the AMP demutualisation. Some of this extra expenditure (about $0.3 billion, based on the UK experience) may occur in anticipation of the receipt of AMP shares. A continued flow of additional expenditure should also be expected by these policyholders after the shares have been received, which might add an estimated $0.6 billion per annum to expenditure.
The survey evidence from the UK, on which these estimates are based, needs to be applied with caution to the Australian experience, because the payouts in the UK were derived from a range of financial market events, albeit dominated by demutualisations, and occurred in a period of robust consumer confidence and consumption growth. In addition, the age profile of members of building societies and policyholders of insurance companies in the UK may have been different from that of the individual policyholders of AMP Ltd; spending patterns in response to windfall gains may well differ by age group. Despite these caveats, the AMP demutualisation may be expected to boost aggregate demand in Australia in 1998 and into 1999 by the order of a few tenths of one per cent of annual GDP, with most of this effect in the current year.
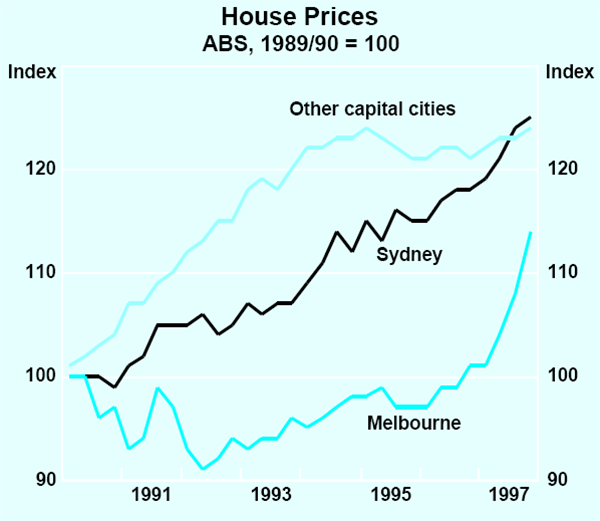
The high levels of demand and affordability have been putting upward pressure on house prices (Graph 14). The market has been particularly strong in Melbourne over the past year, where median house pr ices have increased by 12 per cent. In Sydney, which was the first of the capital cities to show a strong upturn, house prices have continued to rise, although the rate of increase has been easing recently. In both cities, house price increases were initially concentrated in inner city areas, and probably reflected a shift in preferences towards those areas rather than a generalised state of excess demand. Recently there has been a tendency for price pressures to spread more widely although the Sydney experience suggests that, as this has occurred, prices have tended to rise at a slower rate than was initially recorded in the inner city areas. In most other capitals, house prices have been picking up over the past year but the rate of increase has remained moderate.
Box C: The Housing Cycle
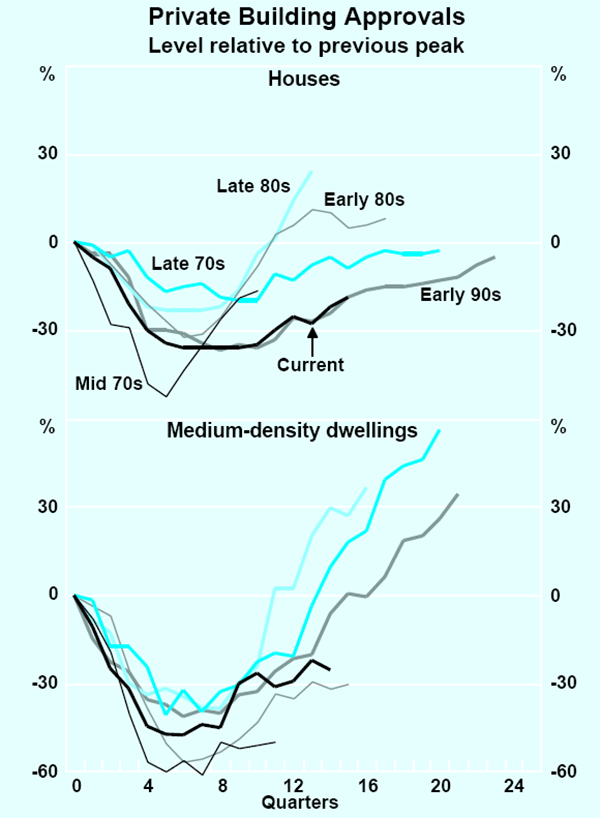
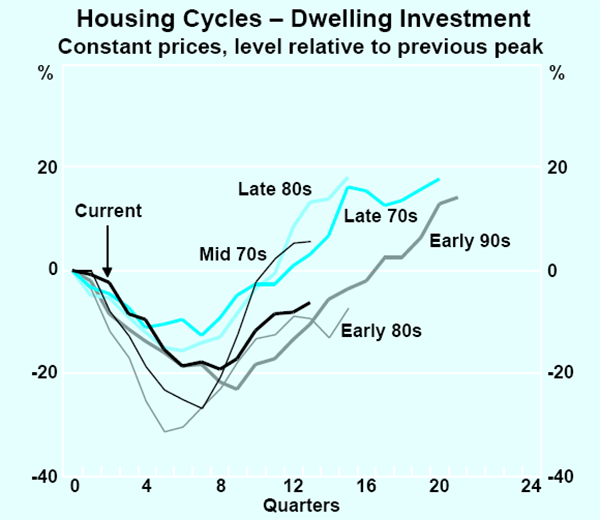
The current housing upswing has, on occasion, been characterised as relatively weak, because the increase in the number of dwellings constructed has been smaller than at a comparable stage of earlier cycles. This characterisation is misleading, however, because the current cycle has witnessed an unusually high level of activity in alterations and additions to existing dwellings and a rising average value of the dwellings being built. As a result, the amount of investment activity in the current cycle, as opposed to the number of dwellings being built, has been similar to that in earlier cycles. The current cycle also differs from earlier cycles in the type of dwellings being built and in geographical composition. A higher than usual proportion of medium-density dwellings (as opposed to free-standing houses) has been built and construction activity has been unusually concentrated in New South Wales and Victoria. In part, this geographical concentration of activity reflects shifting patterns of interstate migration.
The strength of dwelling investment relative to previous recoveries
Graph C1 illustrates the current and past recoveries in the number of private building approvals, divided into two components: houses and medium-density dwellings. The relative weakness in the total number of building approvals compared to previous cycles reflects a slower-than-average pick-up in the houses component. By contrast, the number of approvals for medium-density dwellings has been quite similar to earlier cycles.
The smaller total number of building approvals has not translated into weaker dwelling investment (Graph C2). One reason for this is that alterations and additions activity has been relatively robust in the early stages of the cycle. Three years after the latest peak in dwelling activity, investment in the construction of new dwellings was still 7 per cent below its previous peak, while the amount of alterations and additions activity had regained its previous peak. The second reason is that the average value of the dwellings being constructed has risen over the past 4 years by more than 15 per cent after allowing for changes in the price of building materials, reflecting an increase in the average size and quality of the dwellings being constructed.
Regional developments
The current pick-up has been heavily concentrated in New South Wales and Victoria. Together, these States have accounted for almost all the growth in the number of dwellings in the current cycle, compared with less than half in the previous cycle. The number of dwellings being built in New South Wales in this cycle has not been unusually large. The cycle in Victoria does stand out, however, particularly for medium-density dwellings, which had been especially weak in the two previous housing upturns (Graph C3).
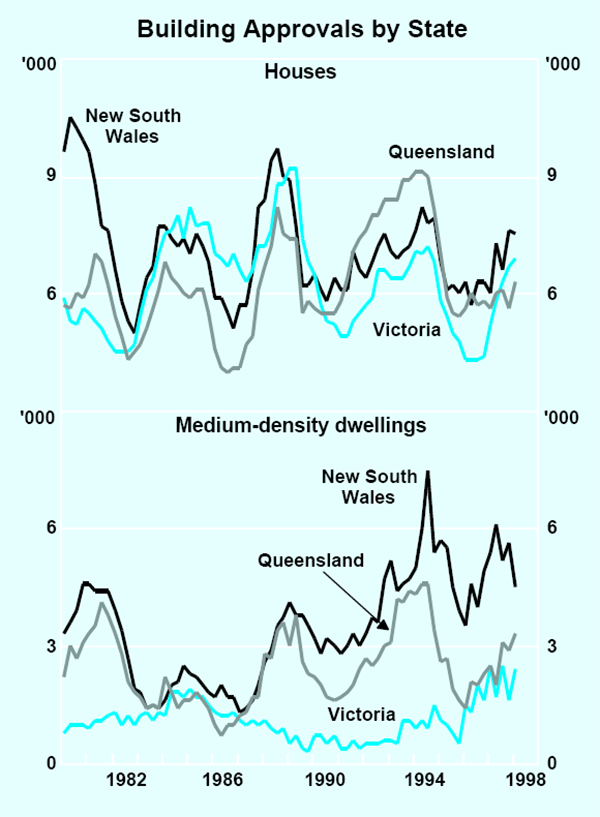
Building approvals in most of the other States have hardly grown at all thus far in the current housing cycle. In Queensland, there has been a modest upturn, but so far it is much weaker than in the early 1990s cycle.
The differing fortunes of Victoria and Queensland seem due in part to shifts in the pattern of interstate migration. To a large extent, dwelling investment is driven by the rate of population growth, and large flows of migrants into Queensland in 1993 and 1994 resulted in particularly strong housing investment at that time (Graph C4). Since then, migration has fallen markedly, leading to a concomitant fall in demand for housing.
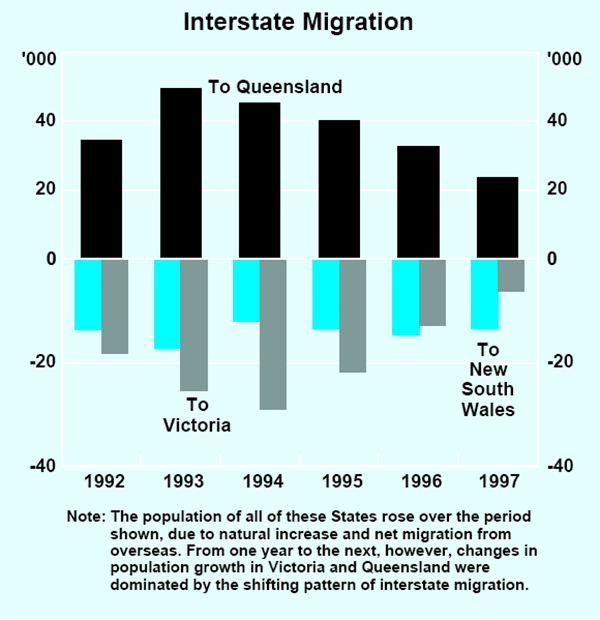
Many of the people who migrated to Queensland came from Victoria, a pattern which is consistent with weak economic activity in Victoria and robust growth in Queensland in the early 1990s. There is some evidence that these people came disproportionately from socio-demographic groups which traditionally favour medium-density dwellings, such as the elderly and less-wealthy households. This pattern of migration flows from Victoria helps to explain the weakness of medium-density activity in Victoria in the previous cycle as well as its more recent strength.
The concentration of activity in New South Wales and Victoria may also help to explain why the average real value of new dwellings has risen in the current housing cycle. Dwellings built in New South Wales and Victoria are more expensive on average than those built in Queensland and the rest of Australia. It is also true, however, that the average real value of dwellings being built in each state is rising. This development reflects lower nominal interest rates (permitting households to obtain larger loans) and rising levels of real income and wealth.
Business sector
Increases in output were recorded for most major industry groups over 1997. The strongest increases were in the service industries, particularly property and communications, and growth was also significantly above average in construction and retailing. Conditions in the manufacturing sector were rather weaker, with output rising by only 1 per cent according to the ABS production accounts over the year as a whole, and declining in the second half of the year. In general, the more internationally exposed industries (or those that are exposed to Asia) have faced more difficult conditions recently, while sector s such as retailing and construction have benefited from the strong pick-up in domestic demand.
Notwithstanding the solid overall expansion in production, it remains the case that businesses in general have found it difficult to maintain or increase their profitability. Profit growth has been constrained by continuing competitive pressure on prices, which has kept average increases in selling prices to less than 2 per cent per annum for the past two years. Total profitability of the corporate sector, as measured by the ratio of gross operating surplus to GDP, has experienced a gradual decline through 1996 and 1997, illustrating the strength of competitive pressures on the supply side at a time when domestic demand conditions have been quite strong.
Going against the overall trend, profits in the construction sector have been increasing strongly, reflecting the upswing in building activity currently under way. In the manufacturing sector, some rebuilding of profits has been occurring over the past year, following a significant deterioration in 1996. The improved recent performance seems to reflect a deceleration in wage settlements in the industry, which had earlier been a pace-setter. Nonetheless, manufacturers have some way to go in restoring earlier profit levels, which in nominal terms are still below their 1994/95 peak.
Surveys of business sentiment have until recently been suggesting moderately rising confidence, consistent with the improving trend in demand and output over the past year. The latest readings, no doubt influenced by uncertainties raised by the Asian crisis, point to some reversal of that trend. Medium-term expectations, in particular, have fallen sharply over the last two quarters and are now around their levels of a couple of years ago.
Most surveys have also started to point to a decline in confidence with respect to the near-term outlook although, at an economy-wide level, the dip in confidence has not been particularly pronounced (Graph 15). The NAB survey for the March quarter reports moderately lower expectations in relation to sales, profitability and employment across most industries; in broad terms, these indicators have moved back to around their levels of a year ago. The Dun and Bradstreet survey, which covers the manufacturing, wholesale and retail sectors, gives a contrasting reading, suggesting that business confidence has continued to improve, while the ACCI-Westpac survey of manufacturers points to a more marked deterioration in recent quarters.
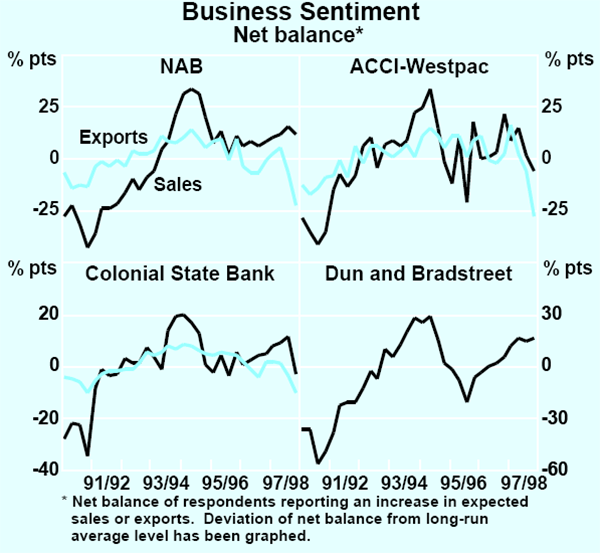
More obvious signs of an impact of the Asian crisis on business expectations are found in survey results specifically related to export sales. Most surveys have been recording a more marked deterioration in the outlook for exports than they have for total sales. Manufacturing-based surveys have tended to point to a more significant drop in confidence than is evident for the economy as a whole, and there is also greater-than-average pessimism in the mining industry, which may be related to developments in world commodity prices. As might be expected, business respondents have expressed some concern when asked specifically whether the Asian crisis would be likely to have an adverse impact on the business environment.
The full extent of any such impact will depend not just on the direct effects on exports, but also importantly on whether resultant uncertainties lead to significant revisions to business investment plans. At this stage, there is little evidence of that occurring. Business investment continued to grow strongly through 1997, particularly in relation to plant and equipment. This type of investment spending increased by 15 per cent in real terms over the year, its fourth successive year of strong growth. Investment in buildings and structures showed little growth during the year, its upward trend being interrupted by the completion of work on the Crown casino project in Melbourne in mid year. Nonetheless, as discussed further below, there have been strong rises in commencements. In total, business investment increased by 12.5 per cent over the year. Alternative annually chained estimates to be adopted later this year by the ABS would suggest that this figure somewhat overstates investment growth but, even allowing for that, investment growth has continued at well-above-average rates (see Box D for a discussion of the general implications of the move to annually chained estimates).
Most industries participated in this solid growth in investment. Mining has remained the strongest area of growth, with projects in the oil and gas and base-metals sectors contributing strongly. Shorter-term swings in sentiment in the industry, including the recent decline in confidence, do not seem to have had a significant effect on investment intentions, which are often subject to very long planning horizons. There was also strong investment growth in the wholesale and retailing industries. In the manufacturing sector, investment levels have been rather weak for the past couple of years, but began to recover towards the end of 1997. This pattern has broadly reflected, with a lag, trends in profitability, although manufacturing output remained weak.
Surveys of business investment intentions are generally pointing to continued growth, and do not reveal any systematic tendency for firms to scale back their plans in the wake of the Asian crisis. According to the ABS capital expenditure survey, conducted in January and early February, business investment intentions for the 1998/99 financial year are 20 per cent higher than the corresponding estimate for 1997/98 taken a year earlier (although this increase comes from an unusually low base). The NAB survey has continued to report investment plans similar to levels that have been recorded over the past couple of years, with only a small downward revision to expectations in the most recent quarters. The ACCI-Westpac survey of the manufacturing sector is noticeably more pessimistic about investment plans, consistent with its more pessimistic assessment of manufacturing conditions more generally and with that sector's greater exposure to trade than the economy-wide average.
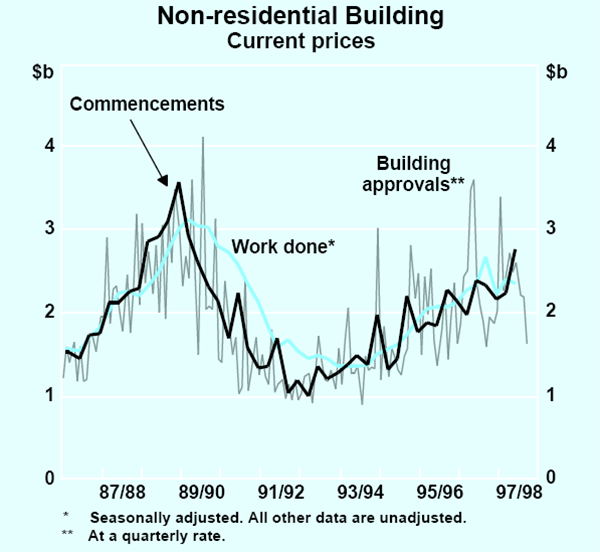
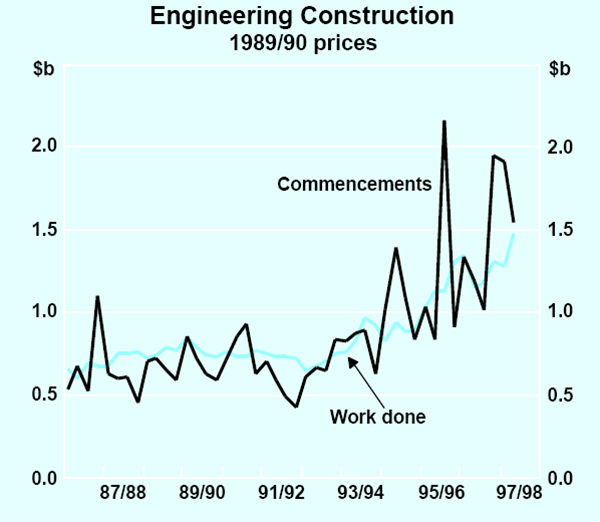
Forward indicator s of construction investment activity are pointing to continued growth in the near term. Although work done on non-residential building projects eased back in mid 1997, reflecting the completion of the Crown casino project, commencements and the stock of work yet to be done have continued to trend upwards (Graph 16). The value of buildings commenced in the December quarter reached its highest level so far in the current upswing, and was 14 per cent higher than a year earlier. The value of building approvals, however, has declined in recent months, though this series is quite volatile. There has been strong growth in commencements of engineering construction projects, which increased by 31 per cent over the year (Graph 17). This strength reflects continued expansion in both resource-related projects and private-sector infrastructure. The high level of outstanding work yet to be done should support activity for some time.
The solid performance of business investment to date has been facilitated by continuing growth in the availability of finance. Credit to the business sector increased by 12 per cent over the year to March, which included a period of particularly rapid growth in the latter part of 1997. There are signs that this pace of credit expansion has been easing recently. However, borrowing by small businesses can be expected to receive a further boost from a recent round of reductions in small-business indicator rates by some major lenders (discussed in detail in the section on Financial Conditions below). The strong growth of business borrowing over the past year has been accompanied by an increasing volume of new equity raisings, encouraged by the strength of the share market.
Rural sector
Based on data up to the December quarter, farm output is likely to fall by close to 4 per cent in 1997/98, following record crop production in the previous year. This would bring the rural sector's share of total output to around 3½ per cent, which is around its average for the 1990s. Production has been affected by drought conditions in many parts of eastern Australia. Nonetheless, due to the fortunate timing of spring rainfall, the size of this year's wheat and barley crops turned out to be much higher than earlier anticipated. Moreover, recent rains across most of the farming areas have improved conditions for the planting of winter crops.
The persistence of dry conditions until recently saw cattle slaughterings maintained at a relatively high level. Meat production has therefore increased significantly over the past year, while the herd size has been reduced. Beef exports have correspondingly been very strong. Live cattle exports, which had been heavily dependent on sales to Indonesia, have, in contrast, fallen sharply in recent months. Conditions in the wool market have also deteriorated significantly since the onset of the Asian crisis. Demand from Korea and Japan, especially, has weakened.
Australia's Balance of Payments
Growth in exports was quite solid through most of 1997. Abstracting from one-off factors (such as the sale of gold from the Reserve Bank's holdings), the volume of exports of goods and services was unchanged in the December quarter, after strong growth in the September quarter, and was 8½ per cent higher than a year earlier. This is equal to the average annual rate of growth of exports during the 1990s.
By the end of the year, however, the early impact of the economic contraction in Asia was becoming apparent. Resource shipments continued to be strong, rising by 6 per cent in the December quarter to be more than 12 per cent higher over the year, but exports of manufactured products and services declined in the quarter. Rural exports also fell, although this was only partly due to lower demand; lower farm production is also lessening the scope for growth in rural exports.
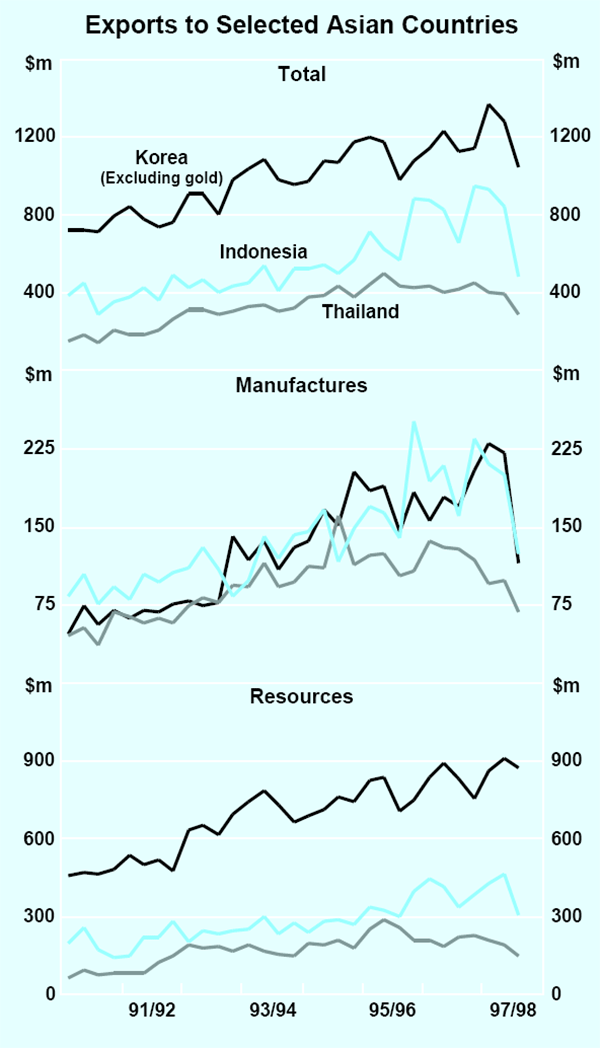
Early figures for 1998 show that export performance is being further hampered by the Asian crisis. Data need to be interpreted with caution, as exports usually fall in the early part of the calendar year, and figures for exports to individual countries are not available on a seasonally adjusted basis. It is quite clear, however, that exports to all of the troubled Asian economies have declined sharply in recent months (Graph 18) although, as noted below, some of this has been offset by greater strength elsewhere. Manufactured exports to the troubled Asian economies have declined by almost half over the past six months. To the extent that Australian-produced goods are for investment or consumption purposes, the contraction in demand within the Asian economies must be expected to be reflected in lower exports of these products. Rural exports are also weakening. The decline in service exports to the region is seen most clearly in a very large fall in the number of Asian tourists arriving in Australia at the end of 1997. The decline in resource commodity exports to the region has not been as sharp as those for manufactures or tourism.
There is some evidence of gains in other markets which are partly offsetting the losses in Asia. Table 6 shows growth in total merchandise exports by destination, over the year to the March quarter. While the decline in exports to troubled Asia is clear, growth in exports to the US, Europe and Japan has increased over the past year, though there must be a question whether, in the case of Japan, this can continue. Stronger export growth to these countries has been clearest for resources. For some manufactured goods, however, it is much more difficult to switch markets and this has been reflected in a slow pace of overall growth. The value of total ETM exports rose by about 2½ per cent over the four quarters to March which, although stronger than the result over the previous year, was well below average annual growth over the past decade of around 15 per cent. Visitor arrivals have weakened significantly over the past year, mainly due to a substantial decline in arrivals from east Asia (Table 7).
| 1998 | 1997 | |
|---|---|---|
| US and EU | 29.3 | 1.2 |
| Japan | 10.3 | −0.2 |
| Troubled Asia | −16.9 | 8.3 |
| of which: | ||
| – Korea | −7.1 | 14.7 |
| – Indonesia | −27.4 | 15.6 |
| – Thailand | −28.3 | −2.5 |
| – Malaysia | −15.4 | −5.1 |
| – Philippines | −19.3 | 8.5 |
| Other east Asia | −1.3 | −9.5 |
| Rest of world | 0.0 | 10.6 |
| Total | 4.4 | 2.5 |
| of which: | ||
| – Rural | −9.9 | 5.1 |
| – Resource | 15.9 | 3.7 |
| – Manufactures | 2.2 | −2.8 |
|
(a) Excludes gold. There have been large fluctuations in gold shipments which have distorted the results for exports to some individual countries. Excluding gold removes this distortion, and makes a negligible difference to the result for total exports. Source: ABS foreign trade data. |
||
| 1998 | 1997 | |
|---|---|---|
| US and EU | 11.0 | 10.7 |
| Japan | −8.2 | −1.6 |
| Troubled Asia | −57.7 | 12.4 |
| of which: | ||
| – Korea | −81.1 | 17.3 |
| – Indonesia | −53.1 | 12.8 |
| – Thailand | −48.4 | −2.1 |
| – Malaysia | −30.8 | 5.2 |
| – Philippines | −22.0 | 38.9 |
| Other east Asia | −5.5 | 0.9 |
| Rest of world | −3.4 | 6.7 |
| Total | −8.7 | 6.2 |
Australian demand for imports remained strong through to the end of 1997, boosted by the strength in domestic spending. Import volumes grew by 12 per cent over the four quarters to December, (although this is also overstated to some extent by the treatment of computers – see Box D). More recent data suggest that growth in imports may have eased early in 1998, although demand has remained very strong for consumer goods imports, especially motor vehicles. Capital goods imports remain at a high level, consistent with strong investment in plant and equipment.
Australia's imports from the troubled Asian economies may increase during 1998 as these countries work to boost their exports. There is some evidence that imports from east Asia are growing faster than total imports, but that was true prior to the onset of the crisis in 1997, and probably reflects a longer-term trend towards greater economic integration with these countries. The recent strength in imports from the region has been concentrated in motor vehicles and gold which is processed for re-export. Gold exports from Korea and Thailand have increased substantially since the onset of the currency crisis. While this gold has boosted Australia's imports, it should have an equivalent effect on Australia's exports.
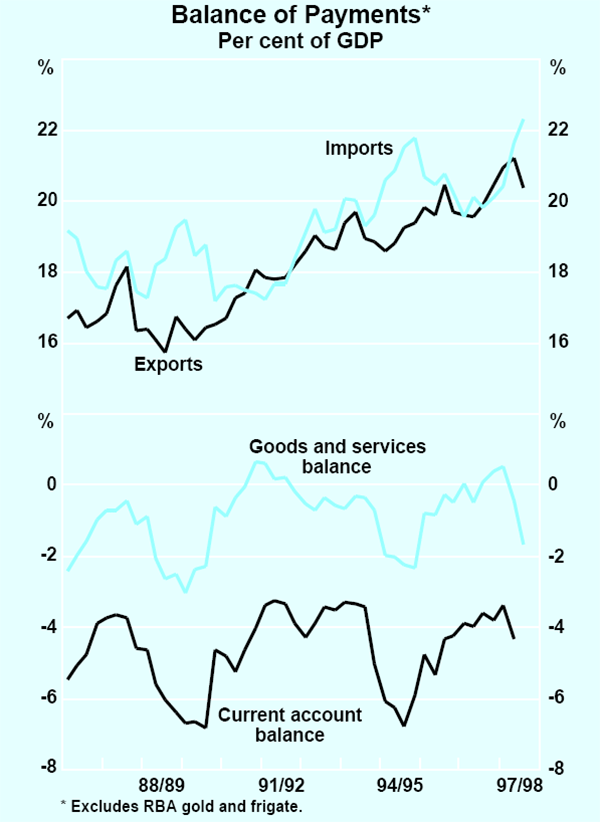
The current account deficit widened to 4.3 per cent of GDP – about the average for the past 15 years – in the December quarter (Graph 19). The balance of trade in goods and services moved from surplus to deficit during the December quarter, as export growth slowed and import growth remained strong. This widening continued in the March quarter, when the trade deficit totalled an estimated 1.7 per cent of GDP, compared with 0.3 per cent of GDP in the December quarter.
The net income deficit increased slightly in the December quarter to $5.3 billion. Net foreign liabilities stood at $321 billion (60 per cent of GDP), with net foreign debt at $222 billion (42 per cent of GDP). While the depreciation of the Australian dollar in the December quarter increased the value of net foreign debt by $3.9 billion, the lower exchange rate reduced the $A value of overall net foreign liabilities by $2.0 billion, as a significant proportion of foreign equity assets held by Australians is denominated in US dollars.
Box D: Annually Chained Estimates of the National Accounts
In the September quarter National Accounts, the Australian Bureau of Statistics will be changing the methodology it uses to derive estimates of the quantity of output and its components. Annually chained estimates will replace the present set of constant price estimates. The new estimates should provide a more accurate assessment of the composition of growth in the economy and relative price movements. To preview these changes, an experimental set of annually chained quantity estimates for GDP(E) and its components were published in March in an information paper.[1]
Noticeable differences between the new chained estimates and the presently published numbers arise when there have been significant changes in the relative prices or quantities of different goods and services demanded or supplied in the economy. Such changes lead to a divergence between price and quantity indices calculated using different methods, such as between base-period-weighted (Laspeyres) and current-period-weighted (Paasche) indices. In a situation in which these divergences are large, frequently re-weighted chained measures provide a better summary of developments.[2]
Graph D1 illustrates that the annually chained and present estimates provide a very similar picture for the expenditure measure of GDP. Over the 7 years to December 1997, these measures imply that growth has averaged 3.5 and 3.3 per cent, respectively, though in some periods estimates of quarterly and year-ended growth differ on account of temporary movements in relative prices.
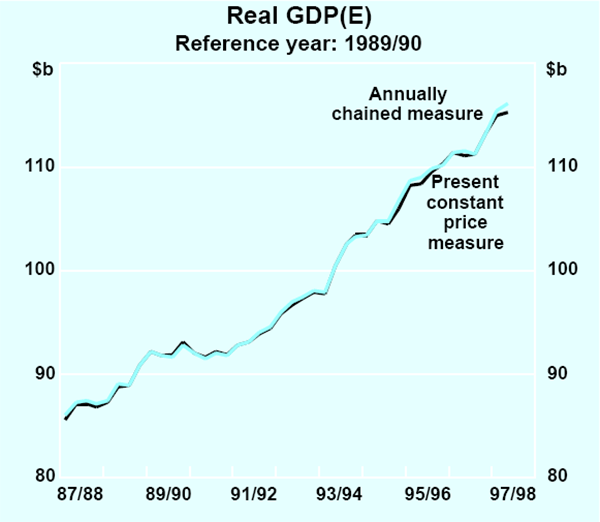
The generally similar aggregate outcomes for GDP(E) in the two sets of estimates reflect some significant but offsetting differences at the level of individual expenditure components. The principle source of these differences is the substantial fall in the relative price of computers that has taken place since the base year: computer prices in relative terms have fallen by about 80 per cent since 1989/90. This means that since 1989/90, the present fixed-weighted quantity indices of expenditure components, which do not take this relative price fall into account, are increasingly giving too high a weight to computers. Since spending on computers is growing faster than other areas of spending, this biases upward the estimated growth in any category of spending in which computers form a significant part. In particular, growth in the quantity of equipment investment, imports and (to a lesser extent) consumption have all been overstated. Since computers are largely imported, these effects are largely offsetting between categories of domestic output and there is little effect on GDP.
Graph D2 shows two measures of both real private investment and real imports. In
each case, the higher measure is derived using 1989/90 prices, and is the
series presently published by the ABS. The second measure is the annually
chained estimate. Comparing these measures suggests that, over the past couple
of years, the presently published data have overstated annual growth in real
equipment investment by about 4 percentage points, and hence private final
demand by around  of
a percentage point. The overstatement of real import growth, by around 2½
percentage points, has largely offset this bias, leaving the level of total
output little affected.
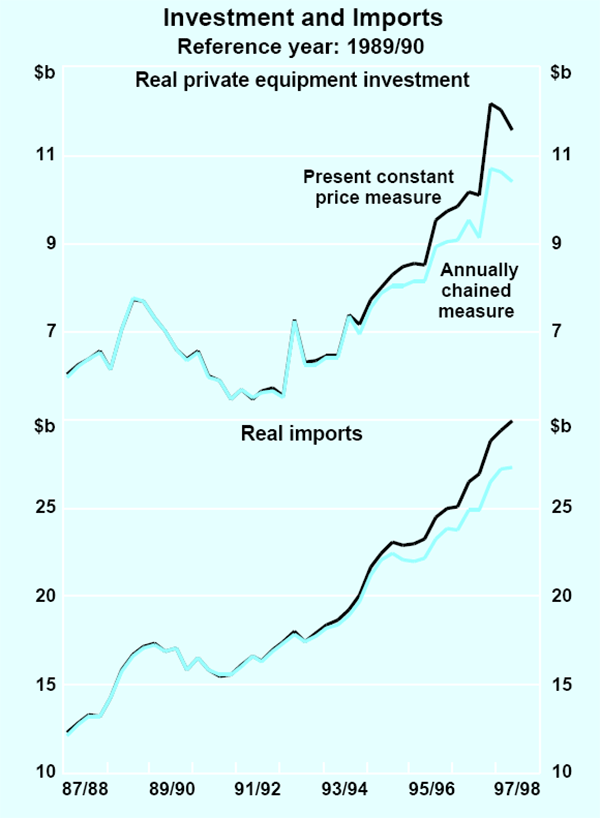
The counterpart to these findings is that the present implicit price deflators for equipment investment and imports have been understating the ‘true’ growth in these prices in recent years. And, as a consequence, presently published estimates of the terms of trade have been misleading. Graph D3 shows that estimates of the terms of trade based on the annually chained data are somewhat lower than the presently published estimates, especially during the past few years. Again, the main reason for this is that the traditional terms of trade measure has, in recent years, effectively given increasing weight to computer prices. Given that computers are mainly imported and that their prices are falling, this leads to an increasing upward bias in the terms of trade measured on the present basis.
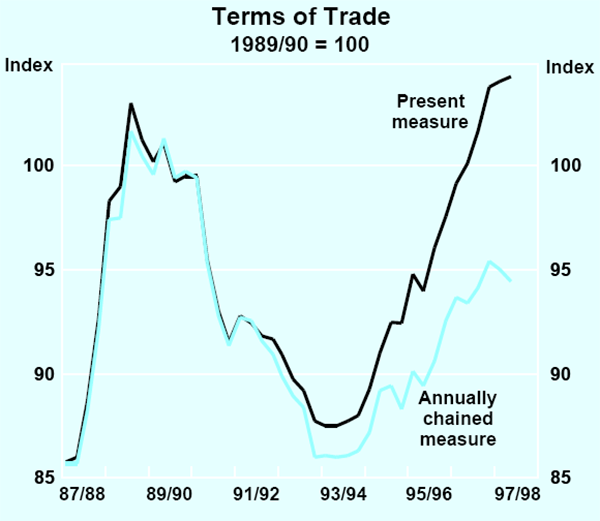
Commodity prices
Measured in SDRs, commodity prices declined during the second half of 1997, but they have stabilised in recent months at a level around 9–10 per cent below that of the middle of 1997, just prior to the outbreak of the Asian crisis (Graph 20). The prices of both rural and resource products have weakened. Wool prices have continued to fall recently, with $A prices down 15 per cent since December. The prices of base metals, where the falls were greatest in late 1997, have been mostly unchanged since the start of 1998. New contract prices for bulk commodities came into effect in April. Coal prices declined by between 5 and 10 per cent in US dollars (although in Australian dollar terms they were higher than in contracts struck a year earlier). Contract prices for iron ore were lifted by 3 per cent in US dollar terms, with negotiations (which took place late in 1997) taking account of the strength of global demand, notwithstanding weakness in Japan and Korea.
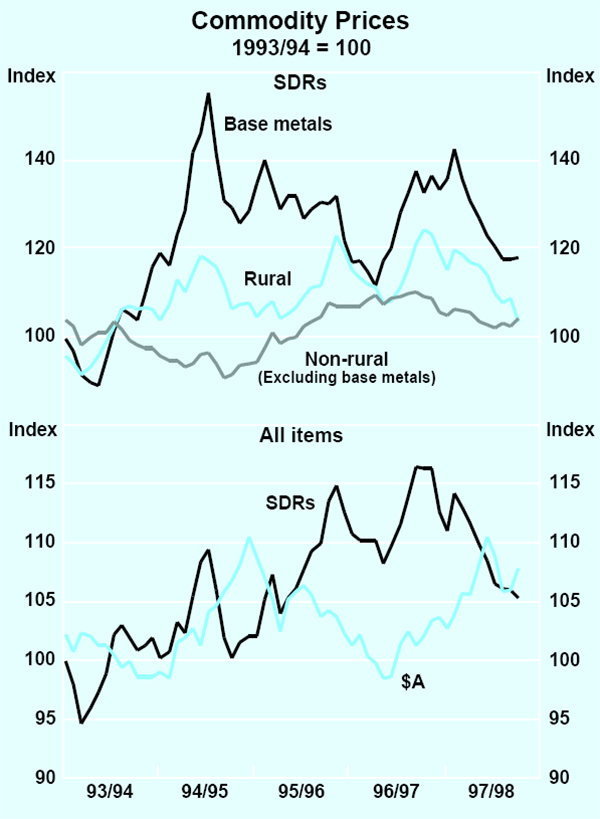
In $A terms, it remains the case that overall commodity prices are slightly higher than they were a year ago, and are at about their average for the past five years. This is a result of the Australian dollar depreciating against the currencies of the major countries in the past six months or so.
Of considerable significance for the world economy, oil prices fell sharply early in 1998 as the Asian crisis and a mild northern winter highlighted the oversupply in the market. The price of West Texas crude fell to around US$13 per barrel in mid March before major oil-producing nations reached an agreement to cut supply. This has lifted prices by around US$3 per barrel. Nonetheless, prices remain quite low by historical standards.
The labour market
Labour market conditions strengthened in response to the firmer trend in economic activity. There was a strong pick-up in employment in the second half of 1997 although monthly figures available so far in 1998 have shown a flatter trend (Graph 21). Over the year to March 1998, total employment increased by 1.5 per cent. Employment growth has been strongest in a number of private-sector service industries including property and business services, and in the construction industry, reflecting the upswing in housing and non-residential construction activity. As has been the case for some time, this strength has been partly offset by employment reductions in public administration and utilities, with employment in manufacturing also weak.
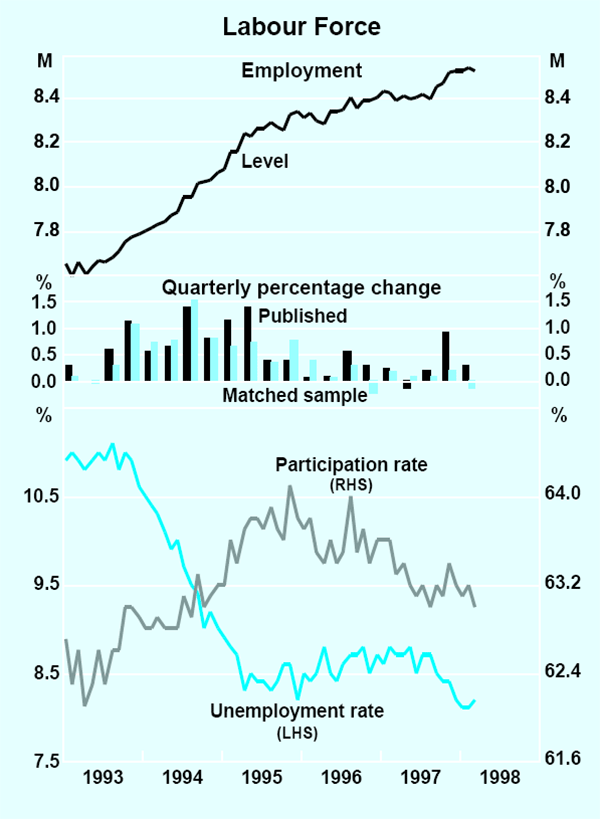
The stronger overall employment trend since mid 1997 brought about a decline in the unemployment rate. By December 1997, the unemployment rate had fallen to 8.2 per cent, around half a percentage point lower than its average in the first half of the year. Unemployment remained around this lower level over the first three months of 1998.
Employment growth over the recent period has been weighted towards full-time jobs (Graph 22). Since the middle of 1997, full-time employment has increased at an annual rate of 2.2 per cent, compared with a rate of increase of 0.9 per cent in the part-time component. This means that, on a full-time equivalents basis, the pick-up in labour demand in the recent period has been slightly stronger than implied by the increase in the total number employed. This pattern is not unusual when a cyclical pick-up in employment occurs: full-time employment has generally shown a relatively high degree of sensitivity to short-term variations in economic activity, a fact which also accounts for the relative weakness of full-time employment during 1996. This cyclical pattern has occurred alongside the structural shift towards an increasing share of part-time employment evident over the longer term.
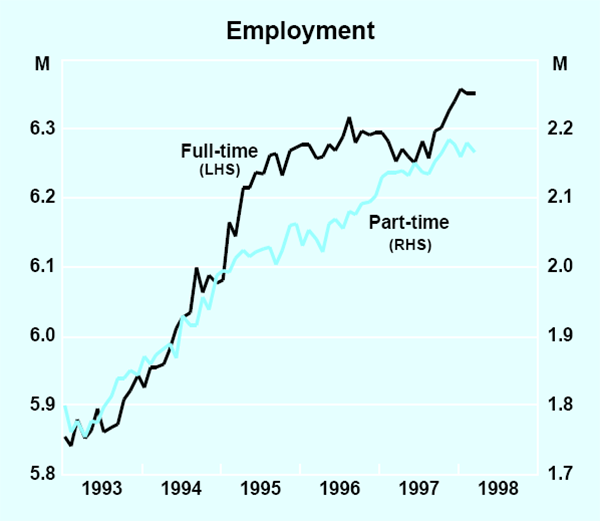
While the labour market clearly strengthened in the second half of 1997, it is unclear how much of that strength has carried forward into the early months of 1998. Taking the labour force data at face value, there was no further increase in total employment between December and March, although there was some continuation of the shift towards full-time employment referred to above. Matched-sample estimates of employment, which can be useful in analysing short-term changes, suggest a decline in employment over recent months. Given the volatility of the monthly data, it is difficult to assess whether these weaker results represent a significant slowing in the underlying trend. It would be surprising if the trend towards higher employment were to weaken so soon. Growth in output in 1997 was, by any historical experience, quite strong enough to generate good growth in employment. Productivity growth through the year outstripped the impressively high average for this expansion by a considerable margin; it would be highly unusual for such strength in productivity growth to be sustained for long. These factors would normally be enough to generate employment gains for some time, even if output growth is easing back.
One factor that might be thought to be contributing to a weakening of demand for labour at the moment is the impact of the Asian crisis. There have been declines in employment in two industries – accommodation and recreation – likely to have been affected by reduced tourist arrivals over recent months. However, the total of these declines is quite small (a reduction of 3,000 over the past six months). Business surveys show little evidence of a change in employment behaviour in recent months at an economy-wide level, or of a significant change in near-term hiring intentions. Moreover, job vacancies have continued to increase. The ANZ measure of job vacancies has continued to edge higher, while the ABS measure shows private-sector vacancies 25 per cent higher than a year ago, following a 15 per cent increase in the three months to February (Graph 23). Both measures are at levels that in the past have been consistent with a good pace of job creation.
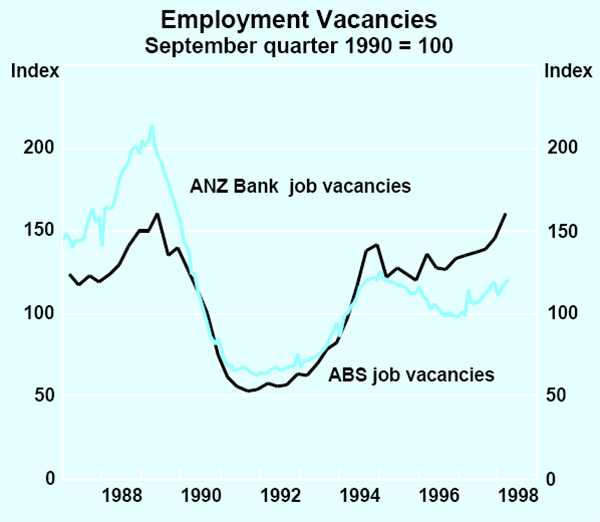
Financial Conditions and Monetary Policy
Interest rates
As noted earlier, since July 1997, the cash rate has been steady at 5 per cent, a level just above its trough of 1993/94. The effects of cash-rate reductions over the past two years have been reinforced by a widespread compression of interest margins of financial intermediaries, with the result that, in many cases, interest rates faced by borrowers have fallen below their earlier troughs. The most recent example of this process was a round of reductions in indicator rates for small businesses in recent months, discussed in detail below and in Box E.
Signs of competition in small business finance have increased over the past six months, with a range of products now available at indicator interest rates well below the predominant indicator rate available six months ago. The latest statistics on the average overall interest rate on small business variable-rate loans – which incorporate customer risk margins as well as the indicator rate – also show noticeable reductions, by more than can be explained by the easing of monetary policy in recent years. In December 1997 (the latest statistics available), the average overall interest rate on variable-rate loans to small business was 9.4 per cent, down from 12.6 per cent in the June quarter 1996 at the beginning of the phase of easing in monetary policy. As a result, the margin over the cash rate has narrowed by 0.7 of a percentage point. A major factor in this was the introduction in 1997 of new loan products, such as residential-secured overdrafts and term loans at interest rates well below the standard indicator rate.
This process of offering a wider range of products at discounted rates has continued in 1998, with the result that indicator rates on most small business loan products are now in the range of 6.8–7.5 per cent, the lowest rates available since at least 1965 (Graph 24).
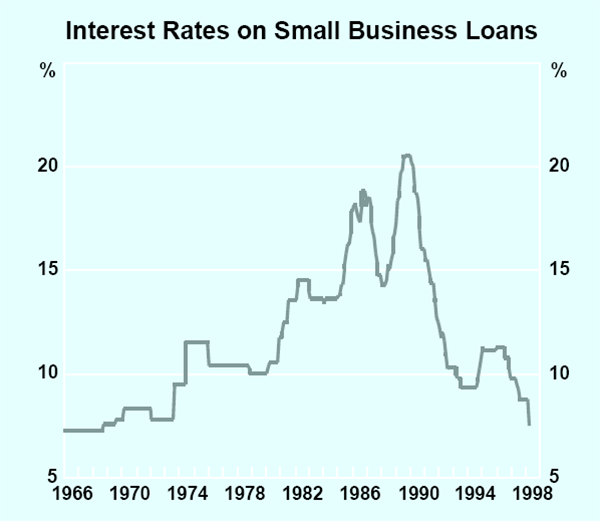
Indicator rates on variable-rate loans for large businesses have clustered around 8.5 per cent since the reduction in cash rates in July 1997, although one bank has recently reduced its indicator rate in line with the falls in its small business rates. However, the weighted-average of variable-rate loans to large business has declined from 10.6 per cent in mid 1996 to 7.8 per cent in December 1997, suggesting some discounting to advertised rates. Creditworthy corporate customers typically pay only a slight margin over funds raised in wholesale markets, such as bank bills. The growing tendency for corporates to approach the market directly, as discussed in Box F, is increasing competitive pressures on banks and operating to keep these margins fine.
The standard interest rate banks charge on variable-rate housing loans has remained steady at 6.7 per cent since August 1997. The margin to the cash rate has also remained unchanged at 1.7 percentage points; this follows the phase between May 1996 and February 1997 when pressure of competition, mainly from mortgage managers, saw this spread contract from 3.0 percentage points above the cash rate. Banks continue to offer ‘basic’ or ‘no frills’ products at a rate of around 6.2 per cent, slightly below rates offered by mortgage managers. Interest rates charged by mortgage managers have remained steady at around 6.4 per cent.
Interest rates on fixed-rate housing loans have continued to fall, reflecting lower funding costs in capital markets. The average rate on new loans for terms fixed for three years is currently about 6.8 per cent, a fall of about 50 basis points since the easing of monetary policy last July, broadly in line with the fall in funding costs in the same period.
The effect of competition on the market shares of banks and mortgage managers has become clearer (see Graph 25). Between 1994 and mid 1996, banks lost market share as mortgage managers undercut them on interest rates. The cuts in banks' mortgage rates over and above the reductions in the cash rate had the effect of stabilising banks' market share at around 83 per cent of total new loans, down from 90 per cent earlier in the 1990s. However, the decision by banks to refrain from passing on all of the reduction in the cash rate announced in May 1997 saw mortgage managers' share of new loans rise by a further 4 percentage points, ground that banks have not fully recovered.
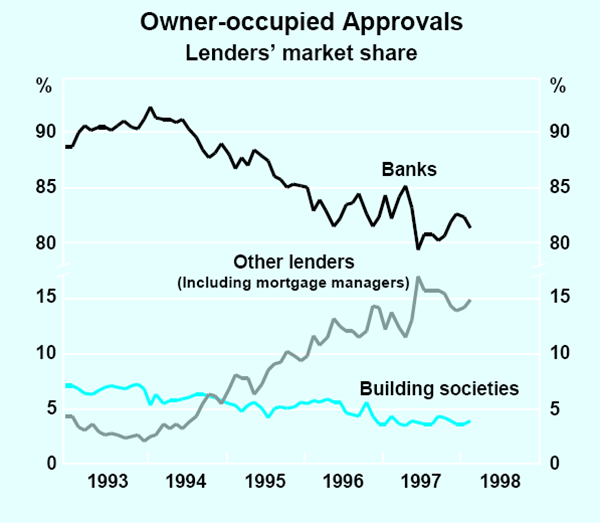
Margins on personal lending remain higher than on housing and business lending. Some banks have reduced interest rates on selected retail products, both secured and unsecured, in April and May. With margins on housing and small business loans having narrowed, competition by banks for personal loans, which has recently been the fastest growing sector, might also be beginning to intensify. To date, however, these reductions have been confined to some banks and selected, if mainstream, products.
Real interest rates, on a variety of measures, have continued to decline over the past three to four years.[1] Although there is no single definitive real interest rate measure (since real interest rates depend on inflation expectations which are not directly observable), it is reasonable to conclude that real interest rates have fallen by slightly less than nominal rates in recent years, since most indicators of inflation expectations have been declining. Two measures presented in Table 8 suggest that the real cash rate is currently slightly below its average of the past five years. While there is no precise benchmark as to whether that constitutes an expansionary setting, it can be noted that this has been a period of above-average growth for the economy and particularly private sector spending.
|
Calculated using underlying inflation |
Calculated using Melbourne Institute Survey |
|||||
|---|---|---|---|---|---|---|
| Early 1990s 5-year | Early 1990s 5-year | |||||
| Latest(b) | trough | average | Latest(b) | trough | average | |
| Cash rate | 3.5 | 2.5 | 3.8 | 1.5 | 0.2 | 2.0 |
| Housing loan rate | 5.1 | 6.4 | 6.5 | 3.2 | 4.1 | 4.8 |
| Small business variable rate(c) | 6.0 | 7.0 | 7.5 | 4.0 | 4.6 | 5.7 |
| Large business variable rate | 6.9 | 6.7 | 7.3 | 4.9 | 4.3 | 5.4 |
| (a) The table shows two measures of real interest rates, calculated using
the previous year's underlying inflation rate and the Melbourne Institute
survey result as proxies for expected inflation. (b) Incorporates interest rate reductions announced as at 5 May. (c) From December 1996, calculated as the average of the four major banks' variable rates; prior to that, the predominant rate is used. |
||||||
Box E: Aspects of Small Business Finance
The tentative signs of increased competition in small business finance that were evident six months ago have become clearer in the period since. In particular, banks have started cutting interest rates on mainstream lending products, such as overdraft facilities, and the average all-up interest rate paid by small businesses (including customer risk margins) has fallen significantly even though monetary policy has not been changed.
As noted in the material provided in the lead-up to the Bank's previous appearance before the Committee, signs of increased competition in the small business loan market began to emerge following the reduction in banks' housing loan margins in 1996 and early 1997. Initially, competition for small business loans took the form of products at discounted interest rates aimed at new customers. These developments had some parallels to the way competition in the housing loan market first appeared. But, as was the case for housing loans, competition eventually spread to mainstream small business products. In early 1997, major banks announced new residential-secured products, either as overdraft or term loans, at interest rates of 1½–2 percentage points below the standard overdraft indicator rate, and without a customer risk margin.
In recent months most of the major banks have announced reductions in overdraft indicator interest rates of between 1 and 1.8 percentage points. In some cases, a fixed margin applies above these indicator rates according to collateral and whether the facility is a term loan or overdraft. While there is no single predominant rate, indicator rates on small business variable-rate loans from major banks are now concentrated around 7 per cent, the lowest indicator rate offered on a ‘widely available’ product by a major bank since the early 1960s. Previously, all the major banks had been advertising indicator rates of 8.75 per cent or a little more for all but residentially secured lending (Table E1). Before the easings of monetary policy in mid 1996, the major banks' overdraft products were based uniformly on an indicator rate of 11.25 per cent.
| May 1998 | December 1997 | June 1996 | ||
|---|---|---|---|---|
| Overdraft: | ||||
| Secured by residential property(b) | range | 6.95–7.20 | 6.80–7.70 | n.a. |
| average | 7.1 | 7.2 | n.a. | |
| Others(c) | range | 6.95–8.75 | 8.75–8.95 | 11.25 |
| average | 7.7 | 8.8 | 11.25 | |
| Term: | ||||
| Secured by residential property(d) | range | 6.80–6.99 | 6.80–7.15 | n.a. |
| average | 6.9 | 7.0 | n.a. | |
| Other(c) | range | 6.95–8.75 | 6.99–8.95 | 9.45–11.25 |
| average | 7.7 | 8.8 | 11.0 | |
|
(a) Major banks. (b) Most banks do not apply a margin to overdrafts secured by residential property, although one does. (c) Customer risk margins apply to these products. (d) Since March 1997, banks have not applied a customer risk margin to term loans secured by residential property. |
||||
The recent announcements by banks have reinforced a trend towards giving greater recognition to the type of security offered for loans. This tiering of interest rates according to security offered reflects the spectrum of risk in business lending if the need arises to liquidate collateral in the event of business default.
The effects of growing competitive pressure will show up over time in further falls in the average interest rate paid by small businesses. These data, which cover the all-up interest rate paid by small business – i.e. indicator rates plus customer risk margins – are collected by the Bank on a quarterly basis. The latest figures available are for the December quarter. Whereas in the couple of years to mid 1997 there had been little change in this rate apart from that due to changes in monetary policy, in the period since then it has fallen significantly. The average overall interest rate paid by small businesses on variable rate loans was 9.4 per cent in the December quarter, down from 10.6 per cent six months earlier. This reduction reflected, to an important extent, the new lower-priced products introduced in 1997. Obviously, the more recently announced reductions in overdraft rates referred to above have not yet been reflected in these figures.
These reductions have meant that the margin between the rate banks charge customers and their funding costs has narrowed (Table E2). In the case of variable-rate loans, banks' funding costs can be approximated by the cash rate. The margin between the indicator rate on a standard overdraft and the cash rate had been mostly around 3.75 percentage points over 1996 and 1997; the average margin for major banks is now 2.7 per cent. The margins for residential-secured overdrafts and term loans are now 2.1 per cent and 1.9 per cent, respectively.
| Over cash rate | Over swap rate | |||||
|---|---|---|---|---|---|---|
| Small business indicator rates: | Average rate | Fixed-rate indicator | ||||
| Residential-secured | Other overdraft | Paid by small business on variable-rate loans | ||||
| Term loans | Overdraft | |||||
| Mar 95 | 3.60 | 5.1 | 1.6 | |||
| June 95 | 3.60 | 5.0 | 1.2 | |||
| Sep 95 | 3.60 | 5.0 | 1.6 | |||
| Dec 95 | 3.65 | 5.0 | 1.8 | |||
| Mar 96 | 3.75 | 5.1 | 1.4 | |||
| June 96 | 3.75 | 5.1 | 1.6 | |||
| Sep 96 | 3.75 | 5.0 | 1.8 | |||
| Dec 96 | 4.25 | 5.4 | 1.9 | |||
| Mar 97 | 1.9 | 2.5 | 3.75 | 4.9 | 1.5 | |
| June 97 | 2.0 | 2.3 | 4.00 | 5.1 | 1.6 | |
| Sep 97 | 2.0 | 2.2 | 3.80 | 4.6 | 1.5 | |
| Dec 97 | 2.0 | 2.2 | 3.80 | 4.4 | 1.6 | |
| Mar 98 | 2.0 | 2.2 | 3.80 | n.a. | 1.5 | |
| May 98 | 1.9 | 2.1 | 2.70 | n.a. | 1.4 | |
| (a) Margins are based on average indicator rates charged by major banks. | ||||||
Measured across all variable-rate products, and after taking into account customer risk margins, the total interest rate paid by small business fell to 4.4 percentage points above cash in the December quarter 1997, after having been fairly steady at around 5 per cent over the period to mid 1997.
As the recently announced reductions in interest rates come into the figures, it might be expected that this margin will narrow further. It seems unlikely, however, that small business margins overall will fall to the same extent as those on owner-occupied housing because small business lending is, on the whole, more risky than lending for housing. While, as noted in the past, competition of mortgage managers in the housing market was a spur for banks to compete more actively in the market for small business loans, direct competition from mortgage managers in the small business market is likely to be less intense. Some mortgage managers have entered the small business market on a limited scale and with mixed results.
The distribution of interest rates paid by small businesses on variable-rate loans is shown in Graph E1, both for the period before the monetary policy easings which began in mid 1996, and for the latest period. Most of the shift to the left (i.e. downward move) of this distribution is due to the easings, as reflected in the fall in the standard overdraft indicator rate from 11.25 per cent in June 1996 to 8.75 per cent in December 1997. In addition, however, the proportion of loans at rates below these indicator rates has increased, due to the availability of new lower-priced products, including residential-secured products.
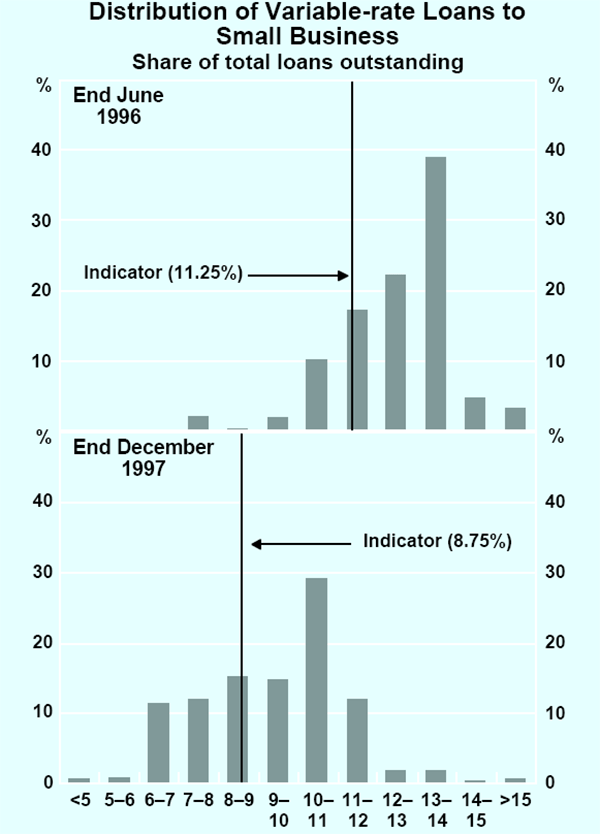
The recent increase in competitive activity has been concentrated in variable-rate loans. The fall in interest rates on fixed-rate loans has been smaller than that for variable-rate loans, in part because banks' margins on fixed-rate loans were always smaller than those on variable-rate loans (as shown in Table E2). In recent months, indicator rates on small business fixed-rate loans have fallen slightly. Those on three-year fixed-rate loans are currently around 7 per cent, 2.9 per cent lower than in mid 1996. This fall is a little more than the fall in the cash rate but roughly in line with the fall in relevant funding rates, which can be approximated by rates in swap markets.
The average interest rate measured across all existing fixed-rate loans to small businesses has fallen by 1.5 percentage points (to 9.1 per cent) since mid 1996. The smaller fall in this rate than in the indicator rate is because the lower indicator rate has not yet worked through the stock of existing loans. As noted in the previous Semi-Annual Statement on Monetary Policy, during periods of falling interest rates, these adjustment lags work to hold up the average interest rate on fixed-rate loans, while they operate in the opposite direction during periods of rising interest rates.
Real interest rates faced by borrowers have declined more substantially than real cash rates, as a result of the reductions in intermediaries' interest margins discussed earlier. On the basis of the same two definitions used above, real interest rates on loans from intermediaries have fallen well below their averages of the past five years. For housing and small business loans, these are now below their previous cyclical troughs.
Financial intermediation
Interest-rate settings have proved consistent with strong growth in private expenditure during the past year and with a pick-up in the rate of growth of financial intermediaries' credit (Table 9). Over the year to March 1998, intermediaries' credit to the private non-financial sector increased by just under 12 per cent, up from a rate of just under 10 per cent a year earlier. There were some signs, however, that the rate of credit expansion may have begun to ease a little in the early months of 1998.
| Year to: | Three months(a) to: | |||
|---|---|---|---|---|
| March 1997 | March 1998 | December 1997 | March 1998 | |
| Total Credit | 9.6 | 11.8 | 14.4 | 9.1 |
| – Personal | 12.3 | 14.0 | 21.5 | 16.3 |
| – Housing | 10.3 | 10.8 | 10.3 | 10.8 |
| – Business | 8.5 | 12.3 | 16.0 | 6.4 |
| Currency | 2.5 | 8.7 | 8.8 | 7.9 |
| M1 | 14.2 | 11.6 | 6.5 | 2.9 |
| Broad money | 9.4 | 6.7 | 3.3 | 3.9 |
| (a) At an annual rate. | ||||
The composition of credit growth has changed markedly over the past year (Graph 26). There was a pronounced strengthening in the rate of growth of personal credit in the second half of 1997. Much of this growth can be traced to growth in revolving credit in the form of overdrafts and credit-card lending; it also partly reflects strong growth in motor-vehicle financing. The Telstra share offer in October and November probably accentuated the trend: there was a pick-up in loan approvals for personal investment, and the need for additional liquidity by households subscribing to the offer may have contributed to greater demand for other forms of credit. More generally, the increased use of personal credit was related to the strength of consumer spending over the second half of the year.
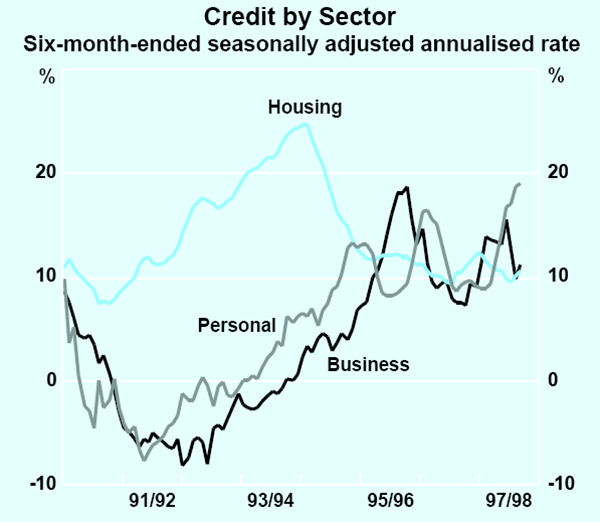
Box F: Growth in Non-intermediated Debt
Over the past two years, non-intermediated debt – that is, debt raised by companies issuing securities directly to the market – has picked up sharply, with annual growth rates rising from less than 2 per cent in 1995 to around 30 per cent over the year to March 1998. Since late 1995, the level of non-intermediated debt on issue has almost doubled, having remained broadly unchanged during the first half of the 1990s (Graph F1).
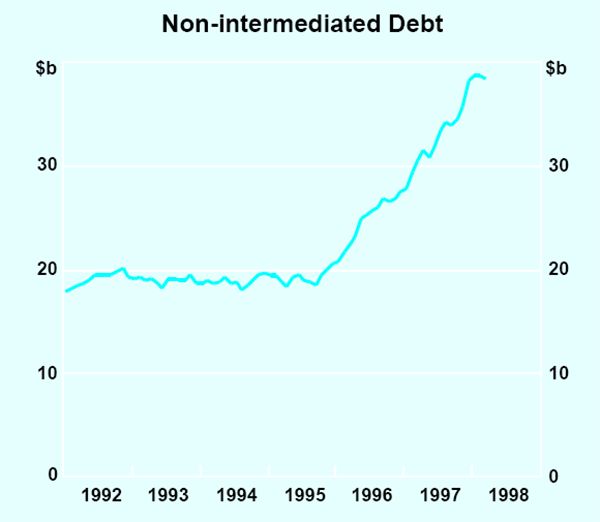
The rate of increase of non-intermediated debt over the past two years has outpaced that of lending by intermediaries. Non-intermediated debt, however, remains a relatively minor source of funds; currently, it amounts to about $38 billion, compared to intermediated credit of about $530 billion. That said, the solid growth in non-intermediated debt has led to the total borrowings (or debt) of households and businesses growing by a bit over 1 percentage point faster than credit from intermediaries over the past year or so, with a growth rate of 13 per cent, or twice the rate of growth of nominal GDP.
Around 60 per cent of the non-intermediated funding represents direct approaches to capital markets by corporations (down from around 70 per cent in early 1995), while the remaining 40 per cent reflects issues of debt to finance housing loans by mortgage managers and banks (up from around 30 per cent in early 1995). Some banks have also recently issued debt against corporate loans, although this development has not yet had a significant impact on the figures. The statistics shown here avoid the problem of ‘double counting’ since securitisation of loans by banks has the effect of reducing their balance sheets (and credit) while boosting the level of non-intermediated debt.
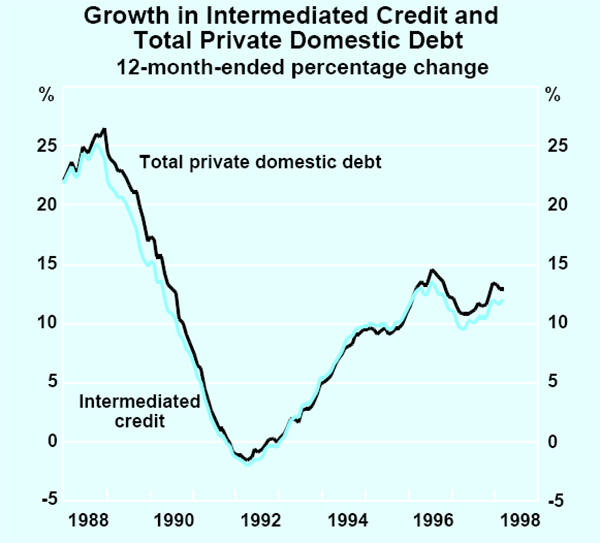
Non-intermediated corporate debt – such as bond issues and promissory notes – began to rise rapidly in early 1996, following a prolonged period of weakness in the early 1990s when companies had focused on reducing gearing ratios from the unsustainable levels of the late 1980s (Graph F3). This type of debt has grown at about twice the pace of intermediated credit (at an annual rate of around 20 per cent) over the past year. Since early 1990, non-intermediated debt of the corporate sector has doubled as a ratio to intermediated credit, to almost 9 per cent.
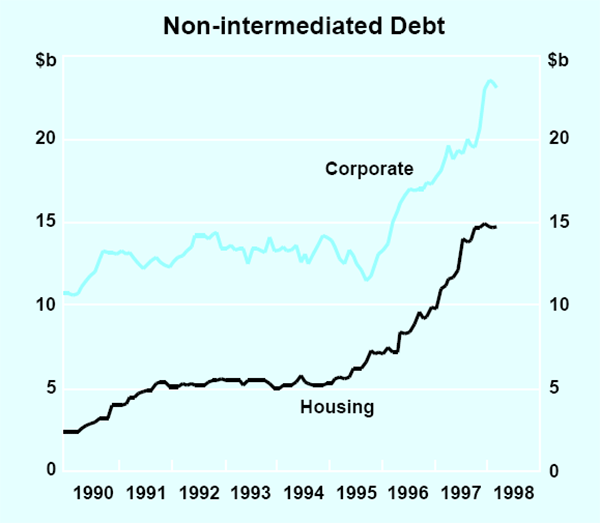
The growth of the corporate debt market has been helped by the reduction in governments' demands on capital markets and by the growing appetite for securities by superannuation funds. It has also been helped by the fall in inflation, which has led to a sharp fall in capital market interest rates, thereby reducing the relative attractiveness of funding through the banking system. Any long-term tendency for companies to approach capital markets directly should, over time, continue to exert downward pressure on margins on business lending of intermediaries, including banks.
The emergence of the mortgage-backed securities market has also owed importantly to these factors. Over the past year, there has been a sharp rise in issues of debt to finance loans by mortgage managers and by banks which have restructured parts of their housing loan portfolios. New lending for housing originated by mortgage managers has grown in the past year at around 1½ times the rate of lending by other financial institutions.
Credit to businesses also showed a strong pick-up in the second half of 1997, increasing at an annual rate of 15.5 per cent over the six months to December, although it has eased considerably in the early months of 1998. New business loan approvals remain around record levels, but appear to have reached a plateau in recent months. Business loan approvals in the past six months have been strongest in the property, wholesale and, to a lesser extent, manufacturing sectors.
In contrast to the other components, the volume of housing credit outstanding has grown at a relatively stable rate during the past year, increasing by 10.8 per cent over the year to March. Much of the growth in housing credit has been concentrated in lending to investors. While new lending commitments for owner-occupiers have been increasing relatively strongly in the current housing upswing, there has been a tendency for existing loans to be paid off more quickly as interest rates have fallen, thus holding down the overall growth in the volume of owner-occupier loans outstanding.
Unusually for a period of strong growth in aggregate credit, there has been a significant decline in the rate of growth of monetary assets held by the community. The stock of broad money, which consists mainly of deposits with financial intermediaries, increased by 6.7 per cent over the year to March, well down from the rates of around 10 per cent a year ago (Graph 27). With deposits growing more slowly, the expansion of credit by financial intermediaries has been partly funded by increased capital market raisings, by reductions in holdings of government securities, and by increased use of external borrowing. Offshore borrowing by financial intermediaries has been growing at annual rates of around 20 per cent for the past two years.
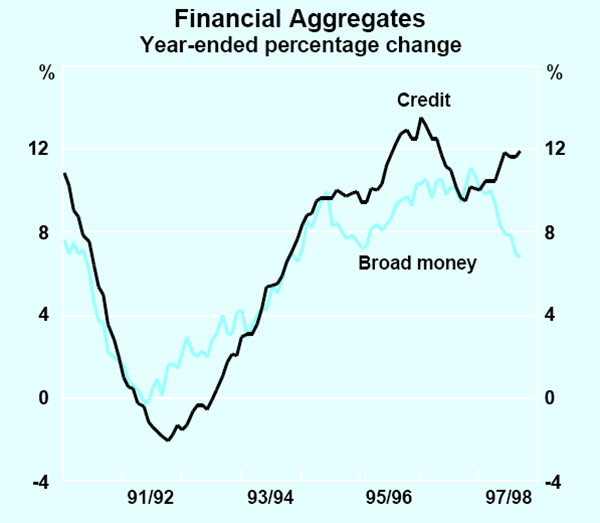
Total household financial assets, however, have continued to expand more quickly than incomes, rising by 10 per cent over the year to December 1997. The increase in household financial assets was concentrated in holdings of equities, both directly and through superannuation funds. Continuing a trend that has been evident for some time, growth in holdings of deposits with traditional financial intermediaries has been outpaced by growth in managed investments. The fastest-growing component of this has been cash management trusts, where assets over the past year have increased by 40 per cent (Table 10). Rapid growth of these funds has reflected the interest-rate advantage that they offer relative to traditional bank deposit products, as well as their increasing ability to offer transactions facilities such as cheque-writing that compete with the services provided by banks. There has also been strong growth in assets of unit trusts and, to a lesser extent, superannuation funds. Life office and superannuation fund investments remain the largest component of household financial wealth, comprising about half of the total. Direct household holdings of equities were boosted substantially by the Telstra float in the December quarter, and will be further boosted by the issue of AMP shares to policyholders in 1998. The overall growth in households' net financial wealth in 1997 was faster than it had been for some years.
| December 1995 | December 1996 | December 1997 | |
|---|---|---|---|
| Cash management trusts | 20.1 | 38.6 | 40.5 |
| Unit trusts | 13.1 | 26.4 | 32.7 |
| of which: | |||
| – Property trusts | 11.2 | 17.2 | 29.1 |
| – Equity trusts | 16.0 | 31.2 | 35.6 |
| – Mortgage trusts | 5.6 | 36.0 | 40.6 |
| Life offices | 7.3 | 6.7 | 10.7 |
| Superannuation funds | 16.3 | 15.4 | 18.4 |
| Total | 11.8 | 13.3 | 18.0 |
|
Sources: ABS Cat. Nos 5655.0 and 5645.0 |
|||
Inflation Trends and Prospects
Recent developments in inflation
The consumer price index in underlying terms increased by 0.5 per cent in the March quarter and by 1.5 per cent over the year (Graph 28). The March quarter increase followed three successive quarterly rises of 0.3 per cent, with the pick-up from that level partly attributable to the contribution from import prices, as explained in detail below.
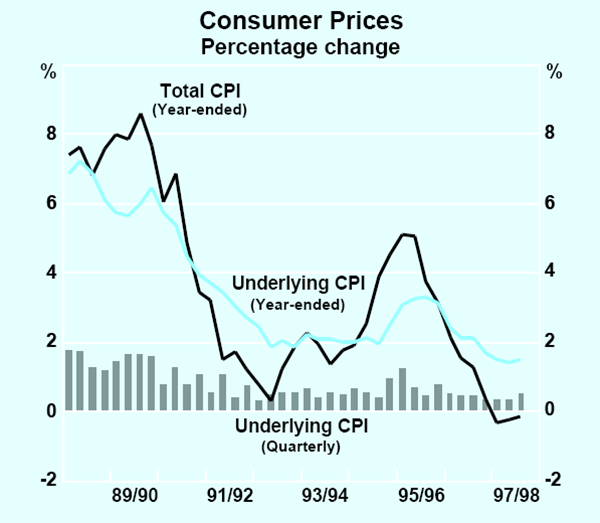
The movement in the headline CPI over the past year has been held down to a significant degree by mortgage interest rate reductions and, more recently, by declining petrol prices. In the March quarter, the CPI rose by 0.3 per cent, but fell by 0.2 per cent over the year to March. Mortgage interest reductions detracted 1.3 percentage points from the change in the index over the year, with most of the effect concentrated in the June and September quarters.
Import prices have played a significant role in recent inflation movements. For much of the past two years, the imported-goods component of the CPI has been falling, and has therefore contributed to the containment of overall inflationary pressures. Over the year to the December quarter 1997, this component declined by 2.6 per cent, including a fall of over 1 per cent in the December quarter. In large part, these price declines reflected the gradual pass-through of earlier appreciation of the trade-weighted exchange rate during 1996 and early 1997. Subsequent depreciation of the currency has meant that the direction of the impetus from import prices is now being reversed. In the March quarter, the imported-goods component of the CPI rose by 0.6 per cent, its first quarterly increase for around two years. The rates of increase in prices of domestically produced goods and services in the CPI have continued to decline (Graph 29).
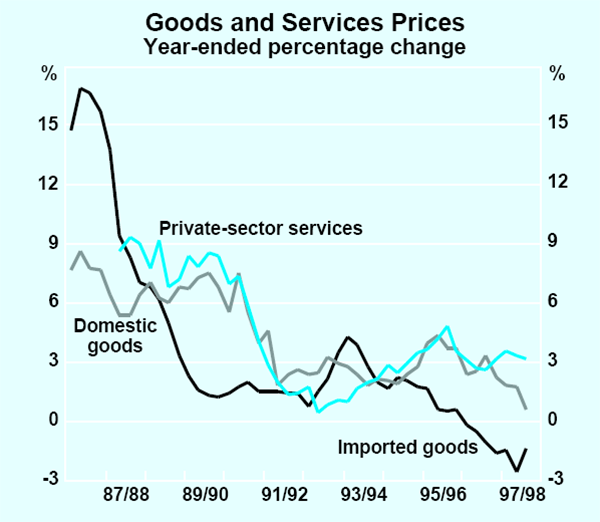
The effects of exchange-rate movements typically work in two stages – their initial effect on import prices across the docks, and their final, more gradual, impact on retail prices. The first stage of this pass-through of the exchange rate depreciation was clearly evident with large increases in import prices across the docks in both the December and March quarters. Wholesale import prices increased by 1.1 per cent in the March quarter and by 7.7 per cent over the year. Excluding oil prices, which have been declining substantially, the rise over the year was 9 per cent.
The size of this first-stage impact on import prices to date has been somewhat larger in relation to the change in the import-weighted exchange rate than might have been expected from historical comparisons. This seems to reflect a tendency for export prices of the troubled Asian economies to fall by less, in terms of the major world currencies, than the amount of their currency depreciations. That is, exporters have taken the opportunity to increase prices in terms of their domestic currencies. From the point of view of the exporters, this makes sense: they need to rebuild profit margins and do not need to cut prices much in foreign-currency terms to be sufficiently competitive to increase sales. A consequence of this behaviour is that exchange-rate movements of the sharply depreciating Asian currencies are likely to overstate the price reductions available to consumers of their exports.
One factor helping to mitigate the rise in import prices is the absence of any inflationary pressure in the major industrial countries. In most OECD countries, inflation rates have been declining in recent years, to be at levels mainly between 0 and 3 per cent (Table 11). In the United States, as noted earlier, this has reflected a combination of unusually strong productivity growth, lower energy prices and a rising trade-weighted exchange rate. In continental Europe and Japan, the continued presence of surplus capacity has helped to hold down inflation. A consequence of these low inflation rates is that pr ices of internationally traded goods, which tend to rise less quickly than non-traded goods and services prices, have been flat or slightly declining in recent years in terms of the major currencies.
| United Kingdom | 2.6 |
|---|---|
| Denmark | 2.3 |
| Netherlands | 2.3 |
| Norway | 2.3 |
| Finland | 1.9 |
| Spain | 1.8 |
| Italy | 1.7 |
| New Zealand | 1.7 |
| Belgium | 1.5 |
| Australia | 1.5 |
| United States | 1.4 |
| Germany | 1.1 |
| Austria | 1.0 |
| Canada | 0.9 |
| France | 0.8 |
| Sweden | 0.7 |
| Japan(b) | 0.7 |
| Switzerland | 0.0 |
| Average of above countries | 1.5 |
|
(a) Observations for Australia, New Zealand and the UK refer to
underlying consumer prices, consumer prices excluding credit services, and retail prices
excluding mortgage interest respectively. (b) Tokyo consumer price index. |
|
As illustrated in Graph 30, the second stage of pass-through into imported consumer goods is typically quite gradual. Nonetheless, the rise in across-the-docks prices that has already occurred sets the stage for rising import prices at the consumer level in the period ahead, after a lengthy period when these had been falling.
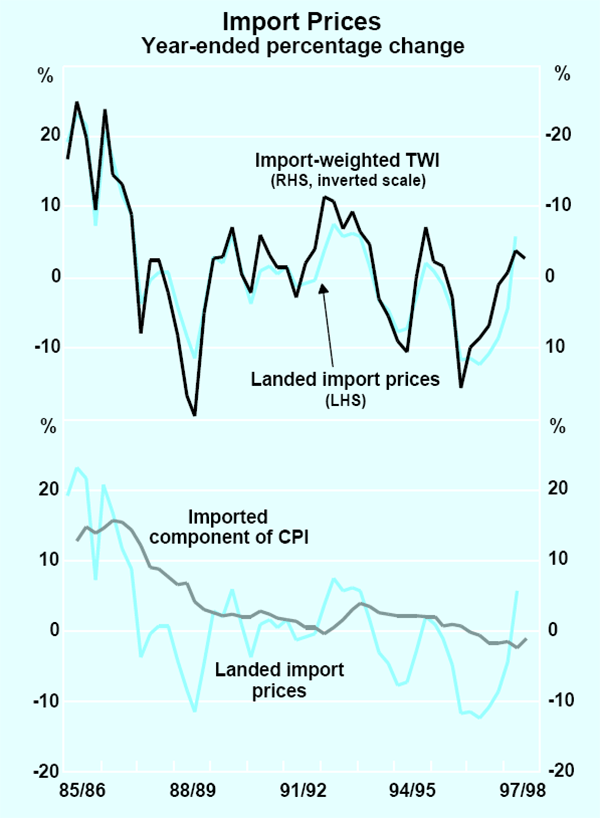
Producer prices generally recorded modest increases in the March quarter, with the exception of raw materials prices which declined, mainly reflecting falls in oil prices (Table 12). The strongest producer-price increases recently have been for house-building materials, which were up by 0.7 per cent in the March quarter and by 2.2 per cent over the year. This has probably reflected stronger demand in the building industry, although increases in non-residential building materials prices have lately tended to ease. The rate of increase in manufacturers' output prices has shown some tendency to drift upward over the past year but, at 1.7 per cent, the annual increase at this stage remains moderate. Some additional upward pressure on manufacturers' prices may come from costs of imported inputs: following the exchange rate depreciation, these are now rising more quickly. Working the other way, lower oil prices, if they are sustained, will reduce production costs.
| March quarter | Year to latest(a) | |
|---|---|---|
| Input prices | ||
| Domestic | ||
| – Raw materials | −3.5 | −2.4 |
| – Intermediate(b) | 0.2 | 2.1 |
| Imported | 0.5 | 3.3 |
| Final manufacturing prices(b) | ||
| Domestic | 0.4 | 1.7 |
| Imported | 2.1 | 9.0 |
| Construction prices | ||
| House-building materials | 0.7 | 2.2 |
| Other building materials | 0.1 | 0.6 |
| Import prices | ||
| Import price index(b) | 1.9 | 8.9 |
| Imported component of CPI(b) | 0.2 | −1.1 |
|
(a) In the year to the March quarter 1998. (b) Excludes petroleum. |
||
Trends in labour costs
Average weekly ordinary-time earnings (AWOTE) increased by 1.3 per cent in the three months to February and by 3.9 per cent over the past year (Graph 31). Both the quarterly and annual figures have fluctuated markedly but, in annual terms, the rate of increase has come down slightly from a rate of 4.3 per cent a year ago, and from a cyclical peak of over 5 per cent. Over the six months to February, the annualised rate of increase was 3.3 per cent.
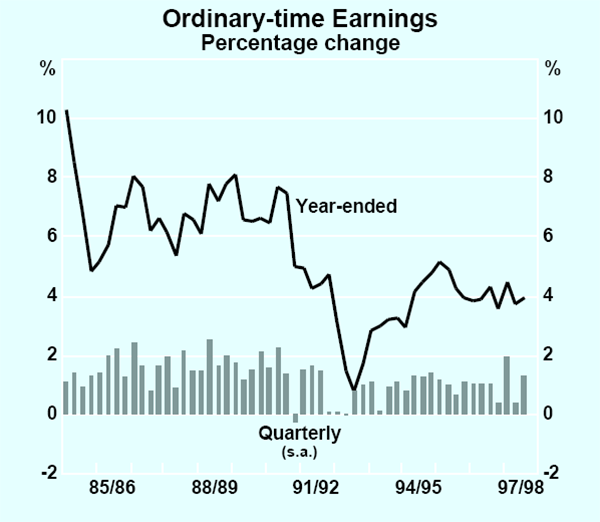
For much of the recent period, the recorded rate of earnings growth has been affected by an apparent divergence between the public and private sectors, with public-sector earnings growing substantially more quickly. This divergence was at its greatest extent a year ago, and has since been largely eliminated by a pronounced slowing in recorded public-sector earnings growth along with a somewhat smaller pick-up in the private sector component. Interpretation of short-run developments in these indicators is hampered by data volatility and by the possible effects of compositional change, particularly in the public-sector workforce. In broad terms, however, the data suggest that both private-sector and economy-wide wages are probably now growing at a bit under 4 per cent.
An alternative reading on the pace of aggregate wage increases will be provided over time by the newly developed wage cost index. This index is designed as a measure of hourly wage rates at the level of individual jobs of a given quality and, in principle, it should be less affected by compositional change or changes in average hours than is the case for measures based on weekly earnings. Some track record of experience will be needed to allow the performance of this index to be assessed. At this stage, only one reading on the aggregate quarterly change is available – an increase of 0.8 per cent in the December quarter – which seems broadly consistent with the earlier conclusion that wages are rising at an annual rate of less than 4 per cent.
Developments in enterprise bargaining suggest an easing in the pace of negotiated wage increases recently. In the December quarter, new federal enterprise agreements yielded average annualised wage increases of 4.1 per cent, down from a prevailing average of around 4½ per cent over much of the past two years (Graph 32). The decline has been most pronounced in the private sector, where new agreements in the December quarter were for average increases of 3.8 per cent, down from a peak of over 5 per cent in 1996. Wage increases in the manufacturing sector have come down noticeably, although they continue to be well above the private-sector average. While the quarterly results for new wage agreements can be affected by the composition of industries in which agreements are being struck, an examination of renegotiated agreements confirms a tendency for the pace of wage increases to ease. Private-sector agreements renegotiated in the December quarter yielded average increases of 3.5 per cent, compared with average increases of 5.1 per cent under the agreements they replaced (Graph 33), and early indications are that this trend towards lower settlements has continued in 1998.
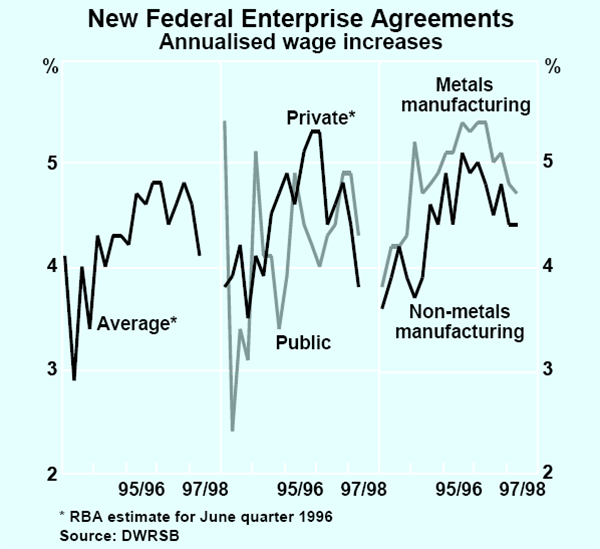
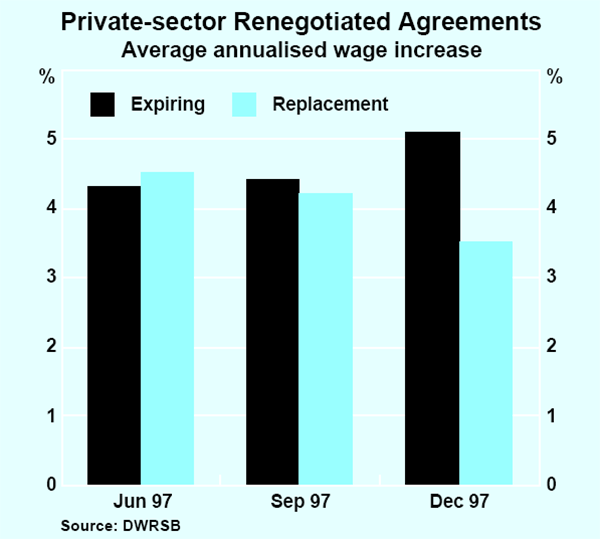
An easing of wage pressures under enterprise bargaining is to be expected given the further declines in inflation and inflation expectations that have taken place, the pressure on corporate profitability, and the continued existence of a degree of slack in the labour market. In addition to these factors, it is possible that there is some re-assessment occurring as to the rate of wage increases that is sustainable in a low-inflation environment. In the initial adjustment to the widespread adoption of enterprise bargaining, wage expectations were unrealistically high, with settlements averaging more than 5 per cent. To the extent that excessive wage increases put pressure on profitability and employment, this may have led participants to lower their expectations, contributing to the lower increases recorded recently under renegotiated agreements.
The outcome of the Safety-Net Review, announced by the Australian Industrial Relations Commission in late April, will determine increases in award wages in the year ahead for employees not covered by enterprise agreements. The Commission awarded a three-tier increase ranging between $10 and $14 a week, depending on income, with the largest increases going to those on the lowest award rates of pay. This represents a slightly larger average increase than was awarded the previous year.
In contrast to indicators of enterprise bargaining outcomes and award wage increases, the growth of executive salaries remains at a high level. Results of the Cullen Egan and Dell survey of executive remuneration suggest that they continue to grow at annual rates of around 6 per cent, about the same rate that has prevailed for the past two years, and do not appear to have been affected by the recent declines in corporate profitability.
Inflation expectations
Most measures of inflation expectations have declined substantially over the past two years, particularly in late 1996 and into 1997. Reduced expectations of inflation probably reflected a wider general recognition of the low-inflation environment in place since the early 1990s, as well as the declines in actual inflation occurring over the recent period. In the past few months, some measures of inflation expectations have moved up a little, possibly reflecting the expected impact of the recent exchange-rate depreciation, but they remain close to historical lows.
Consumers' expectations of annual inflation, as recorded by the Melbourne Institute survey, stood at 3.4 per cent in April, close to the average since the sharp downward movement in this series in the second half of 1996 (Graph 34). In the past few months, expectations have picked up a little from the trough of just under 3 per cent recorded in November 1997. Volatility in the survey is such that it is usually difficult to attribute movements of this size to particular events, but the timing of the recent increase suggests it may have been influenced by the weaker exchange rate. As has been the case throughout the history of the survey, consumers' inflation expectations are recorded as being somewhat higher than actual inflation rates. Survey results broken down by occupational categories point to some significant variations across these groups. Expectations of those broadly classed as professionals have generally been lower over the past two to three years, and have declined more, than those of the population average.
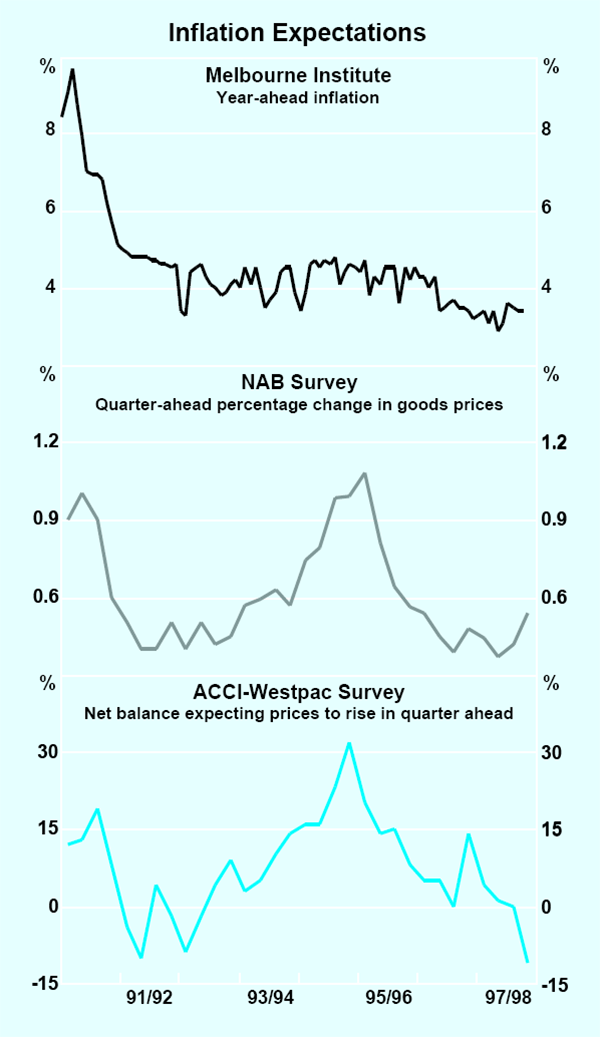
Business surveys of inflation expectations are giving mixed results at present. Firms responding to the NAB survey expect to raise their prices by 0.5 per cent in the June quarter, a slight increase on the previous quarter's expectations. Retail price setters expect to increase prices by 0.4 per cent, the same as for the previous quarter. The ACCI-Westpac survey presents a weaker picture. A sizeable net balance of respondents reported falling selling prices in the March quarter, with a majority also expecting prices to fall in the June quarter. The different patterns across the two surveys may reflect their differences in coverage, with manufacturers covered by the ACCI-Westpac survey possibly having greater exposure to competition from countries whose exchange rates have recently depreciated.
Firms' longer-run inflation expectations have remained steady. According to the NAB survey, a large majority of business respondents continue to expect average inflation over the next 10 years to be below 4 per cent, with the most common expectation in the 3 to 4 per cent range. Long-term expectations implied by financial market prices are considerably lower. As noted earlier, the 10-year inflation expectation implied by yield differentials between indexed and conventional bonds is currently around 2 per cent.
Inflation outlook
Inflation trends in the near term will reflect contrasting influences of domestic factors and developments in import prices. Domestic cost and price pressures, at present, appear well contained. Import prices, however, will deliver a positive impetus to inflation over the next one to two years, as the impact of Australia's recent currency depreciation flows through to consumer prices. Much of the first stage of the impact of the lower exchange rate has already occurred, with across-the-docks import prices rising by 9 per cent over the past year.
These developments in import prices are occurring alongside a steadier trend in domestic costs and prices. In general, these are rising at quite moderate rates. As noted earlier, there have been some signs of a modest slowing in wage costs in some areas, and aggregate wages can be characterised at an economy-wide level as growing at a little under 4 per cent. With trend labour productivity growth of around 1¾ per cent since the start of the current expansion, this rate of increase is consistent with longer-run achievement of the inflation target, although further slowing of wage growth would still be beneficial for employment prospects.
The pace of increases in private-sector service prices has declined over the past two years, although it remains relatively high at 3.2 per cent. The domestically produced goods component of the CPI increased by only 0.6 per cent over the past year, having slowed gradually during the past three years from a peak of around 4 per cent. Falling oil prices have contributed to this decline. To some extent, it also reflects the restraining influence of competition from imported goods: this price discipline will be lessened in the period ahead as import prices rise. Domestic producer-price increases have picked up a bit recently, although the rates of increase remain very low.
Reflecting the impact of rising import prices, the Bank's expectation is that inflation will rise to around 2 per cent by the end of 1998 and to around 2½ per cent by the middle of 1999. Risks exist in both directions around this central forecast. A somewhat higher inflation outcome could be envisaged if the exchange rate were to decline further from its recent levels, or if the exchange rate decline that has already occurred were to generate a pick-up in domestic wage and price increases and higher inflation expectations. This latter risk would be more likely to eventuate in circumstances where the economy was growing more strongly than expected. Somewhat lower inflation might arise in the medium term if the reductions in inflation and inflation expectations over the recent period, coupled with the expected slowing in economic growth, were to lead to a significant step down in the pace of growth in labour costs.
Footnote
The real interest rate on a financial instrument is the nominal interest rate adjusted for the inflation rate expected to prevail over the life of the instrument. For a detailed discussion of real interest rates, see the May 1997 Semi-Annual Statement (Box 4). [1]
Footnotes Box B
Telstra shares are held in trust until payment of the second instalment (around $6 billion) in November 1998. [1]
Footnotes Box D
See Introduction of Chain Volume Measures in the National Accounts, ABS Information Paper Cat. No. 5248.0. [1]
Currently, quantity estimates in the National Accounts are fixed-weight indices. From 1984/85 to the present, for example, nominal expenditure shares in 1989/90 are used when weighting together the different components of output. This implies that from 1989/90 onwards, quantity estimates in the National Accounts are derived from a sequence of Laspeyres indices. An alternative (but equally valid) estimate of the quantity of output over this period could be derived using expenditure shares in the latest period; that is, the quantity of output could be derived from a sequence of Paasche indices. If large relative price and quantity movements occurred over the period, however, these two estimates would diverge. For example, if there was a large relative price fall for one component whose quantity was rising rapidly, growth derived from the Laspeyres indices would overstate the ‘true’ growth taking place in the economy, and growth derived from the Paasche indices would understate it. Moving to annually chained indices should substantially reduce the extent of this divergence, because it will reduce the extent to which relative prices and quantities move within any period in which weights are being held fixed. [2]