Statement on Monetary Policy – February 2006 International Economic Developments
Introduction
The world economy expanded at a solid pace in 2005, as strong growth in the US and China continued. Economic growth firmed in Japan, and activity in the rest of east Asia also picked up, as demand in the global ITC sector began to recover. In addition, after a disappointing performance in recent years, growth in the euro area appears to be strengthening. In line with these developments, the trend towards higher official interest rates has continued, with both the Federal Reserve and European Central Bank (ECB) increasing policy rates in the period since the previous Statement.
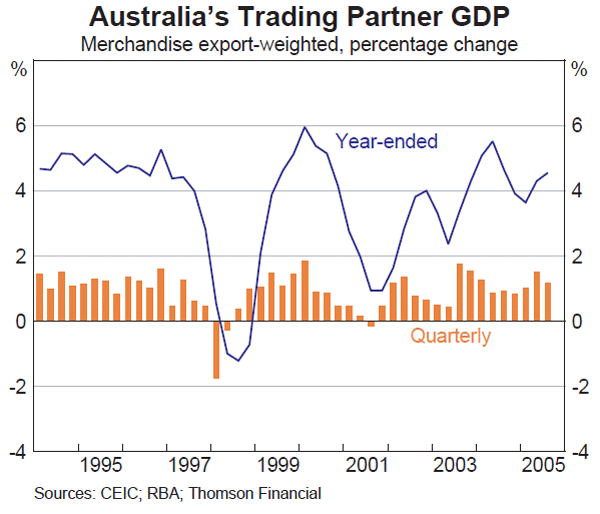
Most economic indicators point to ongoing healthy growth in the world economy, which is now in its fifth year of expansion (Graph 1). Consensus forecasts have been revised up over recent months, with world GDP growth now expected to be at an above-average 4½ per cent in 2006 (Table 1). While health experts suggest that the risk of a bird-flu pandemic has increased, most economic forecasts are not incorporating any impact at this stage.
| 2004 | 2005 Estimate | 2006
Consensus forecasts (January 2006) |
|
|---|---|---|---|
| United States | 4.2 | 3.5 | 3.4 |
| Euro area | 1.8 | 1.4 | 1.9 |
| Japan | 2.3 | 2.5 | 2.2 |
| China | 10.1 | 9.9 | 8.7 |
| Other east Asia(b) | 5.8 | 4.7 | 4.8 |
| India | 7.2 | 7.6 | 7.1 |
| Latin America | 5.7 | 4.3 | 4.1 |
| Emerging Europe | 7.4 | 5.5 | 5.5 |
| World | 5.1 | 4.5 | 4.5 |
| Australia's trading partners(c) | 4.9 | 4.3 | 4.1 |
|
(a) Aggregates weighted by GDP at PPP exchange rates unless otherwise specified Sources: CEIC; Consensus Economics; IMF; RBA; Thomson Financial |
|||
The price of oil remains high, reflecting the interaction of strong global demand and limited spare capacity, as well as concerns over possible shocks to supply. After a brief peak at over US$70 per barrel in September 2005 following the damage to production and refinery infrastructure from hurricanes Katrina and Rita, oil prices eased to below US$60 per barrel in November and December as capacity was gradually restored in the Gulf of Mexico. However, prices have since edged upwards, mostly on concerns about possible disruptions to oil supplies due to heightened tension in the Middle East. Oil traded at around US$65 per barrel in early February. The strength of the world economy has also led to an increase in the prices of other commodities (see discussion in the chapter on ‘Balance of Payments’).
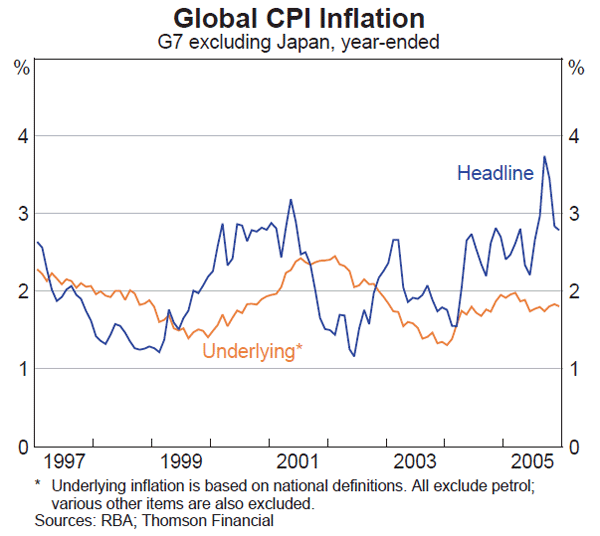
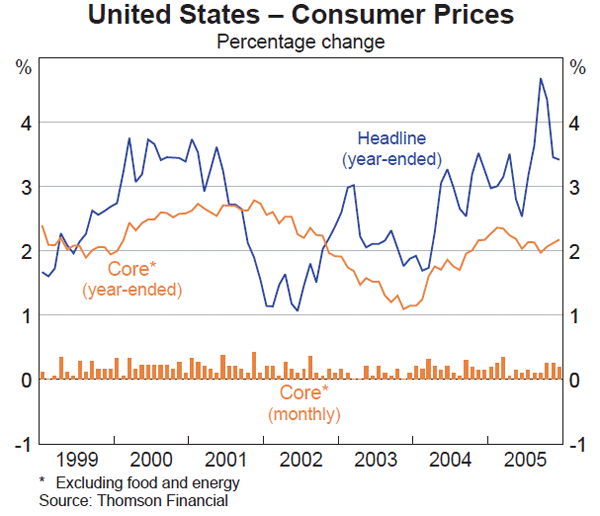
The large increase in oil prices over the past two years has boosted headline inflation in the major economies. Nonetheless, despite these pressures and the reduction in economic slack, measures of core inflation have remained contained in most regions (Graph 2).
United States
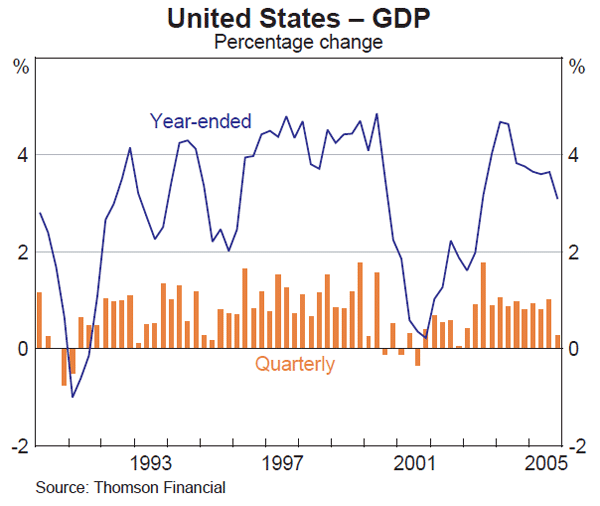
The US economy posted above-trend growth in 2005, with real GDP expanding by 3.5 per cent. The quarterly growth rate dipped to 0.3 per cent in the December quarter (Graph 3). However, recent indicators suggest that the earlier hurricanes and spike in retail petrol prices had little lasting impact on the US economy, and stronger growth is expected to resume in the first half of 2006.
Consumption increased by 0.3 per cent in the December quarter and by 3.0 per cent over the year. The weakness in the quarter was due largely to lower auto sales, which declined by 12 per cent following the ending of various discounting schemes. In contrast, ex-auto spending has been firm and the outlook for consumption remains favourable. Petrol prices have fallen back to pre-hurricane levels, the labour market continues to strengthen, and consumer sentiment has improved. Nonetheless, looking forward, it seems likely that there will be a reduction in the stimulus to consumption that has come from the strong growth in house prices in recent years (for further details see ‘Box A: Developments in the US Housing Market’).
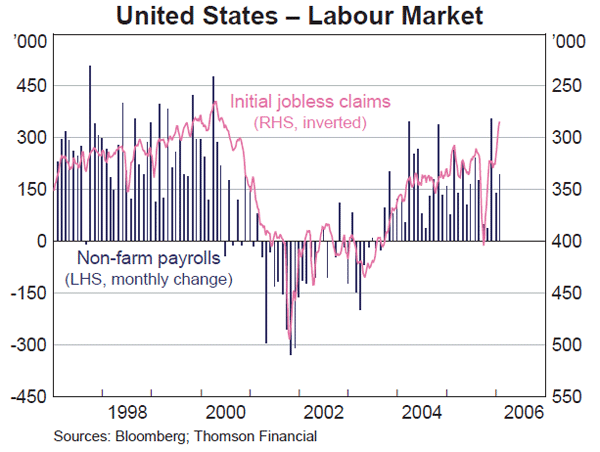
Labour market conditions have strengthened in recent months, as the effects of the hurricanes have dissipated. After increasing by only 85,000 in the two months to October, payrolls employment increased by 690,000 in the three months to January. At 4.7 per cent, the unemployment rate is at a 4½-year low, and average earnings growth is picking up. Forward indicators suggest continued strong employment growth. Initial jobless claims have fallen to below their pre-hurricanes level, and the employment indices from the ISM surveys are above average (Graph 4).
Business investment increased by 6.4 per cent over the year to the December quarter. Although business investment has been growing strongly for the past two years, it is still relatively low as a share of GDP, and financing conditions and healthy profitability remain supportive of further growth. Business sentiment measures are also well above average levels and capital goods orders rose significantly in the December quarter, auguring well for future growth in equipment investment.
Having narrowed slightly to 6.2 per cent of GDP in the September quarter, the US current account deficit is likely to have widened again in the December quarter. Net exports subtracted 0.3 percentage points from real GDP growth in the quarter, and the trade deficit increased to 6.2 per cent of GDP, from 5.8 per cent in the September quarter.
After peaking at 4.7 per cent in September, year-ended headline CPI inflation declined to 3.4 per cent in December, as retail petrol prices fell back following the hurricanes (Graph 5). However, underlying inflation has remained around 2 per cent since mid 2005 according to the core measures of the CPI and chain price index for personal consumption expenditure, and unit labour cost growth was just 1.0 per cent over 2005. At 4.5 per cent, the policy rate now stands closer to neutral levels, although the Federal Reserve's January policy statement signalled that some further tightening may still be needed.
Asia-Pacific
Japan
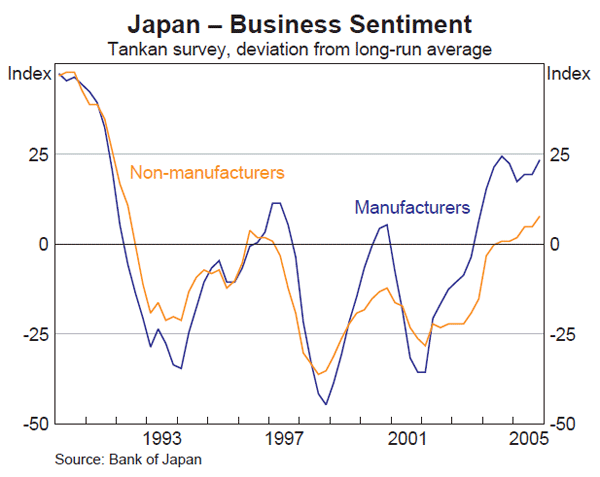
The recovery has continued in the Japanese economy, which is Australia's largest export destination. Year-ended growth in GDP was 2.8 per cent in the September quarter, and has been positive for more than three years. The current upswing has been led by the business sector, which is benefiting from improved balance sheets and stronger domestic and external demand conditions. Investment grew by 8.2 per cent over the year to the September quarter. More timely data show strength in the December quarter in industrial production and machinery orders, and capacity utilisation rates are high in the manufacturing and non-manufacturing sectors. Merchandise export volumes increased by 10 per cent over the year to December, boosted by the global ITC recovery. In addition, business conditions reported in the December quarter Tankan survey were at their highest level in over 10 years, and investment intentions were again revised upwards (Graph 6).
Conditions in the household sector have also improved. Consumption grew by 2 per cent over the year to the September quarter and consumer sentiment is at a high level. Employment growth was a solid 0.5 per cent over 2005, with full-time employment increasing by 1.1 per cent. Forward-looking indicators of employment point to continued hiring by firms; the job offers-to-applicants ratio has increased to its highest level in 13 years, and surveys indicate positive sentiment from both employers and employees.
There is now increasing evidence that the Japanese economy may be emerging from the deflationary environment that has existed for most of the past decade. The strength of the corporate sector has been reflected in strong growth in share prices, including an increase of more than 40 per cent over 2005. The rate of decline in consumer prices has eased, with the official core measure marginally higher over the year to December. In recent months the Bank of Japan has stated that its quantitative easing policy could be terminated in fiscal year 2006, as core inflation is expected to remain positive.
China
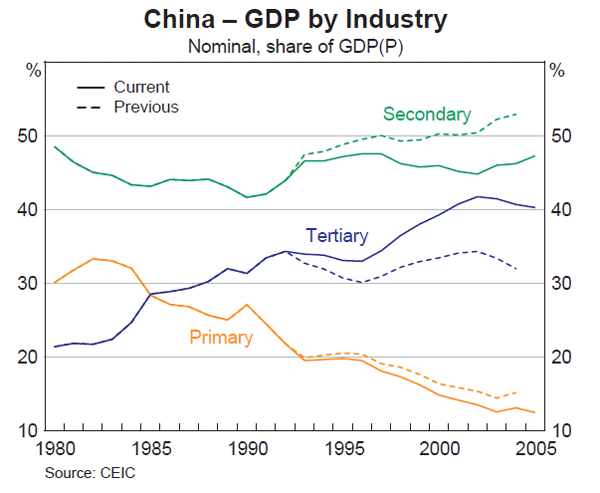
China's real GDP grew by almost 10 per cent in 2005, in line with the growth reported for the previous two years. Following the recent national economic census, there have been significant upward revisions to Chinese national accounts data back to 1993. As a result of improved coverage, the tertiary (or services) sector is now estimated to have accounted for 41 per cent of GDP in 2004, compared with 32 per cent prior to the revisions (Graph 7). The level of nominal GDP in 2004 was revised up by 17 per cent; according to the recent data, China is now the world's fourth-largest economy (at market exchange rates), behind the US, Japan and Germany, and remains the second-largest when measured at purchasing power parity exchange rates. In real terms, the average growth rate since 1992 has been revised up from 9.4 per cent to 9.9 per cent.
The revisions also suggest that the composition of spending is more balanced than it previously appeared, with the investment share of GDP likely to be revised down once full data are released. Nevertheless, the economy remains heavily reliant on investment spending; the investment share of GDP will still be high by international standards, and urban fixed asset investment increased by around 24 per cent over the year to December. By contrast, consumption continues to be constrained by high rates of precautionary saving, and retail sales grew by 12½ per cent through 2005.
The merchandise trade surplus increased from US$32 billion in 2004 to US$102 billion in 2005 (4½ per cent of GDP), although it narrowed somewhat in the December quarter. Annual growth of both imports and exports has been running at around 20 per cent in recent months.
Despite the strong growth in the economy, inflation remains low, with consumer prices rising by 1.6 per cent over the year to December. At the producer level, inflationary pressure has continued to abate; producer prices rose by 3 per cent over 2005, compared with 7 per cent over 2004.
Other Asia-Pacific
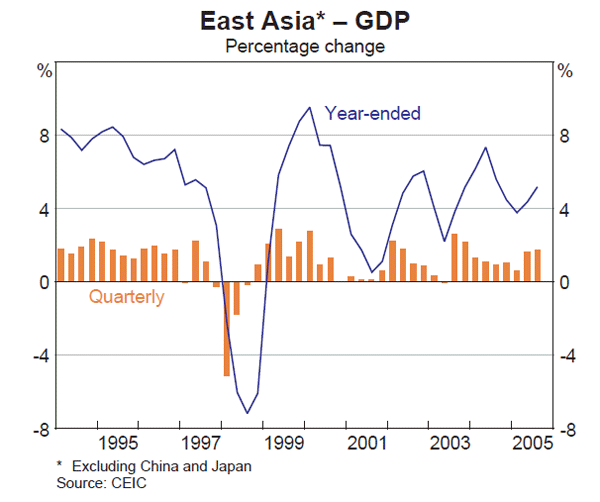
In the rest of east Asia, GDP growth rates have recovered following the slowdown recorded during 2004 and early 2005. GDP increased by 1.8 per cent in the September quarter and by 5.2 per cent over the year (Graph 8). The more ITC-exposed economies in the region are benefiting most from the global ITC recovery, while growth in Hong Kong has also benefited from links with the rest of China. The economic recovery continued in Korea and in Thailand, where agricultural output improved following the end of a drought. Growth was slower in Indonesia and the Philippines. In the December quarter, GDP grew strongly in Korea, the Philippines and Singapore.
Conditions in the business sector remained strong throughout the second half of 2005, as the global ITC recovery took hold. Growth in industrial production in the region has picked up, to be 11 per cent over the year to November. World semiconductor sales increased by 9 per cent over the year to the December quarter, with sales from the non-Japan Asia region continuing to outperform sales from the rest of the world. On the consumption side, retail sales in the region have been supported by improving labour markets, low real interest rates and rising asset prices. In Korea, consumption has improved, with wholesale & retail sales increasing by 5 per cent over the year to December and household credit rising steadily. Increasing confidence in the Korean economy contributed to the 50 per cent increase in Korean share prices over 2005 and to the appreciation in the Korean won exchange rate, which in January reached its highest level in eight years. Demand and inflation pressures have prompted increases in official interest rates across the region.
Strong growth in India has also contributed to the world expansion. GDP grew by 1.8 per cent in the September quarter, to be 7.9 per cent higher over the year, well above India's 30-year average growth rate of 5½ per cent. Domestic demand continues to be the main driver of growth, with activity concentrated in the services and manufacturing industries. Growth in industrial production has been solid, at 7.1 per cent over the year to November, despite some volatility during the year due to coal shortages and flooding. Wholesale price inflation picked up to 4½ per cent by the end of 2005, in part reflecting pass-through from higher global oil prices. At its January meeting, the Reserve Bank of India raised interest rates by 25 basis points to 5.5 per cent, citing favourable growth prospects and upside risks to inflation.
In New Zealand, economic growth has slowed but inflation concerns remain, with consumer prices rising by 0.7 per cent in the December quarter and by 3.2 per cent over the year. Wage growth has been strong, and house price growth has remained rapid, at 13.5 per cent over the year to December. The Reserve Bank of New Zealand increased the official cash rate in both October and December, bringing it to 7.25 per cent, citing concerns about a lack of spare capacity in the economy and associated inflation pressures.
Europe
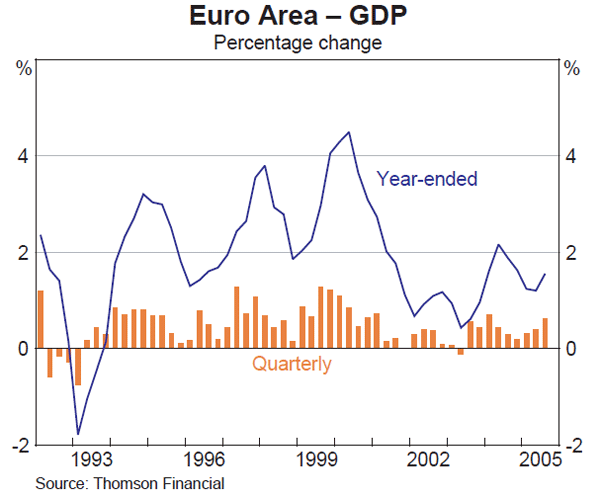
The euro area's prospects brightened in the second half of 2005. Quarterly growth outcomes have gradually strengthened through the year, with GDP growing by 0.6 per cent in the September quarter and year-ended growth picking up to 1.6 per cent (Graph 9). Activity in the September quarter was more broadly based than previously, with both domestic demand and net exports adding to growth. Net exports contributed 0.3 percentage points to growth in the quarter, as exports and imports grew strongly. Across the region, GDP growth picked up in Germany and France and remained healthy in Spain, while growth in Italy slowed to 0.1 per cent over the year.
Stronger external demand and a weaker euro have supported a revival in production and export growth. Led by Germany, industrial production in the euro area grew by 2.5 per cent over the year to November, and export growth picked up, to be 11 per cent over the year to November. The euro area manufacturing PMI has increased, signalling further gains in production, and measures of business sentiment have also improved (Graph 10).
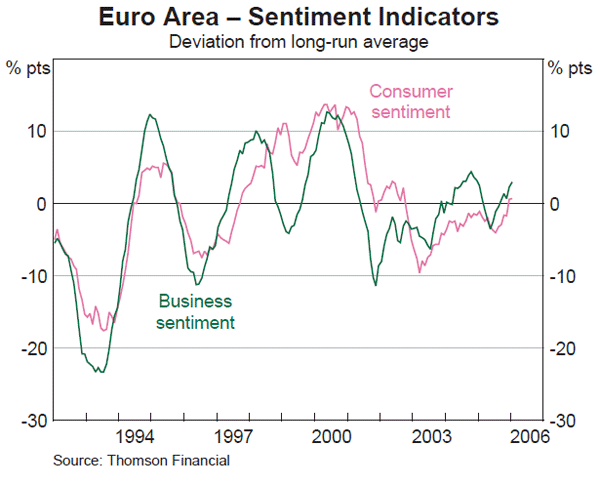
Despite the improvement in the business sector, household consumption has remained subdued. Euro-wide retail sales growth was just 0.7 per cent over the year to December, weighed down by weak wage growth. Nonetheless, the euro area unemployment rate has fallen to 8.4 per cent, from a peak of 8.9 per cent in late 2004, and consumer sentiment has increased to around long-run average levels for the first time in more than three years.
Year-ended headline consumer price inflation was 2.4 per cent in January, compared with its recent peak of 2.6 per cent in September, and underlying inflation has continued to hover around 1¼ per cent. The ECB raised its policy rate to 2.25 per cent at its December meeting, noting that the increased pace of activity could begin to put pressure on inflation and expressing concern about the rapid rate of money supply growth.
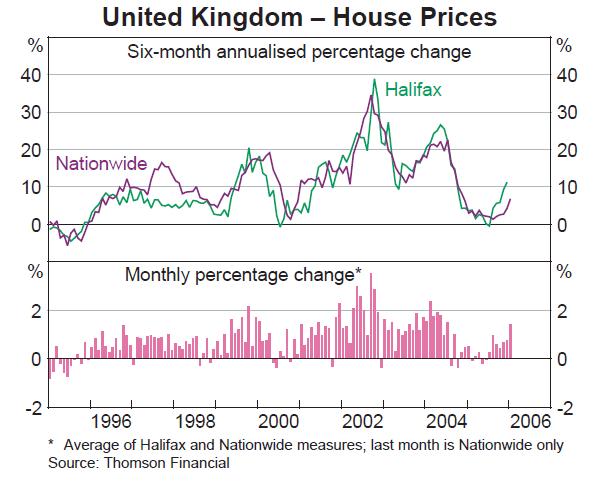
Growth in the UK remains relatively subdued, but appears to have stabilised following the slowing that began in mid 2004. GDP grew by 0.6 per cent in the December quarter and by 1.7 per cent over the year. Strong profitability and increased external demand have supported activity in the business sector, although industrial production has been weighed down by declining oil production and a weak manufacturing sector. There have been signs of stronger conditions in the housing market. House price growth picked up in the second half of 2005 according to the Nationwide and Halifax measures, and housing loan approvals have accelerated (Graph 11). These developments have been associated with a modest recovery in retail sales, which increased by 4 per cent over the year to December. However, inflation pressures remain subdued, with average earnings growth slowing to 3.4 per cent over the year to November and underlying inflation running at 1.2 per cent over the year to December.
