Statement on Monetary Policy – February 2006 Domestic Economic Conditions
Growth in the Australian economy remained moderate in 2005 when compared with the rates recorded a few years ago. GDP is estimated to have increased by 2.6 per cent over the year to the September quarter, with annualised growth of around 3 per cent in the middle two quarters of 2005 (Table 6). Recent quarterly GDP data have indicated a profile of strong growth in business investment, moderate growth in household consumption, modest falls in dwelling investment and a subtraction from GDP growth by net exports, as growth in spending has continued to run ahead of production.
| December qtr 2004 |
March qtr 2005 |
June qtr 2005 |
September qtr 2005 |
Year to Sep qtr 2005 |
|
|---|---|---|---|---|---|
| Domestic final demand | 1.4 | 0.2 | 2.0 | 0.2 | 3.8 |
| Change in inventories(a) | −0.2 | 0.7 | −0.2 | −0.2 | 0.1 |
| GNE | 1.3 | 0.8 | 1.8 | 0.0 | 3.9 |
| Net exports(a) | −0.7 | −0.2 | −0.1 | −0.3 | −1.3 |
| GDP | 0.4 | 0.7 | 1.3 | 0.2 | 2.6 |
| Memo item: | |||||
| Real GDP adjusted for changes in terms of trade |
0.7 | 1.2 | 2.5 | 0.4 | 4.8 |
|
(a) Contributions to GDP growth Source: ABS |
|||||
The outlook for growth remains favourable. The income gains from the strong terms of trade are providing ongoing support to domestic spending, particularly in the regions most exposed to the resources sector. Conditions in the business sector are generally positive, with profitability and capacity utilisation both at high levels. Growth in household consumption is likely to remain relatively modest, as households continue to consolidate their financial positions. Indicators of housing activity continue to suggest that the current downturn in construction activity is proving to be mild by historical standards. Moderation of the growth in domestic demand should result in an easing in imports growth which, when combined with an expected recovery in export volumes, should reduce the drag on growth from net exports. Conditions in the rural sector have improved noticeably, with better weather in the second half of 2005 likely to boost crop and livestock production.
Household sector
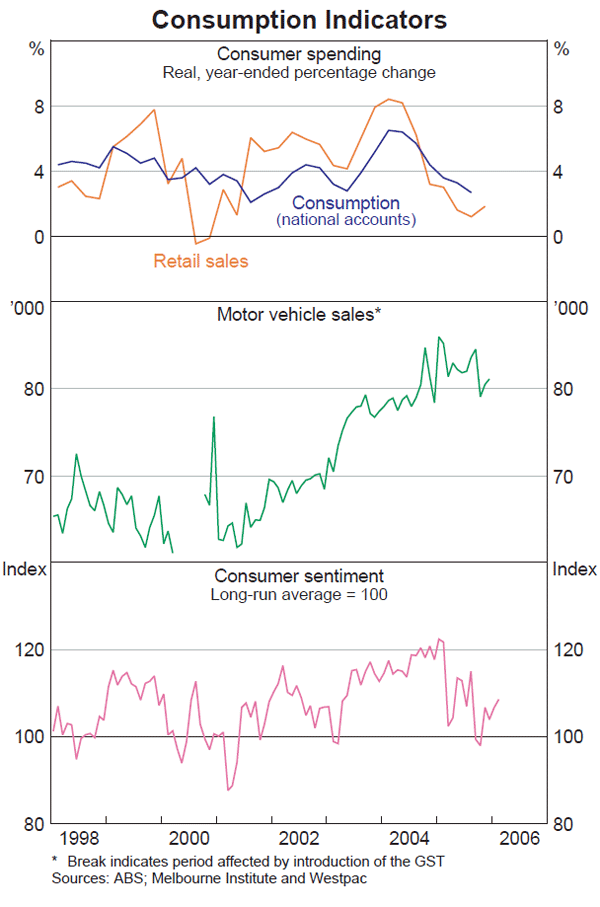
Growth in household consumption slowed during 2005, with real spending increasing by 2.7 per cent over the year to the September quarter, a marked deceleration from an annual growth rate of around 6½ per cent at the start of 2004 (Graph 28). Growth in the September quarter was quite modest, at 0.6 per cent, despite a sizeable boost to household incomes from tax cuts and other measures in the May Budget. Partial indicators of consumption suggest that growth remained relatively subdued in the December quarter: the volume of retail sales increased only slightly in the December quarter and motor vehicle sales fell by 3.8 per cent. Although consumer sentiment, as recorded by the Melbourne Institute survey, has fallen from the levels seen in 2004 and early 2005, it remains above long-run average levels. The recent improvements suggest that the effect of higher petrol prices on sentiment has been fairly transitory.
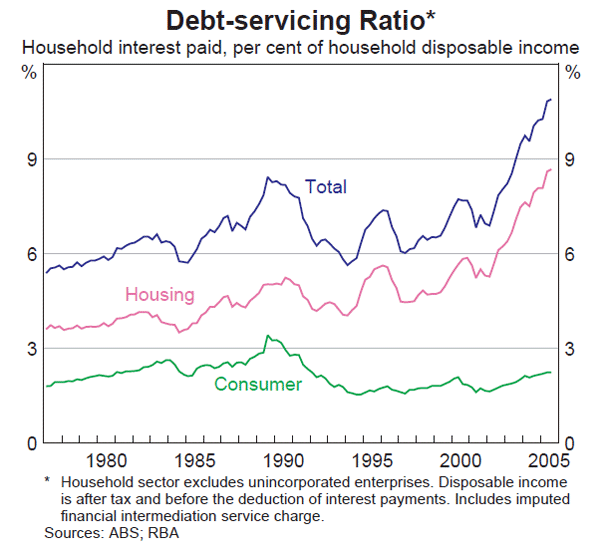
Moderate consumption growth, combined with strong growth in disposable income, led to a further rise in the household saving rate in the September quarter, bringing the estimated total increase since the end of 2004 to 2¼ percentage points. Although the saving rate as measured is still negative, the fact that consumption is now growing more slowly than income suggests that households are taking a more cautious approach to their finances. This would be consistent with the further easing in growth in household debt in the September quarter. Nevertheless, the debt-servicing ratio increased marginally in the quarter, to 10.9 per cent (Graph 29). Following revisions to the data, the debt-servicing burden is now well above previous peaks. Although there is still little sign of household financial distress in the loan arrears data, the rising interest burden may be one reason for the moderation in consumption growth.
Housing
Construction
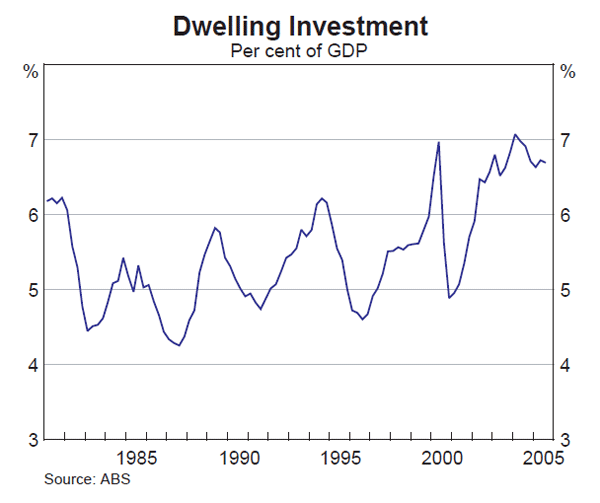
The housing construction downturn continued in 2005, with dwelling investment falling modestly in the September quarter, but still remaining fairly high as a percentage of GDP (Graph 30). Dwelling investment has fallen by around 4 per cent from its early 2004 peak, with the decline fairly evenly spread between the two main components, construction of new dwellings and alterations & additions. The recent weakness was driven largely by developments in New South Wales; dwelling investment remains high in most other states.
Forward-looking indicators remain consistent with the current downturn in dwelling construction activity being mild by the standards of previous cycles. Building approvals were broadly flat in the December quarter, following a sharp fall in the September quarter. The large amount of work remaining in the pipeline will help to support dwelling construction activity in the near term. Looking further ahead, builders responding to the latest Master Builders Association construction survey are becoming more optimistic about prospects for demand over the next six months.
Financing and prices
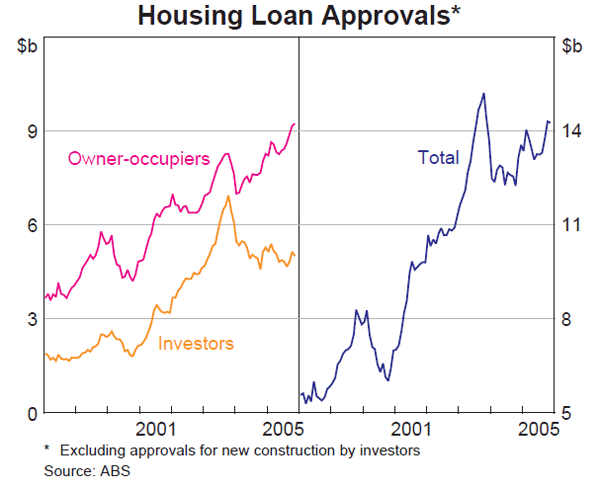
The value of housing loan approvals increased by around 6 per cent in the three months to November, and by 11.5 per cent over the year, to be around its highest level since the end of 2003. Recent growth has mostly been driven by an increase in loan approvals to owner-occupiers, although loan approvals to investors have retraced some of their previous falls (Graph 31). The value of loan approvals for investors increased by around 4½ per cent in the three months to November, but is still around 25 per cent below its peak in late 2003. In most states, incentives offered by state governments combined with recent increases in housing affordability have attracted re-entry of first-home buyers, and their share of total loan approvals has increased accordingly.
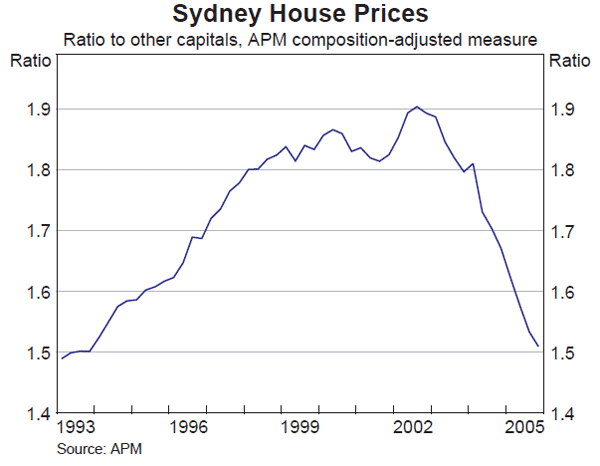
Following a period of rapid growth in previous years, average nationwide house prices have been relatively stable on most measures since the end of 2003. In the December quarter, both the APM composition-adjusted measure of nationwide house prices and the repeat-sales data from Residex rose by around 1 per cent. The APM measure suggested a similar increase over the year to the December quarter, while the Residex repeat-sales data suggested a somewhat stronger outcome over this period (Table 7). Average price changes in the major capitals over 2005 were all relatively small, with the exception of Perth which again recorded strong growth. Prices appear to have fallen in Sydney for the second year. The price falls that have occurred in Sydney, together with stable or increasing prices in other capitals, have brought price relativities between Sydney and the other capitals back to the pre-boom levels of the early to mid 1990s (Graph 32).
| APM | REIA | Residex | ABS | ||||||||
|---|---|---|---|---|---|---|---|---|---|---|---|
| Dec qtr 2004 |
Dec qtr 2005 |
Dec qtr 2004 |
Dec qtr 2005 |
Dec qtr 2004 |
Dec qtr 2005 |
Dec qtr 2004 |
Sep qtr 2005(a) |
||||
| Sydney | −3.3 | −5.1 | 0.0 | −3.5(a) | −3.5 | −1.0 | −4.7 | −5.2 | |||
| Melbourne | 0.6 | 2.0 | −4.3 | 1.4 | 4.5 | 4.2 | 0.4 | −1.3 | |||
| Brisbane | 4.4 | 2.6 | 4.7 | −0.6(a) | 4.9 | 3.5 | 3.4 | 1.5 | |||
| Adelaide | 7.1 | 2.1 | 10.7 | 0.0 | – | – | 6.9 | 2.3 | |||
| Perth | 12.1 | 18.7 | 11.3 | 12.0(a) | 14.2 | 15.3 | 13.2 | 12.5 | |||
| Canberra | −0.9 | 2.3 | 0.0 | 5.1 | −1.7 | 5.2 | −1.4 | 0.8 | |||
| Australia | 0.9 | 0.8 | 0.9 | −1.2(a) | 3.1(b) | 4.2(b) | 0.2 | −0.7 | |||
|
(a) Three quarters to September quarter 2005 Sources: ABS; APM; RBA; REIA and state REIs; Residex |
|||||||||||
With ongoing growth in household incomes but little change in nationwide average prices over the past two years, there has been some reduction in house price-income ratios from the extremely high levels of late 2003. There is likewise some evidence of unwinding of previous overvaluations in price-rent ratios, with data from the CPI and the REIA both recording increases in rents over the same period. REIA data also show that the nationwide vacancy rate fell to 2.5 per cent in the September quarter from 3.3 per cent a year earlier, with vacancy rates lowest in Adelaide, Canberra and Perth.
Business sector
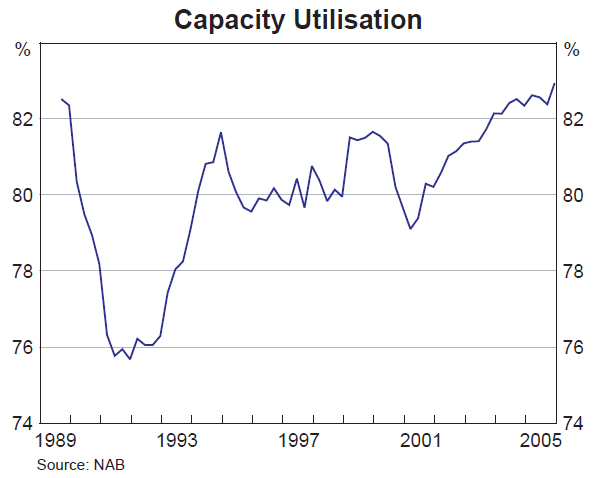
Business conditions generally continue to be favourable, as evidenced by strong growth in profits and investment. Most business surveys indicate that conditions in late 2005 were at or above long-run average levels, although somewhat below the very high levels recorded in 2004 (Graph 33). The NAB survey reported that business conditions remained healthy in the December quarter at well above long-run average levels, and that capacity utilisation reached a new historical peak (Graph 34). The ACIL Tasman/ACCI Survey of Investor Confidence also reported buoyant business conditions and high levels of investment intentions. The November Sensis survey similarly suggested that actual business conditions of small and medium-sized firms improved, to be back around long-run average levels. Consistent with business surveys, capacity constraints continue to be reported in liaison with firms in most industries. However, they appear to have eased in the residential construction industry, in line with the maturation of the housing cycle, and in parts of manufacturing where trading conditions have been difficult.
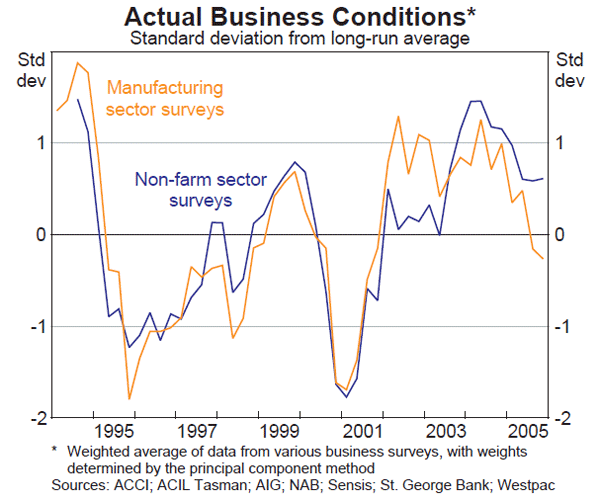
Throughout 2005, the business surveys and liaison reports indicated that conditions remained less positive in the manufacturing sector than for the rest of the economy, due to increasing competition from China and other emerging economies, as well as the housing construction downturn. In the December quarter, the ACCI-Westpac survey reported that actual business conditions in the manufacturing sector improved marginally and remained a little above their long-run average level. However, the AIG's Survey of Manufacturing and its Performance of Manufacturing Index (PMI) both suggested that activity in this sector weakened further in the December quarter, although the PMI has recovered somewhat in the past two months.
Prospects for farm output are looking more favourable, following a pronounced improvement in seasonal conditions over the second half of 2005. Mild spring temperatures and timely rainfall resulted in a national winter grains harvest well in excess of the average crop over the previous five years. Greater availability of irrigation water will also support higher yields for most summer crops, particularly rice and sorghum. The outlook is similarly positive for livestock producers, with farmers taking advantage of the more favourable weather conditions to rebuild herds depleted by record slaughter rates earlier in the year.
Buoyed by high capacity utilisation and favourable funding conditions, real business investment continues to expand at a strong pace, increasing by 2.5 per cent in the September quarter and by 18 per cent over the year. All major components of investment recorded rapid rates of growth, with machinery & equipment and non-residential building investment both expanding by close to 20 per cent over the year, while engineering construction increased by around 30 per cent; spending on intangible fixed assets such as software recorded growth of around 10 per cent. Capital spending growth also continues to be relatively broad-based across industries (for more details, see ‘Box C: Recent Trends in Business Investment’).
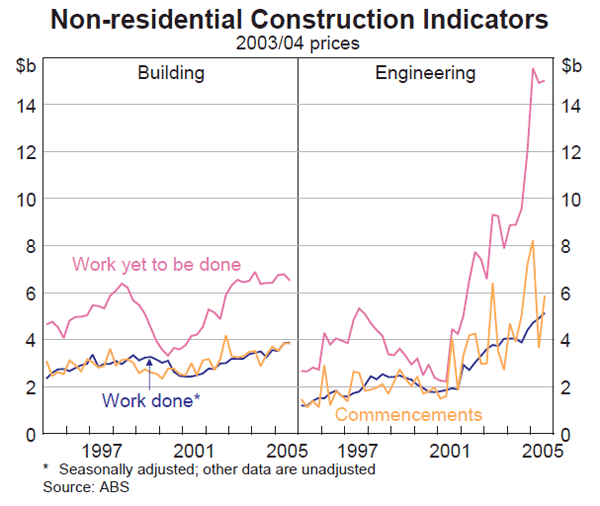
The outlook for business investment remains bright, with solid profitability and a positive external financing environment ensuring that firms have ample access to funds for expanding capacity. Forward-looking indicators of non-residential construction suggest continued growth from the current high level of activity over coming quarters, following its sharp upswing over the past year (Graph 35). Engineering construction activity is expected to be supported by the large amount of resource-related and road construction work underway, including the recently commenced $1.5 billion Enfield oil project in Western Australia. The prospect of further growth in non-residential building has also improved in recent months, with the volume of work approved running above the current high level of construction work done. In addition, investment intentions in the latest capital expenditure (Capex) survey suggest a healthy rise in real machinery & equipment investment in 2005/06, driven by increased spending in the manufacturing, finance & insurance and transport & storage industries. Similarly, the latest Rabobank survey suggests that investment intentions for farm equipment (which are not covered in the Capex survey) remain elevated and are close to their pre-drought levels.
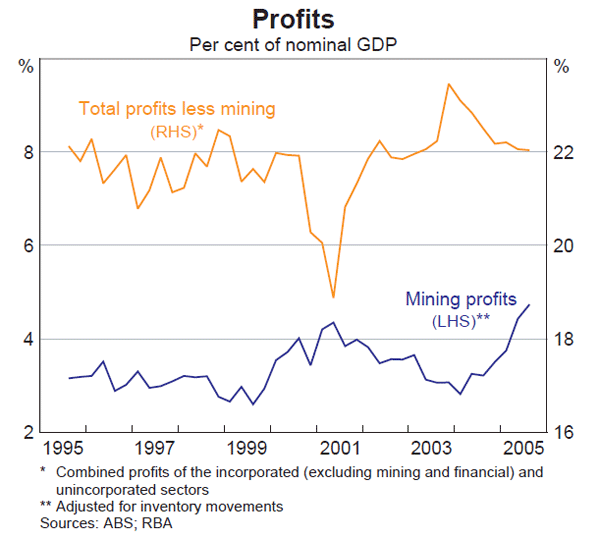
Corporate profitability maintained its momentum through 2005, with the gross operating surplus of private non-financial corporations increasing by 2.6 per cent in the September quarter, to be 18 per cent higher over the year. Although profit growth continues to be driven by the mining sector, non-mining profits have also grown solidly in the past two quarters and are at reasonably healthy levels by historical standards (Graph 36). While growth in mining profits is expected to ease, and faster wage growth is likely to place upward pressure on costs, forward indicators such as the NAB survey's actual and expected profitability series suggest that profitability should remain solid in the near term.
Australian Government Budget
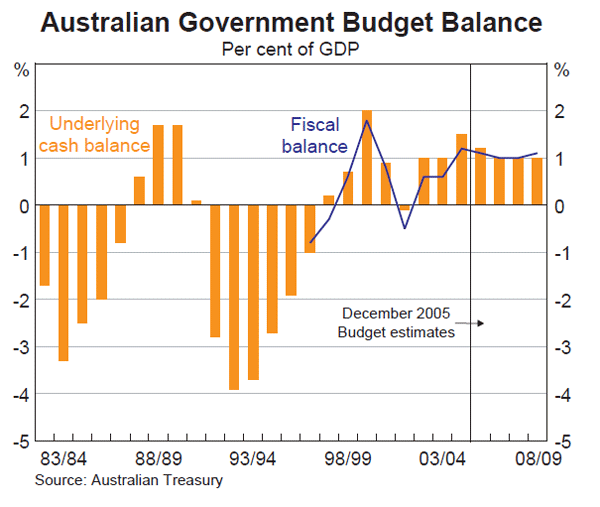
The Mid-Year Economic and Fiscal Outlook (MYEFO) for 2005/06, released in December, showed an increase in the forecast budget surplus from that expected in the May Budget (Graph 37). This upward revision mainly reflects an increase in estimated income taxation revenue, resulting from greater than expected increases in corporate profits and employment, and a larger dividend from Telstra. These effects significantly outweighed the estimated increase in spending flowing from new policy measures announced since the Budget.
Labour market
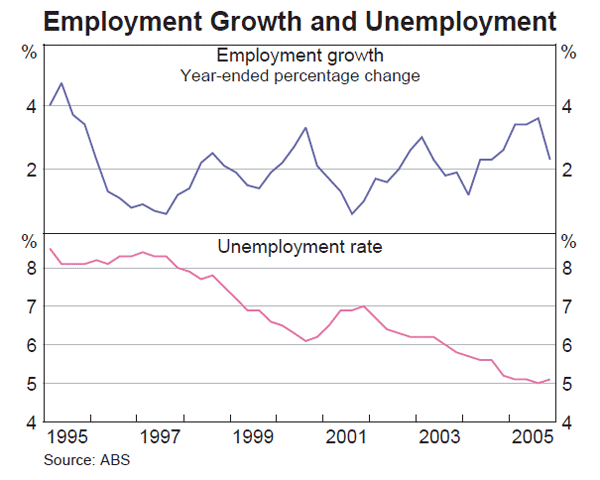
Most labour market indicators point to some cooling in recent months. However, this appears to be mostly a return towards normal conditions following the extremely strong conditions registered around a year ago (Graph 38). Total employment grew by 1.6 per cent over the year to January, with part-time employment increasing by 0.6 per cent and full-time employment by 2.0 per cent. Total employment is estimated to have grown by a modest 0.3 per cent over the three months to January. This represents a significant slowing from the peak annual rate of total employment growth of around 4 per cent seen in mid 2005. However, the strength at that time was a little puzzling given the more subdued growth of output, so some slowing in measured employment growth is not surprising. The participation rate remained high at 64.4 per cent in January, while the unemployment rate has stopped falling, and has remained around 5–5¼ per cent for some time.
Labour market outcomes have been broadly consistent with the pattern of output performance across industries and states (Table 8). Over the year to the December quarter, employment growth was strongest – at around 30 per cent – in the mining industry, while the largest fall was in wholesale trade. More generally, employment growth was strong in both the business and household services sectors, while employment fell in the rural and government sectors. Reflecting the strength in mining employment, annual employment growth was particularly strong in Western Australia, highlighting the effects of the stimulus to activity stemming from the strong terms of trade.
| Employment growth | Unemployment rate | ||||
|---|---|---|---|---|---|
| Three months to January 2006 |
Year-ended January 2006 |
January 2005 | January 2006 | ||
| NSW | 0.4 | 1.1 | 5.1 | 5.7 | |
| Victoria | −0.4 | 0.7 | 5.5 | 5.4 | |
| Queensland | −0.1 | 1.8 | 4.8 | 5.3 | |
| WA | 0.9 | 4.4 | 4.7 | 4.0 | |
| SA | 0.4 | 1.8 | 5.7 | 5.0 | |
| Tasmania | 2.1 | 4.8 | 5.6 | 6.7 | |
| Australia | 0.3 | 1.6 | 5.1 | 5.3 | |
|
Source: ABS |
|||||
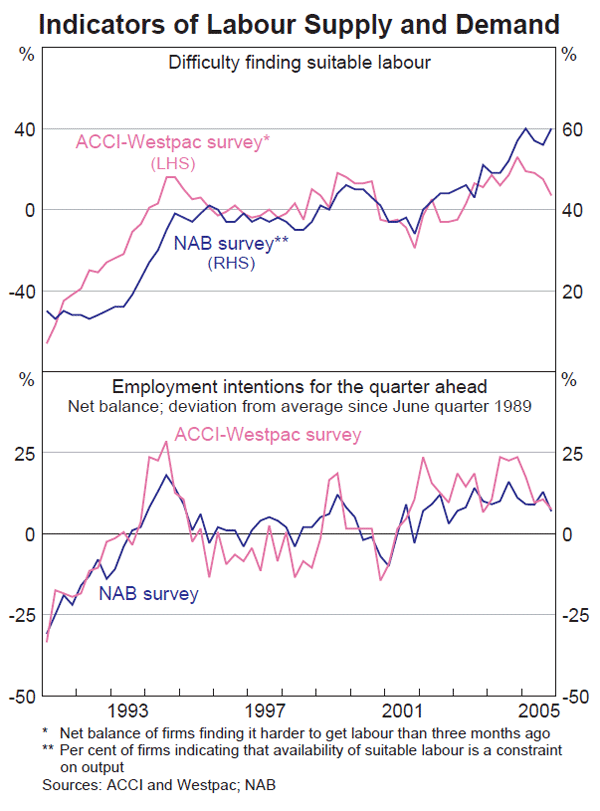
Looking ahead, surveys point to further growth in employment. The ABS measure of job vacancies fell in the December quarter for the third consecutive quarter, but it remains at high levels following extremely strong growth in 2004. The ACCI-Westpac and NAB surveys also suggest some modest easing in firms' hiring intentions, although they are still above their long-run averages (Graph 39). The Bank's liaison program indicates the existence of ongoing broad-based labour shortages, which are most pronounced among skilled workers in the non-residential construction and resources sectors, and in much of the business services sector. Both business surveys and liaison indicate that firms continue to face difficulty attracting suitable labour.
