Statement on Monetary Policy – November 2018 Box B: Indicators of Labour Demand
Bank staff monitor a range of indicators to assess conditions in the labour market. Some of these indicators contain information about the demand for workers, and therefore can inform forecasts for employment growth in the near term.[1] These indicators include:
- Job vacancies: estimates the number of vacant positions in the economy that are ready to be filled, based on a quarterly survey by the ABS
- Job advertisements: counts the number of job advertisements on recruitment websites and in newspapers. Separate indicators are published monthly by ANZ and the Department of Jobs and Small Business; they have slightly different coverage
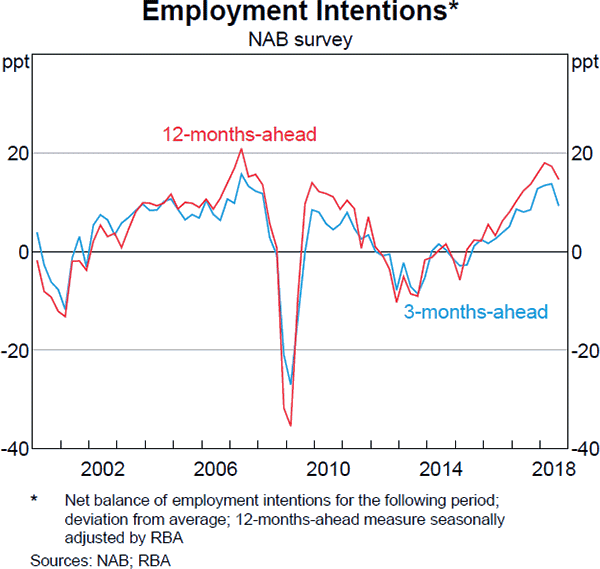
- Employment intentions: the net balance of firms expecting to increase employment over both the next 3 and 12 months, based on the NAB business survey.
These indicators of labour demand should capture changes in labour market conditions before the official ABS employment data. For example, a firm will typically have a vacancy and engage in recruitment activities, such as advertising jobs, before hiring new employees. Also, firms might be expected to reduce recruitment activities before retrenching existing employees in a downturn.[2]
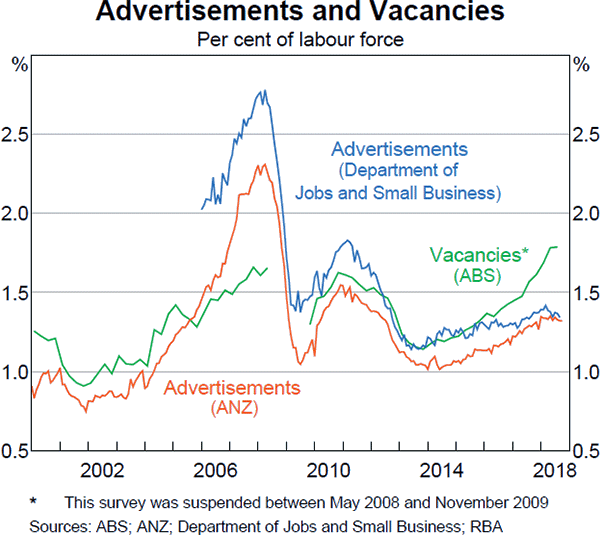
The Bank often presents advertisements and vacancies as a share of the labour force (Graph B1). This helps to make these indicators more comparable over time by adjusting for growth in the size of the labour market. In considering the implications of these indicators for employment growth, Bank staff examine both the level and the growth in advertisements and vacancies. Statistical analysis shows a stronger correlation of changes in advertisements and vacancies with future employment growth.[3] Examining changes can also reduce the impact of any structural changes that may have affected the relative levels of these indicators caused, for instance, by differences in coverage.
Over the past few years, each of the indicators has pointed to an increase in labour demand (Graph B1 and Graph B2). However, the number of job vacancies – and, to some degree, employment intentions – has increased more than job advertisements. It is common for the signal from these indicators to diverge for brief periods, but it is less common for differences to persist.


The slower growth in job advertisements recently (relative to job vacancies) may reflect differences in coverage. Neither of the job advertisement indicators are designed to represent the population of advertisements: they count advertisements on some websites and major newspapers, but have not captured new entrants into the recruitment market over recent years or any increase in the use of corporate websites for recruitment. In contrast, job vacancies should capture vacant positions regardless of which recruitment approach is taken, as the ABS surveys businesses about their vacancies directly. The relationship between vacancies and advertisements is further complicated because there is not always a one-to-one relationship between a job and an advertisement; there can be single advertisements for multiple jobs and multiple advertisements for a single job. Firms can also use ‘expression of interest’ databases.
Notwithstanding the differences, each of these indicators of labour demand has a relationship with future employment growth; the highest correlations are typically one or two quarters ahead. However, the strength of these correlations has varied over time, declining after 2012, but picking up again since 2016.[4] In addition, there has been no single ‘best’ indicator of near-term employment growth because the indicator with the highest correlation with employment growth has changed over time.
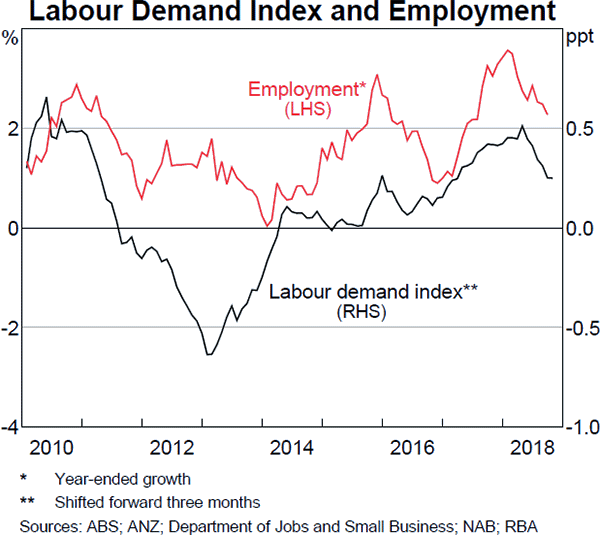
As an adjunct to monitoring each of these indicators separately, they can be combined into a single measure, or ‘Labour Demand Index’ (LDI), using statistical techniques (Graph B3).[5] A positive LDI points to above-average employment growth over the next one or two quarters, while a negative LDI points to below-average employment growth. Analysis by Bank staff has found that the forecast accuracy for near-term employment growth is improved by using the LDI, compared with using any one of its component indicators. However, to understand movements in the LDI, it remains important to monitor and understand each of the component indicators.

On balance, the LDI and its component indicators point to above-average employment growth over the next quarter or two. This is consistent with recent above-trend GDP growth and our expectation that it will continue to be above trend over the near term.
Footnotes
For a comprehensive summary of these data, see Edwards K and L Gustafsson (2013), ‘Indicators of Labour Demand’ RBA Bulletin, September, pp 1–12. [1]
For a discussion of the lags between GDP growth and growth in labour market variables, see RBA (2014), ‘Box B: Lags from Activity to the Labour Market’, Statement on Monetary Policy, May, pp 39–41. [2]
This is discussed in Edwards K and L Gustafsson (2013), ‘Indicators of Labour Demand’ RBA Bulletin, September, pp 1–12. [3]
Based on five-year rolling correlations between quarterly employment growth and the one-quarter lag of: growth in job vacancies; growth in job advertisements; and the level of employment intentions (net balance). [4]
The LDI is a statistically filtered index that aggregates information from the component indicators (which all differ in frequency and timeliness). The Bank has previously used the same method to construct estimates of Australian GDP, see Rees D, D Lancaster and R Finlay (2014), ‘A State-space Approach to Australian GDP Measurement’, RBA Research Discussion Paper No 2014-12. [5]