Statement on Monetary Policy – May 2018 1. The International Environment
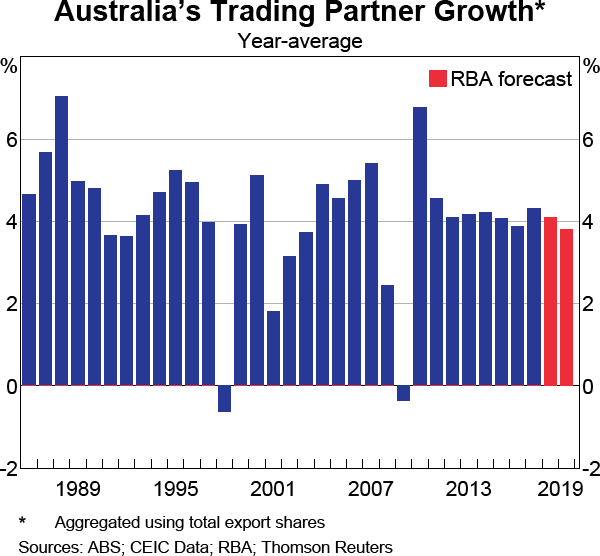
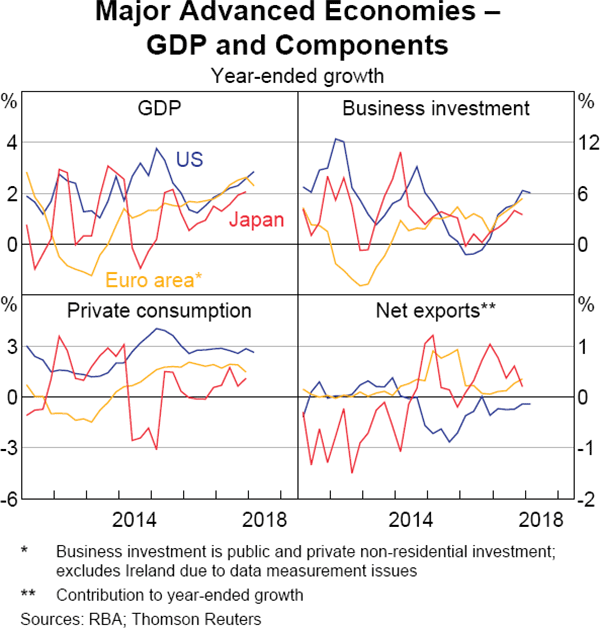
Global economic conditions were relatively strong in early 2018 and the drivers of growth have become more broad based. The higher rates of growth for the major trading partners are expected to continue over the next couple of years; growth in the major advanced economies is expected to continue to exceed estimates of potential over this period (Graph 1.1). While global inflation remains low at present, these stronger economic conditions should see a further reduction in spare capacity and a gradual upward trend in inflation. In response, several advanced economy central banks are in the process of gradually reducing very accommodative monetary policies. More broadly, financial conditions have tightened modestly in recent months, most notably in US dollar money markets. Nonetheless, financial conditions remain accommodative and continue to support global economic growth. In the United States, growth will also be boosted by a substantial fiscal stimulus.
Growth in China has eased a little recently. Over the medium term, growth is expected to moderate gradually for structural reasons, including the declining working-age population and the authorities' objective of achieving a more sustainable mix of growth. Although Chinese steel demand has held up a bit better in the short term than many observers expected, over time it is still likely to decline. Together with increased supply from low-cost producers, this is likely to weigh on bulk commodity prices, and thus Australia's terms of trade, over coming years.
Global growth has strengthened and the outlook is more positive
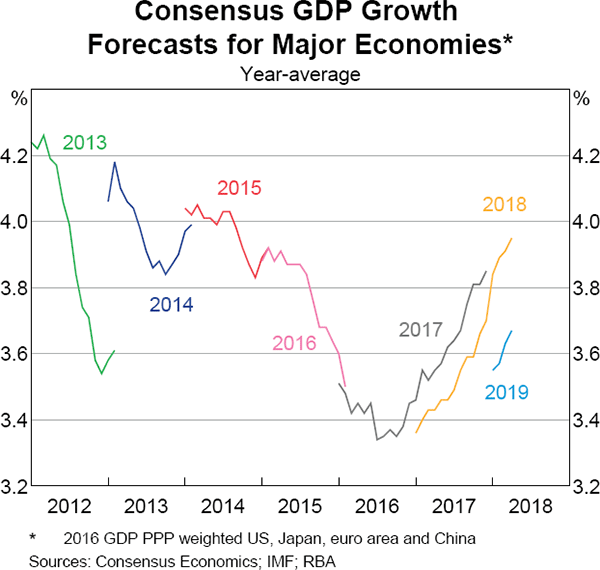
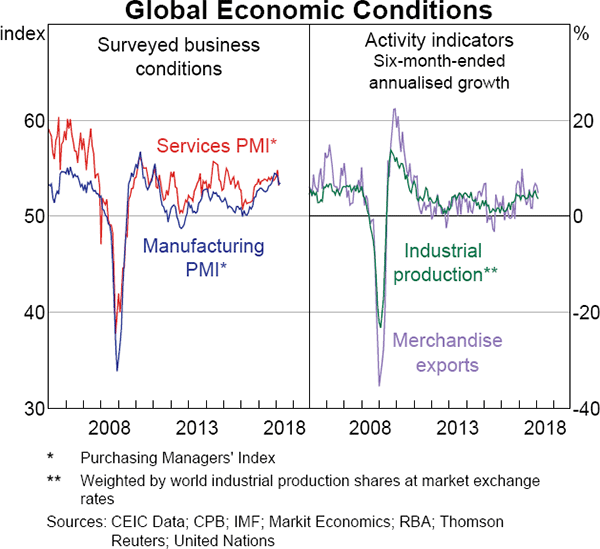
Global economic conditions have improved over the past two years and growth forecasts for the major economies have been revised higher (Graph 1.2). Growth has also shifted from being driven primarily by consumption to being more broadly based. In particular, business investment has recovered, especially in some of the major advanced economies, and stronger global demand has supported growth in trade. While some activity indicators have eased a bit recently, they remain around multi-year highs (Graph 1.3).
The forecast for growth in Australia's major trading partners is largely unchanged from the February Statement. Growth is expected to remain strong in 2018, although slightly below its 2017 pace, and to slow a little further in 2019. Growth in China and the rest of east Asia (excluding Japan) is expected to moderate from its strong 2017 rate. Growth in the euro area and Japan is also expected to ease from current strong rates, but to remain above trend growth. In contrast, US growth is expected to be boosted by fiscal policy.
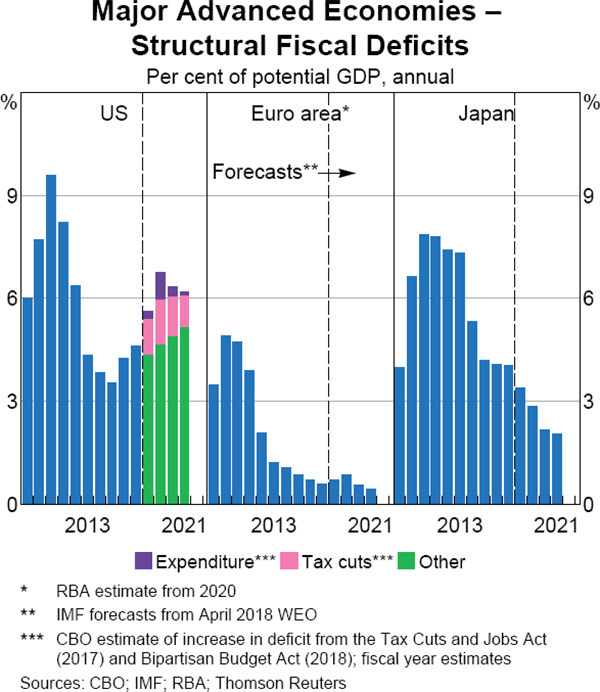
In the major advanced economies, monetary policies remain accommodative, although some of this stimulus is likely to be withdrawn in some economies. In the United States, tax cuts and increased government spending are expected to significantly boost private and public expenditure over the next couple of years (Graph 1.4). In Japan, the scheduled consumption tax increase will tighten fiscal policy noticeably in 2019.
Growth in China is likely to moderate slightly in line with the recently announced growth target for 2018; the Chinese authorities have also signalled some tolerance for a gradual slowing in growth in order to give more weight to other policy objectives, such as reducing pollution and managing financial stability risks.
In east Asia (excluding China and Japan), recent indicators suggest that the slowing in growth at the end of 2017 was temporary; indicators of business conditions remain elevated, new export orders point to export growth remaining relatively high at least in the short term, consumer confidence is high and retail sales growth has strengthened. Growth is therefore expected to be around trend for the next couple of years. In India, the authorities' efforts to address high levels of non-performing loans in the banking system, including the revised recapitalisation plan for state-owned banks over the next two years, are expected to provide support to private investment by increasing credit supply. However, high corporate indebtedness and excess capacity in parts of the industrial sector may start to weigh on credit demand.
A number of uncertainties surround the outlook for the global economy. There is a risk that an escalation in protectionist measures or geopolitical events could harm global growth (see ‘Box A: Recent Trade Protectionism Measures’). In China, the pace of growth in financing has declined, but debt levels remain high and continue to pose downside risks to growth over the medium term. It is also possible that further strong growth in the major advanced economies could lead to a larger increase in inflation than expected, and result in a sharp tightening in global financial conditions. These risks are discussed in more detail in the ‘Economic Outlook’ chapter.
There is limited spare capacity in the major advanced economies
GDP in the major advanced economies has grown faster than estimates of potential growth over the past few years. The US economy has been expanding for nearly a decade and Japan has recorded a long sequence of consecutive quarters of positive growth (Graph 1.5). Growth in the euro area has picked up to its highest rate on a sustained basis since the global financial crisis and, over the past year, it has broadened across the member countries.
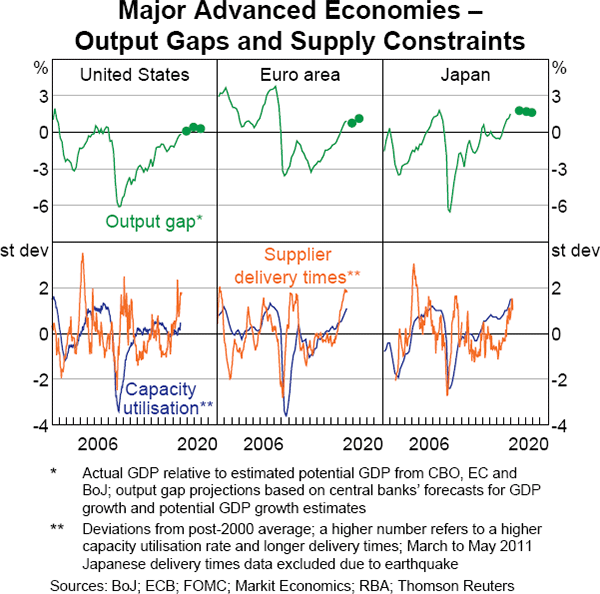
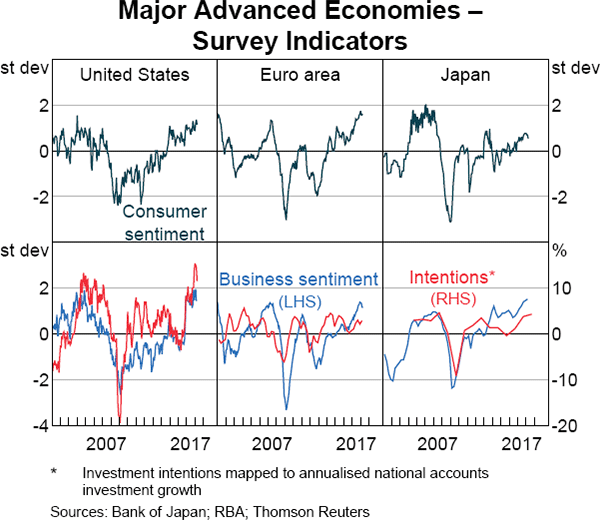
As the recovery has continued, spare capacity in the major advanced economies has been absorbed: output gaps are now estimated to have closed or turned positive (Graph 1.6). Together with other measures, such as capacity utilisation and supplier delivery times, this suggests that capacity constraints are increasing. Business confidence has improved markedly since mid 2016, and business investment growth has picked up strongly. Investment intentions in the United States are especially elevated, in part due to the recent corporate tax cuts (Graph 1.7). Japanese investment intentions are high and point to further strong investment growth, while surveyed business conditions in the euro area are around multi-year highs, although they have declined recently. Although some indicators suggest that consumption growth slowed temporarily early this year, consumption growth continues to underpin domestic demand in the major advanced economies, supported by strong employment growth, above-average consumer confidence and rising asset prices.
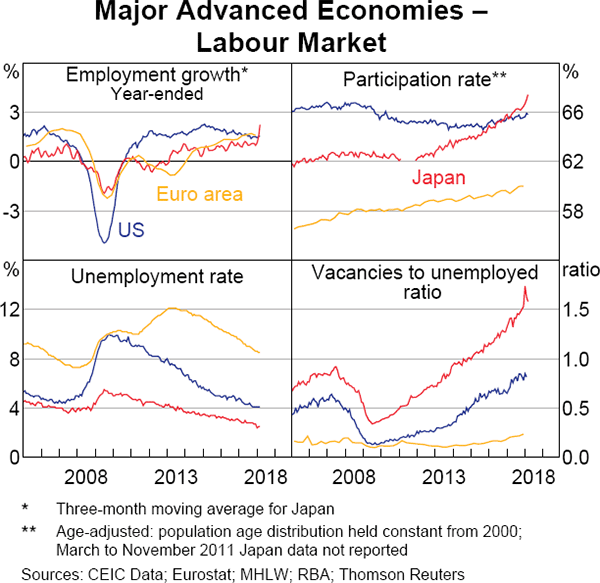
Labour markets have tightened further in the major advanced economies. Employment has grown strongly and unemployment rates have declined to be below estimates consistent with full employment; unemployment rates are at multi-decade lows in a number of advanced economies (Graph 1.8). Measures of underemployment have also been declining and job vacancies have increased strongly in the United States and Japan (where they are around record highs). Firms are reporting that they are finding it more difficult to fill jobs. There are also growing reports of companies offering better employment conditions to attract workers. For example, some Japanese companies are switching employees from temporary or short-term contracts to full-time contracts, which provide more job security and employee benefits. In some advanced economies, the effects of stronger demand for labour on wages have been somewhat mitigated by an increase in labour force participation, which has occurred despite the drag from population ageing. The increase in age-adjusted participation rates has been very strong in Japan since 2012, driven by higher female participation.
Inflation remains low, but is expected to rise
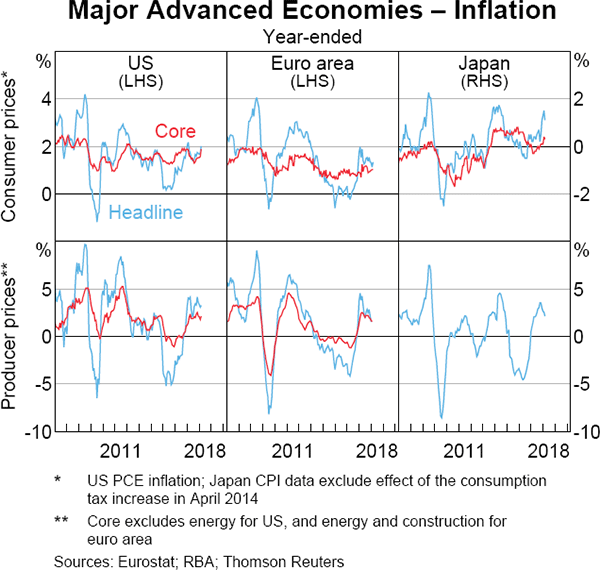
Although inflation generally remains low, increasing capacity pressures in product and labour markets are expected to add to inflationary pressures. There has been some increase in consumer price inflation in the United States and Japan in recent months but core inflation has been little changed in the euro area (Graph 1.9). Producer price inflation has picked up over the past year or so and is running around its highest rate since 2012.
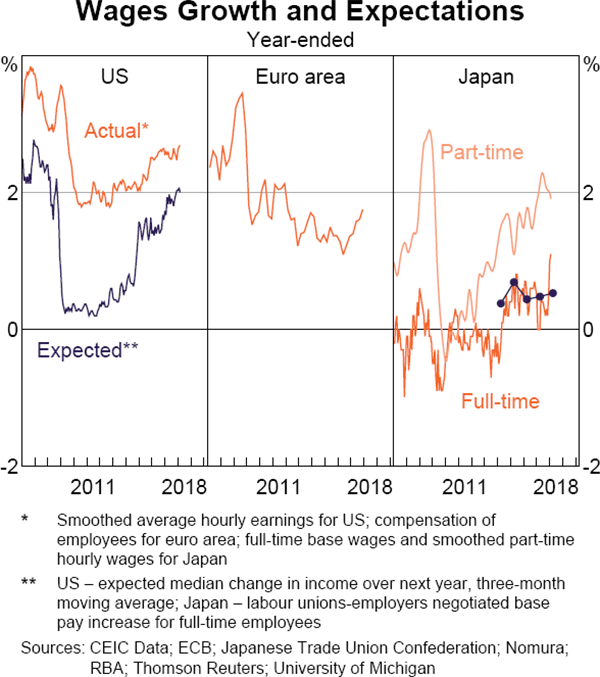
Nominal wages growth has also increased a little in the major advanced economies (Graph 1.10). This has been most apparent in the United States. In Japan, hourly wages growth for part-time jobs has increased steadily since 2010 and there have been signs of full-time wages growth picking up in recent months. Wages growth in the euro area has increased over the past year, and the pickup has been broad based across the member economies.
The upward trend in wages growth is expected to continue. US consumers expect their income growth to increase and more US firms expect to raise wages. In Japan, the results from the annual negotiations between labour unions and employers point to a pick-up in full-time wages growth to above the rate of the past couple of years. Some recent German wage negotiations have also resulted in stronger outcomes. Inflation expectations from both financial markets and consumers have increased since mid 2017 in all three economies.
Some monetary policy stimulus is being withdrawn as a result
Several advanced economy central banks are in the process of gradually withdrawing monetary stimulus in response to strong economic conditions, declining spare capacity and expectations that inflation will rise.
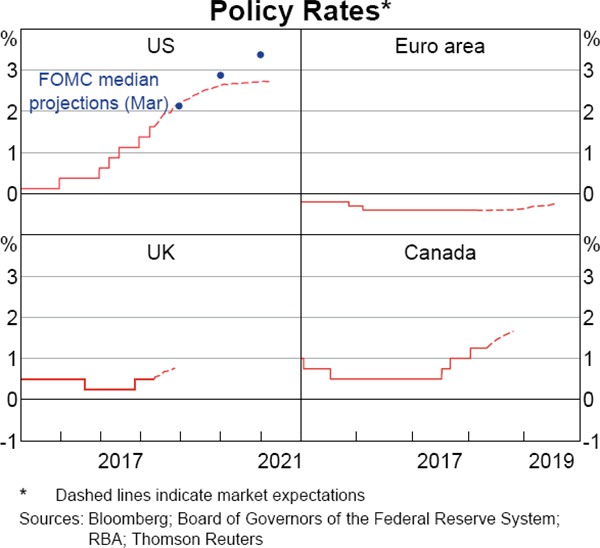
The US Federal Reserve has been proceeding along a path of removing policy accommodation for a time (Graph 1.11). It has been gradually raising its policy rate, most recently in March, when it increased its policy range by a further 25 basis points to 1.50–1.75 per cent. The Federal Open Market Committee (FOMC) anticipates that it will continue to raise its policy rate gradually over the coming years to a level that implies some contractionary pressures on growth and inflation. Market participants expect a somewhat slower pace of tightening than that projected by the FOMC. Elsewhere, the Bank of Canada and Bank of England (BoE) have both raised their policy rates in recent months, and flagged that further increases are likely to be needed.
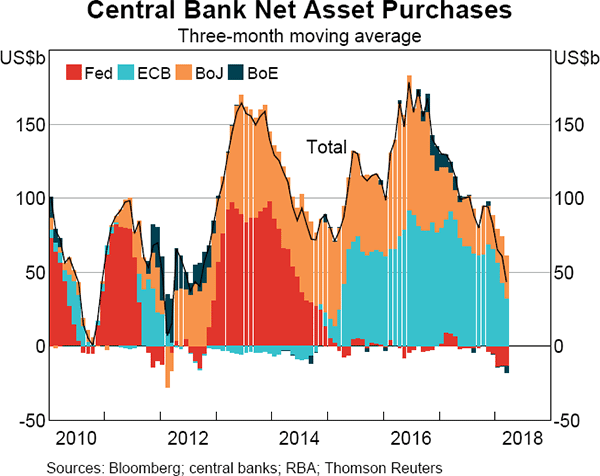
A number of advanced economy central banks have adjusted their asset purchase programs (Graph 1.12). In total, net asset purchases by these central banks are now substantially below their levels of a year ago and appear likely to decline further this year on the basis of central bank guidance and market estimates. The US Federal Reserve has already begun to reduce its holdings of US Treasuries and mortgage-backed securities. The European Central Bank (ECB) halved its pace of purchases in January and market analysts generally expect it to make further reductions later this year. The Bank of Japan (BoJ) continues to purchase government bonds to maintain the yield on the 10-year bond at around zero per cent under its policy of ‘yield curve control’. However, since that policy was introduced in late 2016, the volume of purchases needed to achieve this target has declined noticeably.
Elsewhere, central bank policy remains broadly accommodative, and recent policy moves have been mixed. In several large emerging market countries, including Russia, Brazil and South Africa, central banks have continued to reduce policy rates in response to low growth and an easing of inflation pressures. Conversely, a number of other central banks, particularly in Asia, have indicated that they are at or near the end of their easing cycles. A few central banks, such as those of Mexico, South Korea and Malaysia, have recently raised their policy rates in response to inflation pressures and the recovery in global growth.
Financial conditions have tightened a little, but still remain accommodative
Financial conditions have tightened modestly along a few dimensions in recent months. In particular, interest rates in US dollar money markets have increased, equity prices have declined and spreads on corporate and emerging market bonds have risen a little. Volatility in equity markets has increased to more normal levels from the very low levels that prevailed in recent years. Nonetheless, financial conditions remain accommodative and continue to support global economic growth.
In recent months, there has been a noticeable increase in the cost of borrowing US dollars at short terms (Graph 1.13). Interest rates have risen for US Treasury bills, unsecured borrowing between banks (LIBOR), commercial paper issued by banks and corporations, and borrowings secured by high-quality collateral.
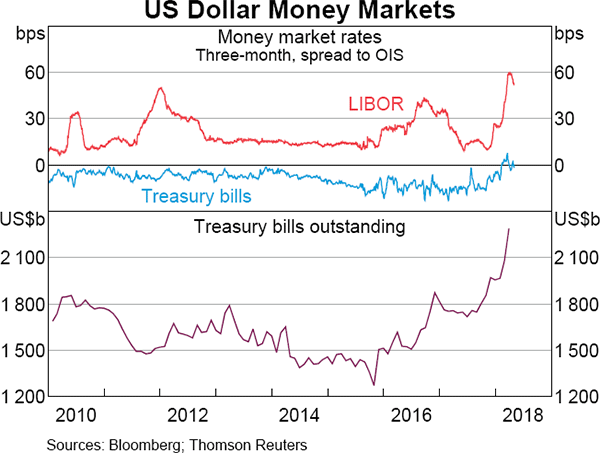
These increases have been greater than the rises in money market rates that have resulted from increases in the US monetary policy rate. The rises in money market rates (relative to the overnight indexed swaps (OIS) rate) appear to reflect a number of factors:
- Borrowing by the US Treasury, in the form of Treasury bills, increased significantly in the early part of this year as it rebuilt its cash balance following the suspension of the debt ceiling in February.
- Demand for money market instruments from a few very large US corporations with substantial offshore cash surpluses appears to have declined. This follows the removal of the repatriation tax (and the levying of a one-off tax on all earnings held offshore), which has led corporations to begin employing these funds for other purposes, including corporate financing activities and investment.
- Tax measures in the United States that seek to discourage profit shifting appear to have encouraged the US subsidiaries and branches of foreign banks to borrow in onshore US money markets, rather than directly from their parents.
More generally, prices in these markets have become more sensitive to changes in supply and demand in recent years, reflecting greater market segmentation. This is, in part, related to enhanced regulation, bank balance sheet constraints and a greater focus on risk management by market participants. As a result, the ability of investors to quickly take advantage of pricing dislocations across different financial markets has become more restricted.
There is uncertainty about how long these pressures in money markets are likely to persist and to what extent. Some aspects of these influences are likely to be temporary, while others reflect more enduring changes in money markets.
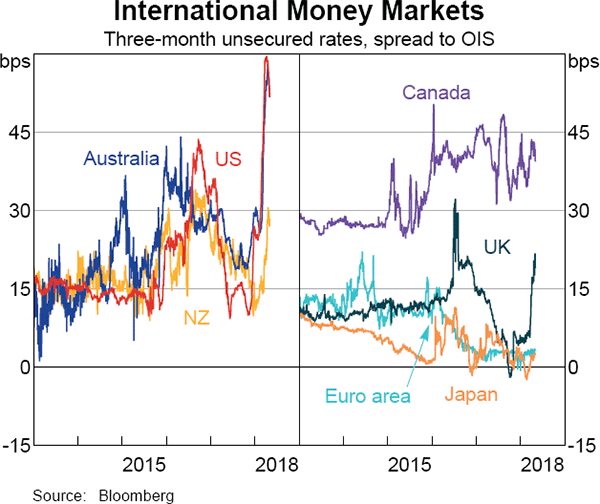
The developments in US dollar money markets have had a noticeable knock-on effect on Australian money market rates (Graph 1.14). In part, this is because Australian banks raise a portion of their funding in US markets to finance their domestic assets. So they have responded to higher US rates by seeking to borrow more in domestic markets, which has place upward pressure on rates in Australia (see ‘Domestic Financial Conditions’ chapter). Similar effects, although less pronounced, can be seen on rates in the United Kingdom and New Zealand. By contrast, banks in the euro area and Japan tend to raise funds in US dollar markets in order to fund US dollar assets, and so have less scope to substitute into domestic funding sources.
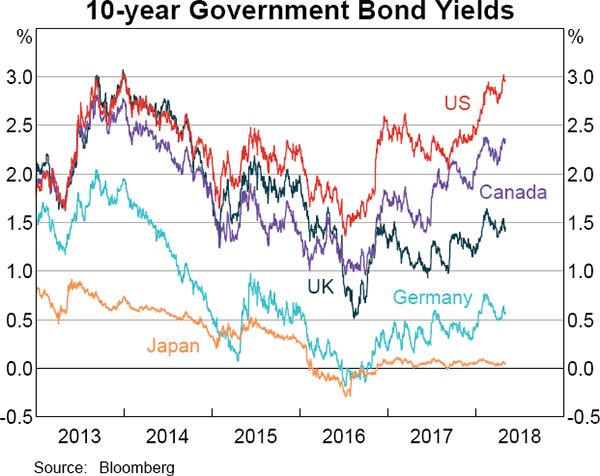
Long-term government bond yields in advanced economies are near their highest levels for several years, although these are still low historically (Graph 1.15). The increases follow a period in which global growth picked up and market participants' expectations for inflation, and correspondingly for central bank policy rates, increased. Expectations of higher government bond issuance in the United States following recent fiscal measures has also contributed to the rise in yields this year.
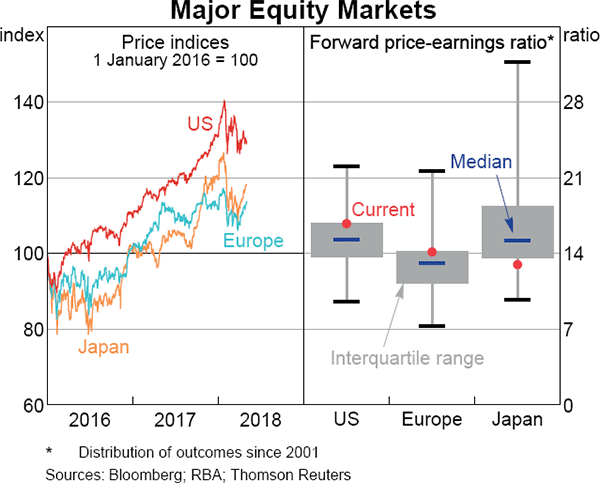
Equity prices in advanced economies have declined from their peaks reached in late January (Graph 1.16). In early February, stronger-than-expected inflation data led to concerns that the withdrawal of monetary policy accommodation may accelerate; this precipitated a considerable decline in many equity markets. More recently, developments in global trade policy have been associated with swings in sentiment in equity markets, reflecting their sensitivity to the outlook for global trade and growth. Despite these developments, equity prices remain above the levels of a year ago, partly because recent earnings results have been positive. Forward-looking valuation metrics in most markets remain around their long-term averages.
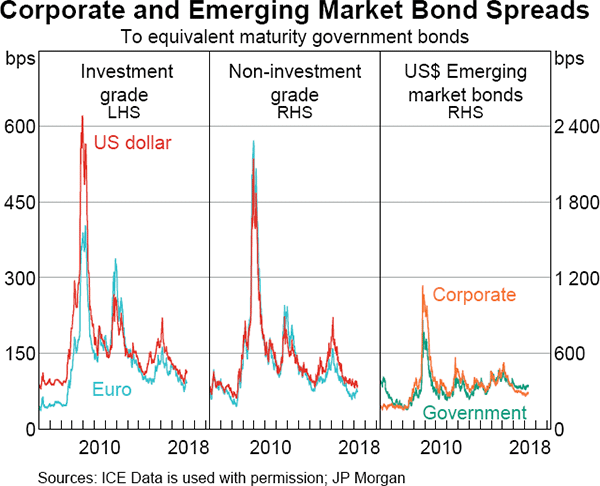
Credit spreads on advanced economy and emerging market corporate bonds have widened over recent months, although they remain close to their narrowest levels since the financial crisis (Graph 1.17). As well as growing concerns around global trade policy, a decline in demand for shorter-dated corporate bonds by other cash-rich corporations has put some upward pressure on spreads. Consistent with this, the widening has been most pronounced for shorter-dated corporate bonds.
Volatility has increased in equity markets, but less so in other asset classes
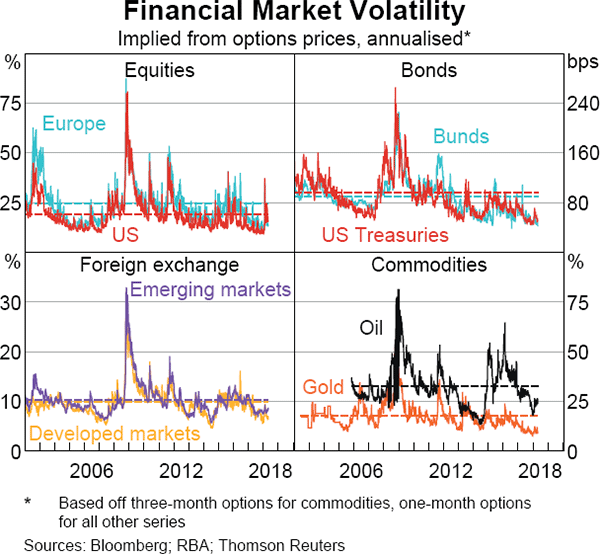
The decline in equity prices has been accompanied by a rise in equity market volatility to historically normal levels, after a prolonged period during which volatility was unusually low (Graph 1.18). In contrast, volatility of other financial market prices remains relatively muted compared with history. This may reflect perceptions that trade tensions will more directly affect equity markets, rather than other asset markets.
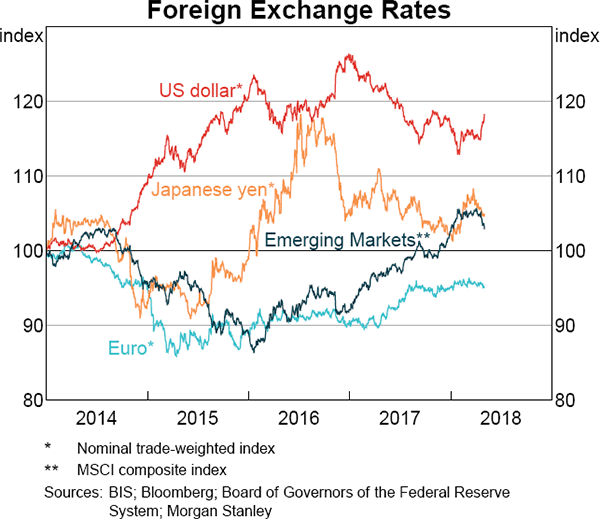
There have been moderate movements in foreign exchange markets over recent months (Graph 1.19). The US dollar has appreciated against most currencies, alongside a widening of the differential between the yields on US government bonds and those in other advanced economies.
The currencies of commodity-exporting countries and of those that are highly integrated in global trade networks, including many emerging economies, were little changed following the increase in trade tensions.
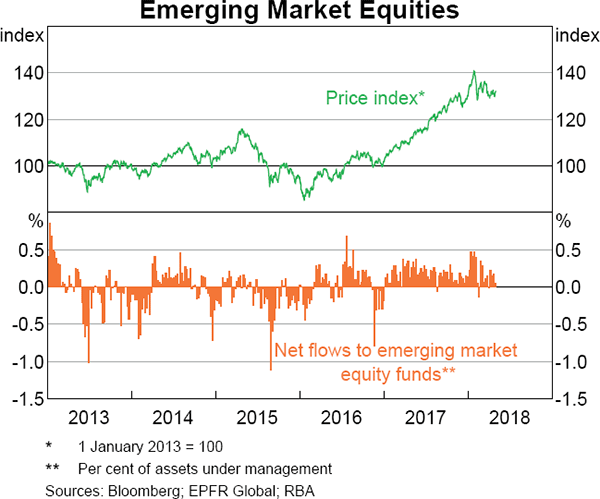
Along with emerging market bonds, emerging market equity prices have, to date, generally been resilient to the modest tightening in global financial conditions and the rise in equity market volatility in advanced economies (Graph 1.20). This appears to reflect improved growth prospects for emerging markets and a reduction in the perceived vulnerability of these economies to financial market shocks. As a result, demand for emerging market equities has generally remained robust, as evidenced by emerging market equity funds continuing to experience consistent inflows.
Chinese growth has eased
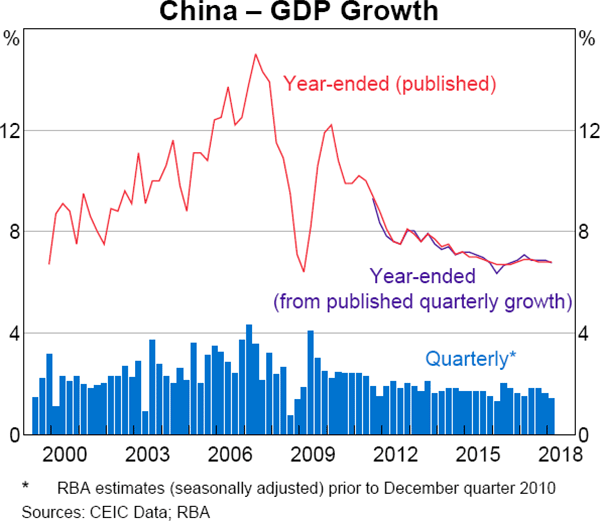
Growth in China was strong through 2017, although it has eased a little in recent quarters, consistent with the authorities' objective of more sustainable growth (Graph 1.21). In March, the Chinese Government announced a GDP growth target of ‘around 6.5 per cent’ for 2018. The new target suggests some tolerance for a gradual slowing in growth from the published rate of growth in 2017 of 6.9 per cent and should give the authorities some scope to increase the weight given to other policy objectives, including their top priorities for 2018 of reducing risks in the financial system, alleviating poverty and dealing with pollution.
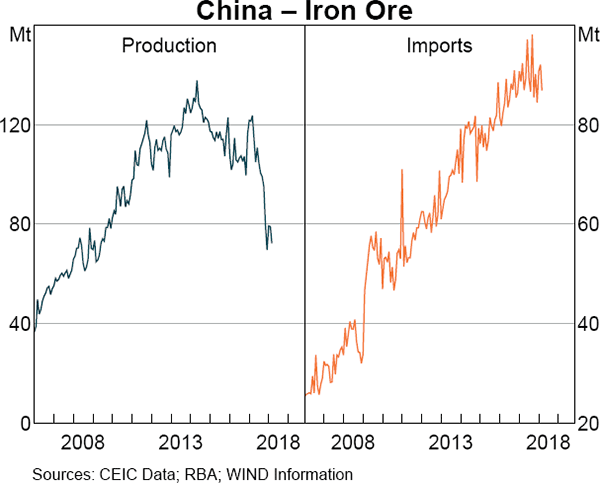
Growth has been supported by strong activity in the services sector. While growth in the industrial sector has been broadly stable over the past year, production of a range of industrial products has fallen sharply more recently. Investment in infrastructure and residential property remains strong overall, and demand from these sectors has underpinned modest growth in crude steel production, which in turn has supported demand for iron ore and coking coal. Anti-pollution measures have spurred a shift in demand to higher-grade ore, which is mainly imported, at the expense of (lower-grade) domestic Chinese production of iron ore, which has fallen noticeably over the past six months (Graph 1.22).
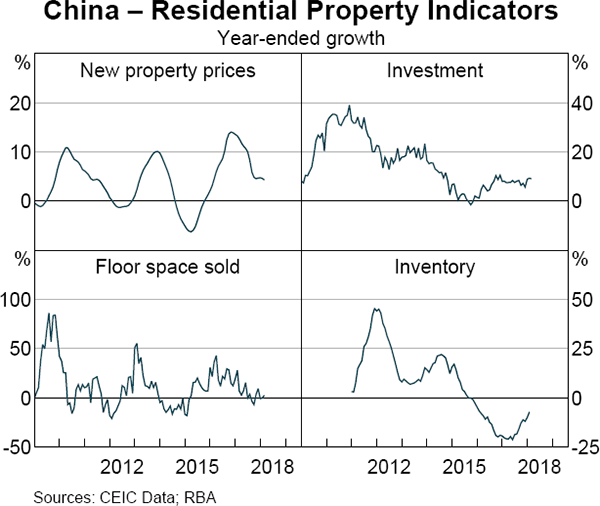
Activity in Chinese property markets has been resilient (Graph 1.23). Investment growth has been relatively strong, following a substantial decline in the inventory of unsold housing in many parts of China. Housing price inflation has remained firm at the national level, but prices have fallen in the largest Chinese cities. Residential floor space sold remains at a high level, although it has fallen in cities that have controls on housing purchases. Recent government announcements suggest that housing market controls aimed at limiting speculative activity and moderating housing price inflation will remain in place in 2018 and that local authorities will continue to calibrate regulations to local conditions. A number of cities have announced new controls on property purchases in recent months.
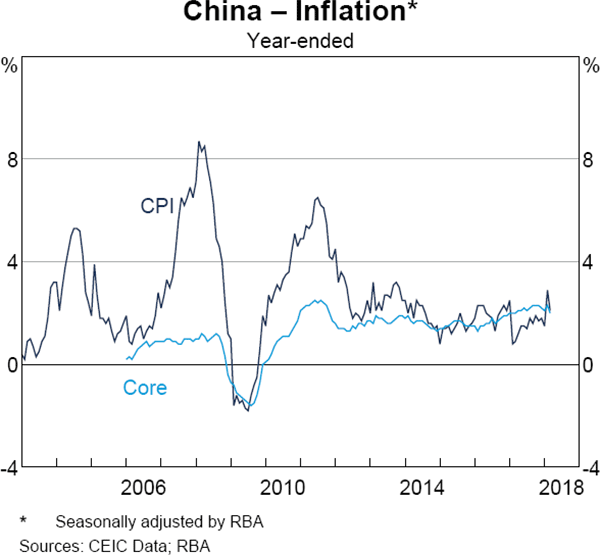
Chinese producer price inflation has weakened in recent months, reflecting the moderation in bulk commodity prices and subdued demand in the manufacturing sector (Graph 1.24). Underlying consumer price inflation measures have, however, continued to edge higher, driven by healthcare, household services and rental prices.
Chinese authorities are addressing financial stability concerns, but risks remain
The Chinese authorities have continued to enact measures to contain the build-up of financial risks and have signalled an ongoing commitment to putting the financial system on a more sustainable footing. The growth of bank claims on non-bank financial institutions continues to slow, with stronger enforcement of existing regulations curtailing growth in lending between financial institutions. Interbank funding costs remain elevated. However, they have declined of late as the People's Bank of China (PBC) has eased liquidity conditions, including by reducing the required reserve ratio for banks.
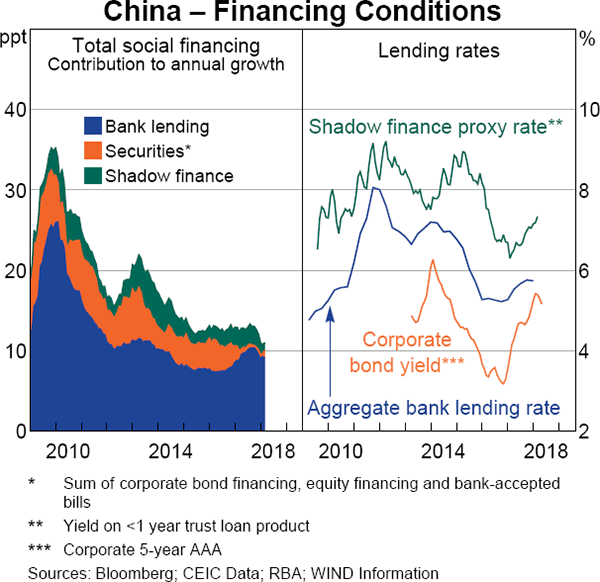
The authorities recently merged the banking and insurance regulators, as part of a broader push to enhance policy coordination across the regulators. Regulators also finalised new regulations for the asset management sector, and enacted measures to encourage banks to correctly classify and dispose of non-performing loans, which are of particular concern for smaller banks. Growth in total social financing has eased, driven by slower growth in non-bank and off-balance sheet financing (Graph 1.25). Bank lending to businesses and households, which together constitute around two-thirds of total credit, both remain relatively strong.
Despite these changes, financial stability risks are likely to remain elevated in China for some time, reflecting high corporate leverage and a financial system that has become very large, and increasingly interconnected and opaque, over the past decade. In particular, the stock of broader ‘shadow’ finance remains large relative to the financial system.
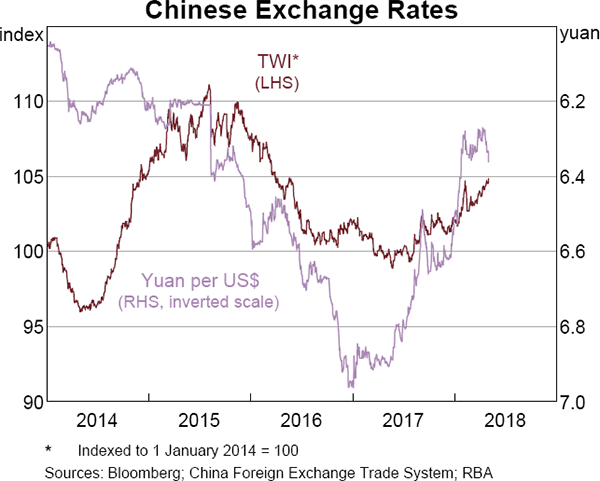
Even though trade frictions between the United States and China have escalated, the Chinese renminbi (RMB) has been little changed against the US dollar and has appreciated slightly on a trade-weighted (TWI) basis over the past few months (Graph 1.26). Capital outflows from China have remained modest, amid continued controls on outbound capital by the Chinese authorities and expectations for only a small depreciation of the RMB. The value of the PBC's foreign currency reserves has been little changed at just above US$3 trillion.
Elsewhere in Asia, growth remains strong
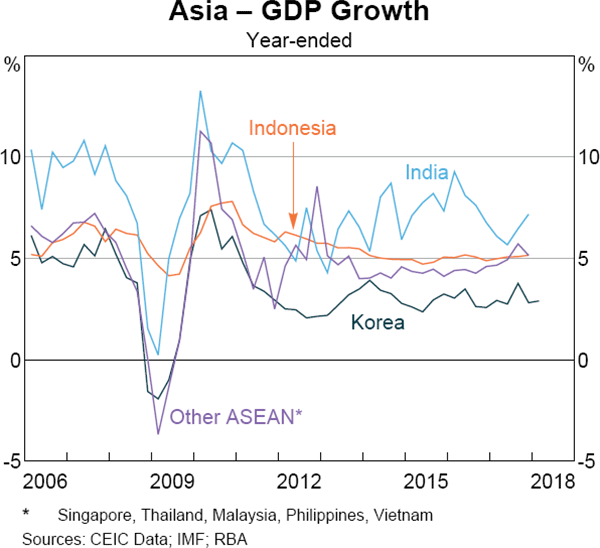
Across the region, growth has been supported by the global upswing in trade and investment over the past two years and is expected to be around estimates of potential over 2018 (Graph 1.27). GDP growth slowed in the December quarter, but data available so far for the March quarter suggest that this was temporary. Domestic demand has picked up in a number of economies in the region, as stronger global conditions have supported stronger investment and consumption.
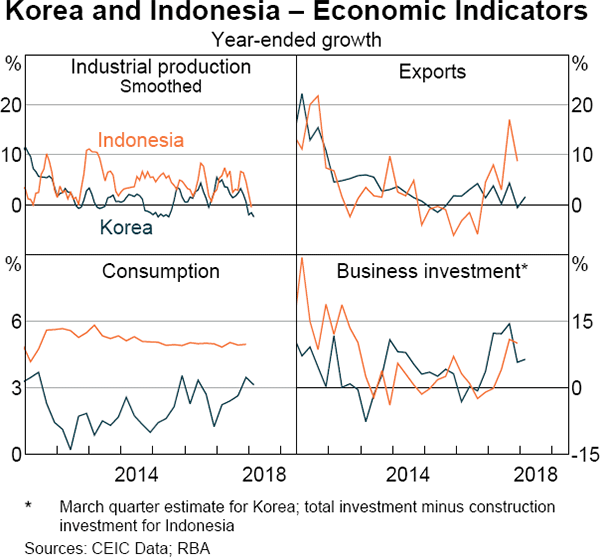
In Korea, GDP increased by nearly 3 per cent over the year to the March quarter. The outlook for Korean investment and consumption growth remains strong: capital goods imports continue to grow briskly and surveyed business conditions and consumer confidence remain elevated (Graph 1.28).
In India, year-ended GDP growth strengthened noticeably in the second half of 2017, to a little more than 7 per cent, driven by a strong recovery in investment growth. GDP growth in Indonesia has been steady at around 5 per cent over the past few years; domestic demand was a little weaker over 2017, despite strong investment growth, but this was offset by fairly broad-based strength in exports. In other economies in the Association of Southeast Asian Nations (ASEAN), growth has picked up a little over the past couple of years and is expected to remain around its current pace in 2018.
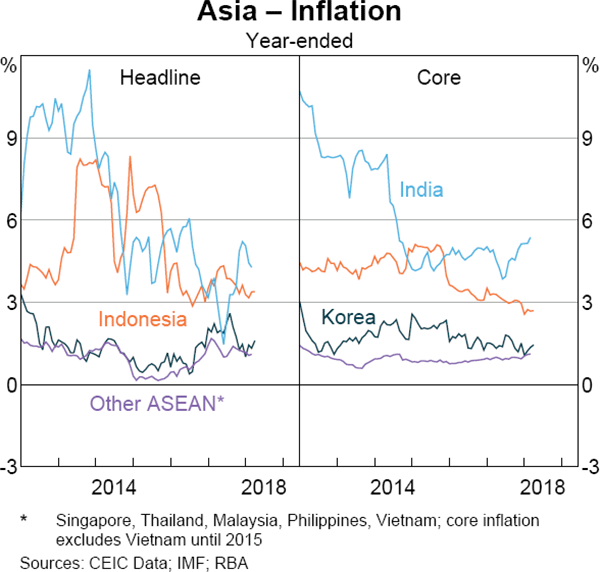
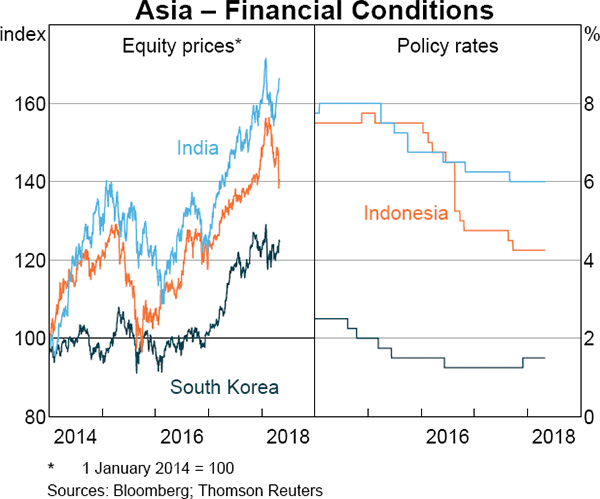
Headline and core inflation generally remain subdued across the region (Graph 1.29). The main exception is India, where headline inflation has picked up in recent quarters, underpinned by food price inflation, and remains above the Reserve Bank of India's medium-term inflation target of 4 per cent. Financial conditions remain accommodative across the region. Central banks' policy settings have been stable at a low level, which generally reflects subdued inflation (Graph 1.30). Asset markets have received net inflows for some time, which has supported equity and bond prices. This in part reflects strong global growth and perceptions that these markets are more resilent to financial shocks than in the past. Fiscal policies in the region have generally been little changed over the past year and also remain accommodative. In India, the bank recapitalisation plan is projected to have a limited impact on the budget deficit; the budget deficit projection for 2018/19 was revised slightly higher, but budget consolidation is projected to continue.
Bulk commodity prices declined in early 2018, while oil prices have risen
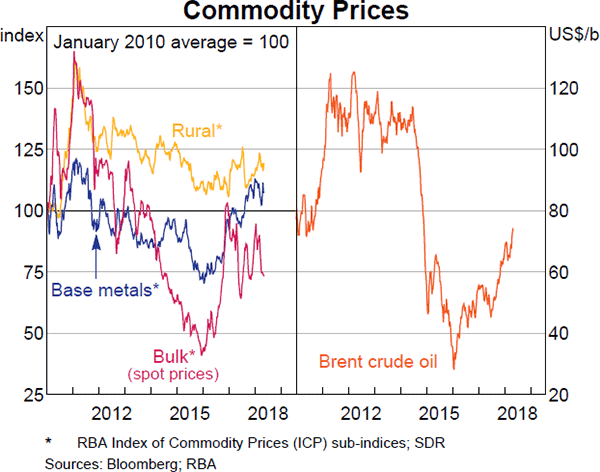
Global commodity prices have been mixed since the previous Statement (Table 1.1; Graph 1.31). Bulk commodity spot prices have declined sharply, owing to concerns about Chinese demand and the potential escalation of global trade protectionist measures. In contrast, oil prices have risen to the highest level since late 2014 but still remain well below the level earlier in the decade. The pick-up in global demand in recent years has been an important contributor to higher oil prices. More recent price rises reflect an increase in geopolitical tension between major producers and comments from several Organization of the Petroleum Exporting Countries (OPEC) members that the current agreement with non-OPEC countries to reduce production could be extended into 2019. Meanwhile, the spot prices of rural commodities, gold and base metals are around the same levels as at the time of the previous Statement.
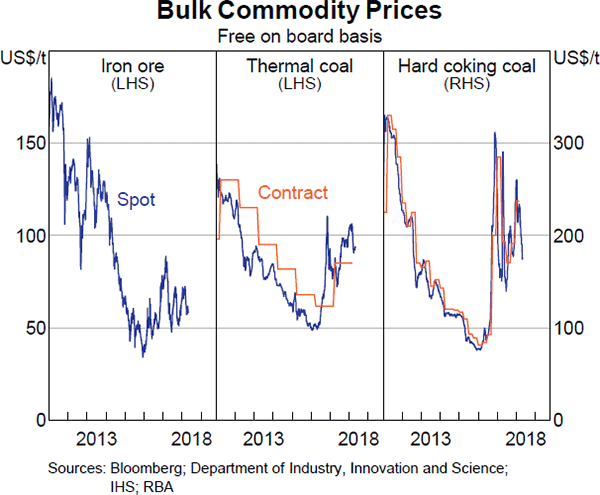
The declines in iron ore and coking coal spot prices occurred alongside a large build-up in Chinese steel inventories prior to the Chinese New Year holiday; this led to uncertainty about whether near-term Chinese steel demand would be sufficient to clear the build-up. The price declines partly reflected concerns about the impact of trade protectionist measures on global growth and were also influenced by the continued recovery of Australian seaborne coking coal supply. Although the coking coal spot price has declined sharply over this period, the March quarter contract price was reportedly set at almost 25 per cent above the December quarter benchmark price, reflecting prevailing spot prices over December–February (Graph 1.32).
| Since previous Statement | Over the past year | |
|---|---|---|
| Bulk commodities | −16 | −14 |
| – Iron ore | −17 | −12 |
| – Coking coal | −20 | −29 |
| – Thermal coal | −8 | 15 |
| Rural | 0 | 0 |
| Base metals | −1 | 9 |
| Gold | 0 | −1 |
| Brent crude oil(b) | 12 | 44 |
| RBA ICP | −3 | 3 |
| – Using spot prices for bulk commodities | −8 | −4 |
|
(a) Prices from the RBA Index of Commodity Prices (ICP); bulk
commodity prices are spot prices Sources: Bloomberg; IHS; RBA |
||
The spot price of thermal coal has also declined since the previous Statement, alongside a reported easing in Chinese demand, following a period of higher demand due to domestic gas shortages earlier in the year. While the benchmark price for the 2018 Japanese fiscal year contract is yet to be agreed, the majority of Australia's thermal coal exports are estimated to be sold on the spot market.
Australian export prices are expected to decline over the coming years as Chinese demand for bulk commodities moderates and further increases in low-cost global supply comes on line.[1] Consequently the terms of trade are expected to decline, but remain above their trough in early 2016 (as discussed in the ‘Economic Outlook’ chapter)
Footnote
RBA (2017), ‘Box A: The Chinese Steel Market and Demand for Bulk Commodities’, Statement on Monetary Policy, November, pp 15–18. [1]