RDP 2021-05: Central Bank Communication: One Size Does Not Fit All 7. Results
May 2021
- Download the Paper 2,051KB
With the models trained we now apply them to a number of economic documents to demonstrate how they can be used to evaluate a large body of work that would otherwise be time consuming to classify manually. Most of the document we focus on, such as monetary policy statements and speeches, are from central banks, but we also include a sample of 20 articles from The Economist for comparison.
For modelling a document, we first break all documents into paragraphs using text mining tools and then convert each paragraph into a structured dataset that includes all variables shown in Table B1. Then, we predict the quality of each paragraph using our 4 models, and classify each paragraph as ‘high’ or ‘low’ for both readability and reasoning from economist and non-economist perspectives. Last, we measure the text quality of a document using the proportion of high-quality paragraphs in it:
7.1 Evaluating a document over time: SMP overviews
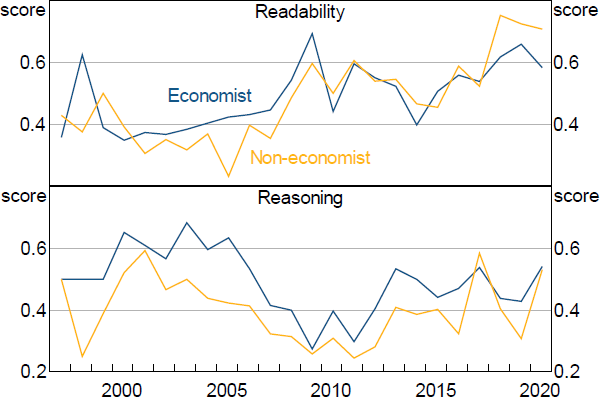
The most important documents that central banks use to communicate with external parties are typically the regularly released monetary policy reports. The RBA has published its SMP since 1997 and so the first texts we apply our models to are the SMP introduction section over the period from 1997 to 2020. This covers 87 issues of the SMP and 1,519 paragraphs. We choose the introduction/overview section because this section generally contains the explanation and justification for policy actions and, as such, is the most important section for understanding central bank policy. Other sections of the SMP tend to consist of more factual reporting of recent data. The results are shown in Figure 12.
Our model results on readability, as shown in the top panel of Figure 12, suggest that the overview section of the SMP has become easier to read over time. Interestingly, our measure picks up more variation in readability over the years than the FK grade level (see Figure A1 for a comparison of the readability score for the SMP introduction and the FK grade level).

Source: Authors' calculations using survey results
Conversely, the reasoning score has shown no particular trends over time. If anything, it has dropped in recent years. Indeed, there appears to be somewhat of a negative correlation between readability and reasoning with an obvious dip in reasoning around 2009 when readability scores jump higher. To the extent that transparency is affected by both readability and the degree of reasoning in documents, it does not necessarily follow that increases in the readability of the SMP have been associated with increases in transparency. While we can't make any statements about the absolute level of transparency in the SMP, these results suggest that evaluating the overall transparency of central bank documents requires a broader consideration than readability metrics alone can provide.
7.2 Comparing documents with each other
In addition to monetary policy statements, central banks also release other publications, such as speeches by senior staff, short articles and financial stability reports. In this section, we apply our models to some of these documents to see what they reveal about any variations in text quality across documents.
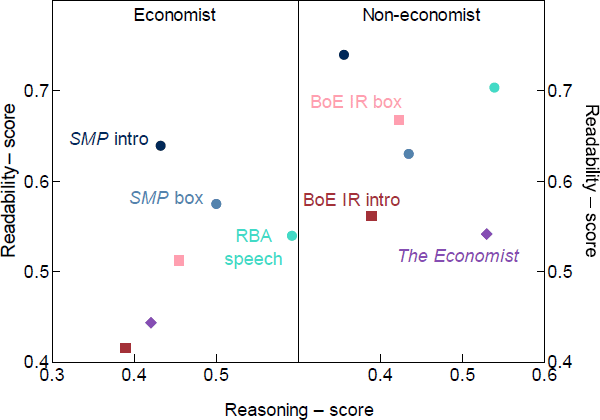
We choose a number of paragraphs from the Bank of England (BoE) Inflation Report introduction and boxes, RBA speeches and SMP introduction and boxes published in 2018 and 2019[25] and articles from The Economist[26]. Figure 13 shows the results. The correlation between readability and reasoning is not significant in both panels, but the pattern is clearly different between economists and non-economists.
As assessed by economists, speeches have the highest reasoning rating but an average readability rating. Conversely, the introduction to the SMP in 2018–19 has a low reasoning rating but the highest readability rating. When assessed by non-economists, however, RBA speeches are found to have among the highest average readability and reasoning ratings. This may reflect the fact that spoken communication is different to written communication, but could also reflect the different objectives of these different documents. Speech givers seem to be communicating particular positions and arguments that are relatively clearer to non-economists, while the writers of boxes and the SMP seem to be more focused on communicating facts clearly.
Another interesting feature is the change in the relative ranking of the BoE samples between economists and non-economists. While RBA economists rated RBA documents more highly than BoE documents, non-economists rated BoE documents relatively higher and their ratings were less dispersed overall. This points towards a preference among RBA economists for the RBA ‘house style’. We can't be certain, but given that topic and word choice do not affect our algorithms, this preference is unlikely to reflect greater familiarity among RBA economists with the topic matter of these publications – hence our suspicion that it reflects a ‘house style’ preference.

Source: Authors' calculations using survey results
Finally, we see that The Economist is rated highly for reasoning by non-economists but not particularly highly for readability. While this reflects the fact that The Economist primarily presents analysis and opinions it does not seem to reflect its well-founded reputation for plain language. We see two possible explanations for this. One, our algorithm is reflecting a preference for a particularly Australian idiom or house style that The Economist does not conform to – which may also explain the low ratings from economists. Or two, by averaging the rating of paragraphs over a whole document we may be overemphasising the role of body paragraphs in a document and underemphasising the importance of introductory and concluding paragraphs. That is, the subjective assessment of a document's overall quality may depend more heavily on the quality of the introduction and conclusion than our index does. We reflect on this point in the section below.
Notwithstanding these observations, the results are only preliminary and suggestive and are meant to be illustrative of the potential of these ML techniques rather than be definitive findings. Regardless, they re-emphasise our observation that: different documents are perceived differently by different audiences and this argues for clearly targeting one audience rather than attempting to reach multiple audiences with the one document.
7.3 The variation of readability and reasoning within a document
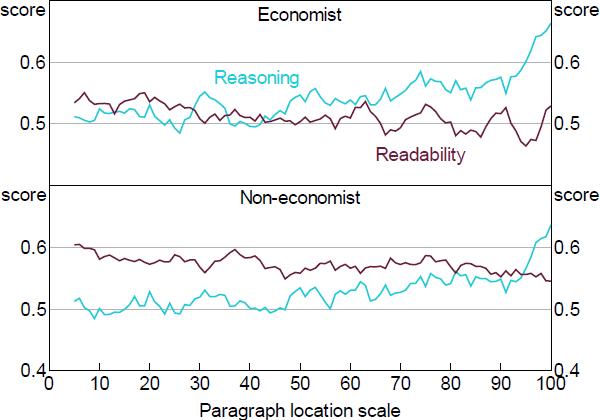
So far, we have only assessed text quality differences at the aggregate level across documents, but we have not analysed text quality within a document. To investigate this aspect of communication we analysed 99 speeches that were given by RBA senior officers in 2018 and 2019. We first calculate the percentile position of each paragraph based on its location in a document. For example, if there are 20 paragraphs in a speech, the first paragraph's percentile position is 5 per cent, and the second is 10 per cent and so on.
Figure 14 shows the results from our 4 models. We can see that reasoning scores are much higher for paragraphs at the end of a speech, but readability scores are relatively higher for those at the beginning. This pattern seems to reflect a natural structure of a speech. The introduction is usually pleasantries and broad ideas, which are easy to understand as speakers want to grab the audience's attention and ensure they listen to the rest of it. The conclusion, conversely, is usually where the main arguments or opinions presented by the speaker are summarised.

Source: Authors' calculations using survey results
This variation through the document, however, raises questions about the best way to assess overall document quality. Our method, by weighting paragraphs throughout a document equally, may penalise longer documents that contain more factual body paragraphs even though a human reader might judge them to be equally effective. We leave the question of which is the most effective way of rating the overall quality of a document for future research. Regardless, this suggests that targeting particular readability metrics may be useful for introductory paragraphs, but off target for conclusions. As with targeting different audiences with different documents, so too different rhetorical objectives should be targeted with different styles – one size does not fit all.
Footnotes
We restrict the SMP sample to the years 2018–19 to match the approximate time period covered by all the other sources considered. To the extent that the economic environment may affect the way content is communicated, this means that there is some comparability between the underlying documents, particularly those from the same institution. [25]
We randomly selected 20 articles from the ‘Finance & economics’ section of The Economist that were published between 2019 and 2020. [26]