RDP 2018-01: A Density-based Estimator of Core/Periphery Network Structures: Analysing the Australian Interbank Market Appendix E: Results with Higher-frequency Networks
February 2018
- Download the Paper 1,628KB
Our baseline results are based on networks constructed at a quarterly frequency. Here we discuss the robustness of our findings to changes in the aggregation period. Specifically, we apply our density-based estimator to unweighted–directed networks constructed at monthly and weekly frequencies.
As expected, the shorter the horizon of time aggregation, the smaller the network size and its density. The average number of active banks on a given week (month) in our sample is 34 (37), as opposed to an average of 41 active banks for each quarter. The average weekly (monthly) density is 0.11 (0.19), as opposed to 0.25 on average in our quarterly networks.
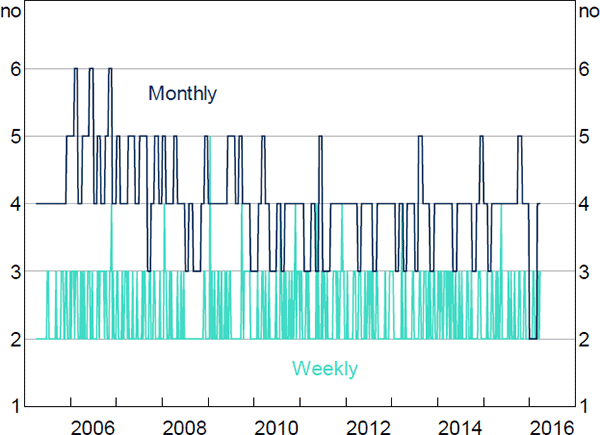
Figure E1 shows the time-varying core sizes for the weekly and monthly aggregation periods. At the monthly frequency, we estimate the typical pre-crisis core size to be 4–5 banks, falling to 3–4 banks post-crisis. Therefore, the fall in core size that we find in our baseline analysis is still visible in the monthly data, albeit with a smaller core. The weekly networks show no discernible change in core size between pre- and post-crisis.

The divergence we find between aggregation periods is not unusual. Finger, Fricke and Lux (2012) compare the network properties of the Italian interbank loans market across daily, monthly, quarterly, and yearly frequencies and conclude that inference based on high-frequency aggregation periods may be misleading. In particular, they ‘show that the networks appear to be random at the daily level, but contain significant non-random structure for longer aggregation periods’. This is because high-frequency networks ‘provide probably only a very small sample of realizations from a richer structure of relationships’ (Finger et al 2012).