Bulletin – March 2012 Trends in National Saving and Investment
- Download the article 212KB
Abstract
Both saving and investment have tended to be high as a share of GDP in Australia relative to other advanced economies. But because investment has tended to exceed savings, Australia has traditionally had a sizeable current account deficit. This deficit has, however, narrowed over the past few years as the national saving rate has trended higher. This article looks at the recent sectoral trends in national saving and investment and puts them in historical perspective.
Introduction
National saving is the difference between a nation's income and what it spends on the consumption of goods and services, and comprises household, corporate and government saving. The level of national saving has important implications for the economy; it provides a source of funds available for domestic investment, which in turn is a key driver of labour productivity and higher future living standards. In an economy open to trade and capital flows, the difference between the level of investment and saving in the economy is equal to the current account balance. Over a long period of time, Australia's investment has tended to exceed saving, leading to sizeable current account deficits (Graph 1).[1]
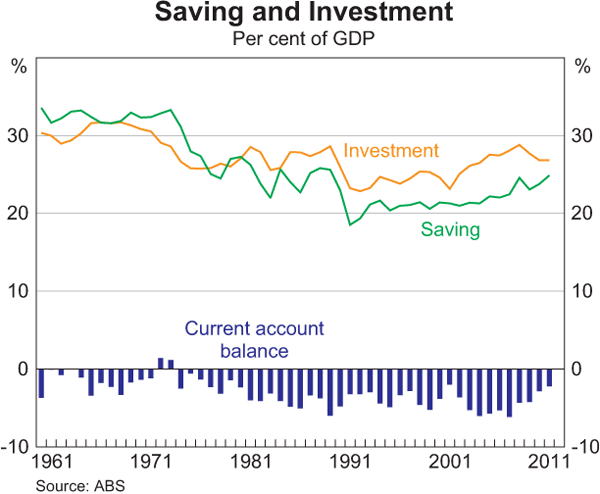
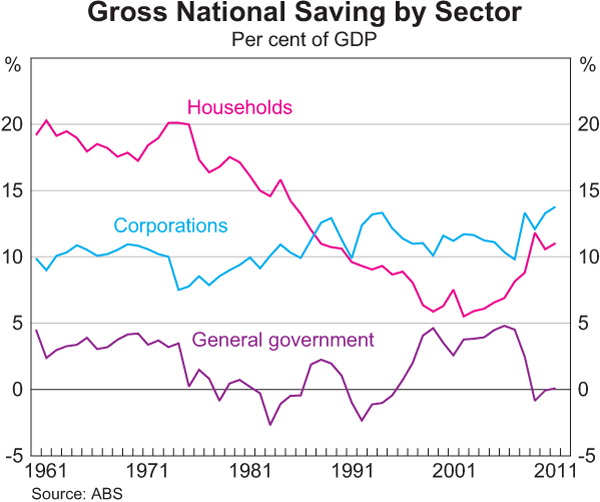
National saving fell as a share of GDP over the 1970s and 1980s, largely reflecting a decline in household and government saving (Graph 2). The investment share of GDP fell only slightly over this period, and so by the end of the 1980s there had been a widening in Australia's current account deficit, from an average of 1.8 per cent of GDP in the 1960s to 4 per cent of GDP in the 1980s. After remaining steady at a little over 20 per cent of GDP over the 1990s, the national saving rate started to trend higher over the second half of the 2000s, as a step-up in saving by households and corporations more than offset a decline in saving by governments. Investment also declined as a share of GDP from around 2008 following the global financial crisis. The increase in saving and decline in investment saw the current account deficit narrow to around 2¼ per cent of GDP in 2011 from an average of 4¼ per cent of GDP over the previous two decades.
As a share of GDP, Australia's national saving has tended to be higher than the average of that in other advanced economies, reflecting a higher level of government sector saving and, more recently, an increase in saving by the private sector (Graph 3). Part of the explanation for Australia's relatively high and increasing level of national saving is the gradual growth of compulsory superannuation (Connolly 2007; Gruen and Soding 2011). In their analysis, Gruen and Soding (2011) estimate that the boost to national saving over recent years from compulsory superannuation to be about 1½ per cent of GDP, up from around ½ per cent of GDP in 1992.[2]
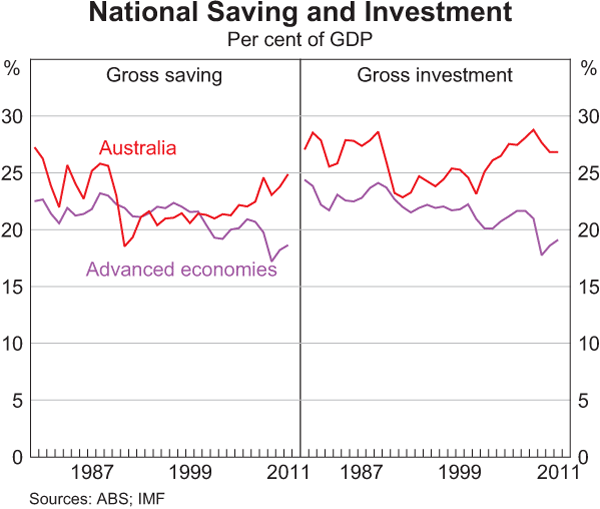
Australia's level of investment as a share of GDP has also tended to be higher than that in other advanced economies, with this gap widening recently. In 2011, Australia's national investment was around 27 per cent of GDP as large-scale mining projects commenced. This compares with an average of 19 per cent of GDP for advanced economies, which are still suffering from weak economic activity following the global financial crisis.
National Saving
Household saving
Household saving – or the amount of household disposable income not spent on the consumption of goods and services – trended lower as a ratio to GDP up until the mid 2000s.[3] The trend decline in household saving, and possible explanations for this change in household behaviour, has been widely documented (Edey and Gower 2000; Hiebert 2006). One factor that contributed to the decline in household saving during the 1980s and 1990s was the deregulation of the financial sector in the 1980s, which removed restrictions on households' access to finance, allowing them to increase their borrowing. Households used this debt to finance house purchases and (to a lesser extent) financial assets. Hiebert (2006) notes that the relaxation of credit constraints and subsequent run-up in debt allowed households to smooth consumption and reduce saving. This effect is only present while households make the transition to higher levels of debt.[4] The run-up in debt also boosted housing prices, and the subsequent increase in net wealth increased household spending via the ‘wealth effect’ (Graph 4). In the national accounts, capital gains are not counted as income but can be used by households to fund consumption, thereby putting downward pressure on the saving ratio. In addition, the sustained decline in unemployment over the 1990s and 2000s is likely to have reduced households' precautionary saving as a buffer against future adverse shocks.
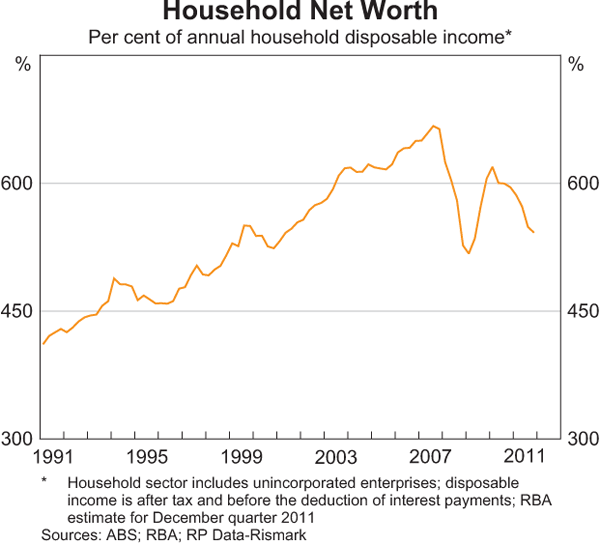
The trend decline in the saving ratio reversed in the mid 2000s, and the ratio is currently around its level in the late 1980s. There are a number of factors that could explain this change in household behaviour (as outlined in Lowe (2011) and Stevens (2011)). It may reflect households returning to more ‘normal’ patterns of spending and saving following the period in which households transitioned to higher levels of debt. The rise in the saving ratio could also be a response to the large negative wealth shock and volatility of asset prices since 2008: households may expect their income to grow more slowly in the future, or they may expect that lower returns on assets will provide fewer resources for future consumption.
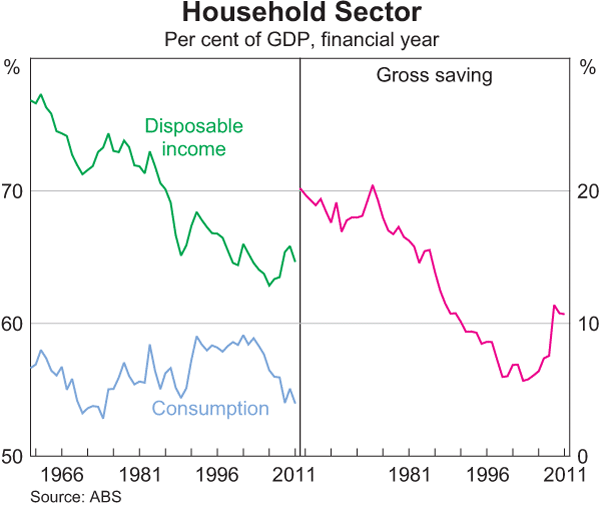
Trends in household income and consumption can also be examined to analyse changes in the household saving ratio. Graph 5 shows that the decline in the saving ratio up until the mid 2000s coincided with a fall in households' share of national income; according to the national accounts, household disposable income steadily fell from 75 per cent of GDP in the 1960s to below 65 per cent of GDP in the 2000s. Over the same period, household spending on goods and services as a share of GDP oscillated within a band of between 53 per cent and 59 per cent up until the mid 2000s. Since the mid 2000s, however, the household disposable income-to-GDP ratio has risen. At the same time, the consumption share of GDP has declined to its pre-1990s average share of GDP, leading the household saving ratio to rise to its highest level in over two decades.
The step down in household disposable income as a share of GDP since the 1960s can largely be explained by a shift of income from the household to the corporate sector,[5] higher net interest payments, and an increase in income taxes (Graph 6). The sharp fall in gross mixed income (GMI) of unincorporated enterprises (which are classified as ‘household sector’ in the national accounts) mainly reflects the general trend towards incorporation which, in national accounting terms, has shifted profits from the household sector (GMI) to the corporate sector (gross operating surplus).[6] In addition, since the 1990s, the compensation of employees (wages and employer superannuation contributions) has declined slightly as a share of GDP.
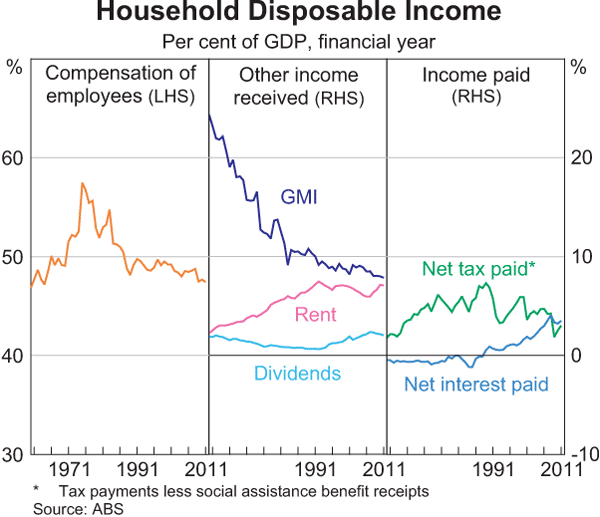
Another factor explaining the downward trend in household disposable income is that households are now paying out more of their income in interest payments and in taxes. Household net interest payments became positive for the first time in the late 1980s and continued to trend higher as a share of GDP before levelling out in 2007/08 (Graph 6). The upward trend reflected two developments. First, households' interest receipts declined in the late 1980s and have remained broadly steady as a share of GDP since then, reflecting both a decline in real interest rates and as household portfolios became more diversified (to hold a lower share of assets in deposits and higher shares in equities and housing). Second, the rise in household debt has meant that households have been paying more out of their income to service this debt. Net interest payments have fallen slightly since 2007/08 due to softer demand for credit and lower borrowing rates.
Tax payments rose as a share of GDP up until the late 1970s, were flat in trend terms until the mid 2000s and have since declined (Graph 7). This decline reflects sizeable income tax cuts and, more recently, the impact of the global financial crisis. While household income growth and employment growth slowed during the global financial crisis by less than during the early 1990s recession, the extent of capital losses on household assets was larger in the recent episode, reducing tax payments on capital gains.
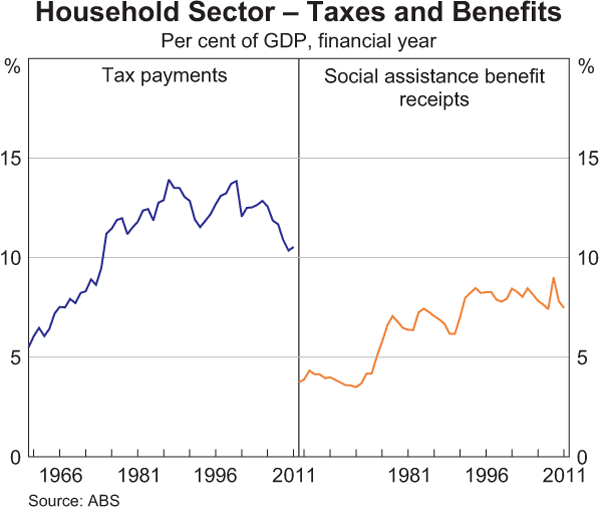
The increase in average household tax rates since the 1960s has been partly offset by an increase in transfer payments from the government sector. Social assistance benefits rose sharply relative to GDP during the early 1990s recession and have remained at around 8 per cent of GDP since then (abstracting from the sharp rise during 2008/09, reflecting one-off stimulus payments to households). The upward trend in the level of social assistance payments over time reflects both an increase in the share of the population receiving transfer payments and an increase in real levels of assistance (Harmer 2008). Alongside an increase in transfer payments, households have also received more rental income.
Although national income accruing to the household sector has fallen, household consumption was broadly unchanged as a share of GDP up until the mid 2000s (Graph 5). This was partly due to increases in the size of household balance sheets. Households increased their borrowing through the 1990s and early 2000s, and partly used this to fund consumption. However, as noted above, households have changed their spending behaviour since the mid 2000s, which has seen consumption fall as a share of GDP and the saving ratio rise.
Corporate saving
Corporate saving can be broadly described as the after-tax profits that are not distributed to shareholders, and can be used to fund investment or purchase assets.[7] There has been a small upward trend in the corporate saving rate since the mid 1970s, but it has generally remained below the level of business investment, and so corporations have tended to be net borrowers from households and overseas investors (Graph 8). There was a noticeable increase in the corporate saving rate following the early 1990s recession and the global financial crisis of 2008/09, preceded by high levels of investment, funded mainly by debt in each case. In both periods, corporates increased their saving to repay debts and reduce their gearing ratios. More recently, there has been an increase in the saving rate largely due to the strong growth in mining profits associated with record high commodity prices, while the level of investment has remained at high levels due to a surge in mining investment.
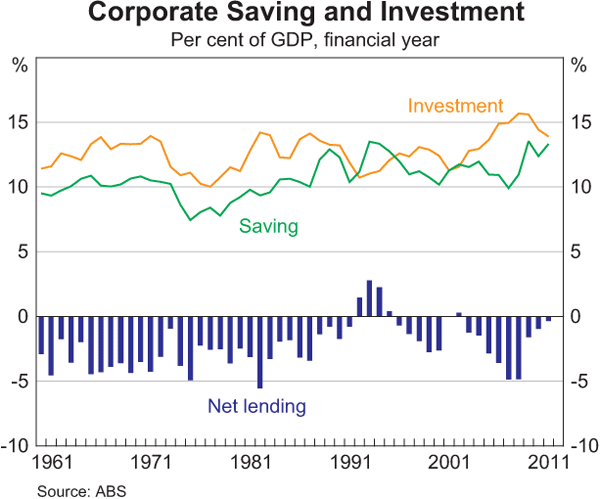
The high level of corporate saving in recent years has meant that for a given level of investment, there has been less funding raised externally than in previous years. This flow of external funding, from banks, bond markets and equity markets, has slowed since 2007/08. Consistent with this, business debt has declined by almost 10 percentage points of GDP and gearing ratios have returned to around decade averages.
Movements in the corporate saving rate can also be analysed by looking at trends in income received and paid. The bulk of corporate disposable income received accrues to private non-financial corporations, although the income of private financial corporations (namely banks, insurance companies and the superannuation sector) has also increased steadily. This has more than offset the downward trend in public corporations' income, as privatisation activity in the past two decades has shifted income from the public sector to the private sector.
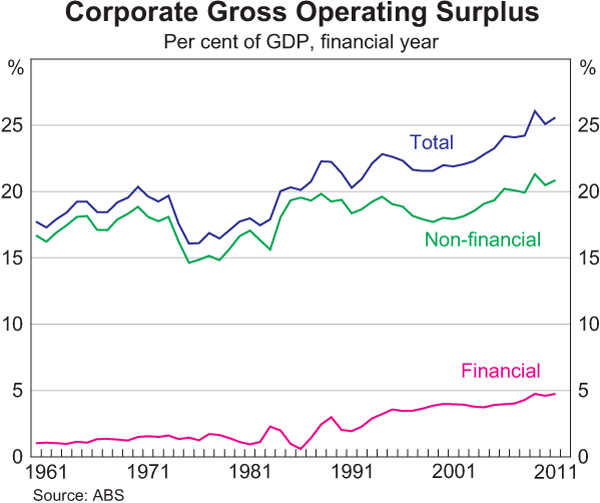
Corporate gross income received has steadily increased as a share of GDP since the 1960s, notwithstanding cyclical declines during economic slowdowns and recessions. This is related to the increase in profits, which have steadily risen as a share of GDP (Graph 9). As noted in the previous section, profits have shifted from the household sector (GMI) to the corporate sector (gross operating surplus). Following the financial liberalisation of the 1980s and 1990s, the financial sector has increased its share of the output in the economy. This has seen its gross operating surplus increase to be nearly 5 per cent of GDP. More broadly, the upward trend in profits (and consequent decline in the share of income going to labour) has also been seen in a range of countries.[8] The recent increase in profits has been driven by mining profits associated with the strong rise in commodity prices.
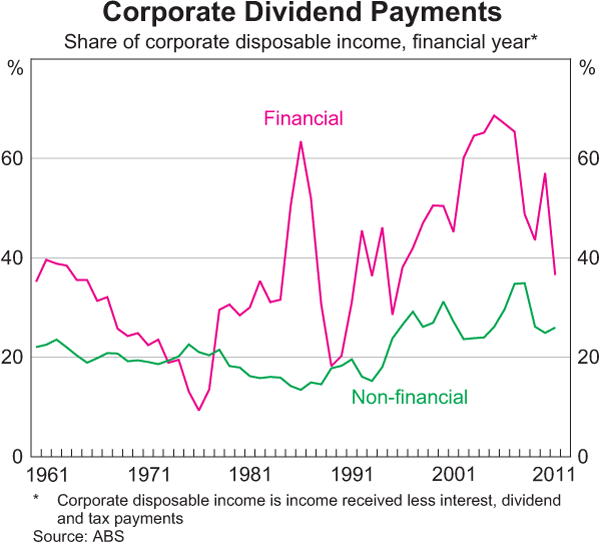
The increase in profits has been partly offset by an increase in the income paid out by corporations in the form of dividends and taxation. Dividend payments to households, the government and overseas investors have increased as a share of income, which may partly reflect the introduction of dividend imputation in Australia in 1987 that encouraged a higher dividend payout ratio (Graph 10). More recently corporations have chosen to retain more of their income on their balance sheet rather than paying it out in the form of dividends. Corporate tax has increased as a share of GDP, largely reflecting the increase in profits over recent decades (see ‘Government saving’ below).
Government saving
Gross saving by the general government sector – which does not include public corporations – is measured in the national accounts as revenue net of spending on social assistance payments, interest, subsidies and government consumption (including services such as education and health and public sector wages).[9] Prior to the mid 1970s, government saving was fairly stable at 3½ per cent of GDP. It then fell steadily, to be negative for much of the decade from 1975 to 1985, and began to exhibit larger cyclical fluctuations; saving rose strongly during the economic expansions of the 1980s, 1990s and 2000s, but fell sharply as a share of GDP during the early 1990s recession and the economic slowdown of 2008/09 (Graph 11).
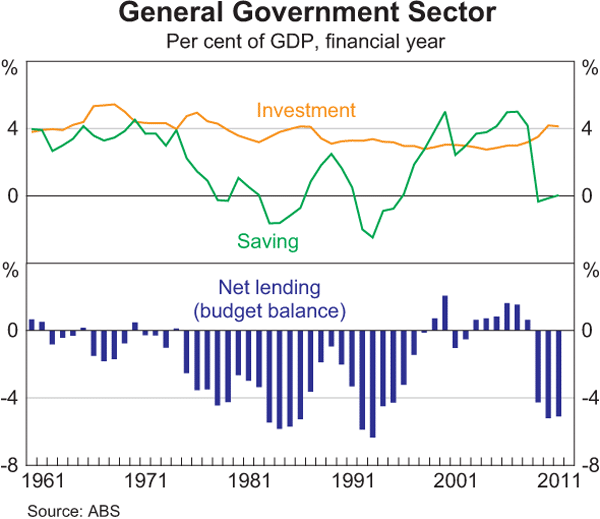
Government investment – such as infrastructure – has been little changed as a share of GDP, though it should be noted there has been a trend decline in public investment if investment by public corporations is included. As government investment has on average exceeded saving over the past 50 years, governments have tended to run budget deficits.[10] On average over the past 50 years, however, Australian budget deficits have been lower than the average of other advanced economies.
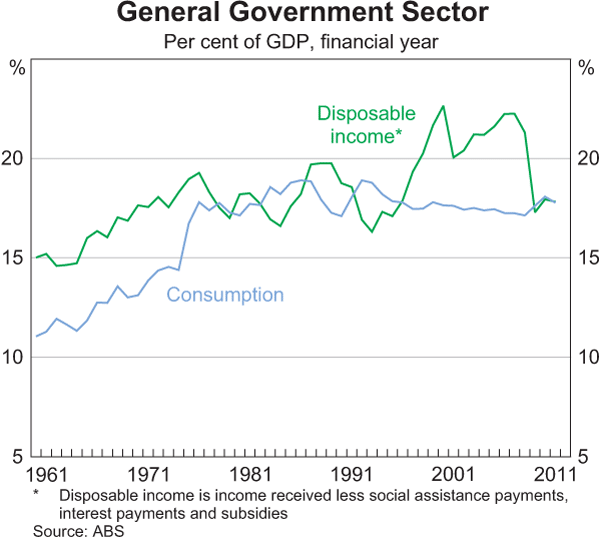
Government disposable income – comprising revenue less social assistance benefit payments and interest on government debt – has tended to be more cyclical than government consumption expenditure (Graph 12). In the decade prior to the 2008/09 economic slowdown, the share of national income accruing to the general government was high relative to previous decades. This reflected the better-than-expected economic conditions and the fall in interest payments on government debt (discussed below). With government consumption remaining broadly unchanged over that period, governments used this saving to pay down debt. Since 2008/09, government disposable income has fallen sharply in response to the global financial crisis, largely reflecting a fall in tax revenue.
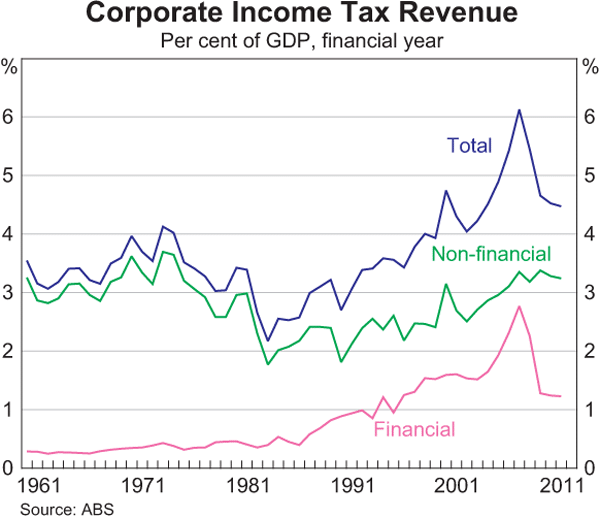
As government debt was reduced over the 1990s – due to fiscal consolidation and the sale of government-owned enterprises – government interest payments fell from more than 4 per cent of GDP to less than 2 per cent, boosting government disposable income and saving (Graph 13).[11] This was partly offset by the rise in social assistance payments as a share of GDP. Government revenue from corporate taxes has increased relative to GDP over recent decades, consistent with the trend rise in the profit share of GDP. Until very recently, growth in corporate income taxes was driven by a significant rise in profits of financial corporations (Graph 14). The rising importance of the finance and insurance industry for revenue collections has also been observed in some other advanced economies, and reflects the relatively high average tax rate, income and profits of the industry.[12]
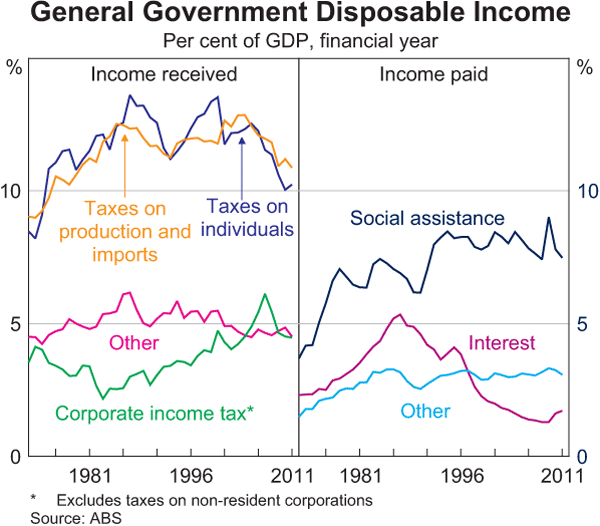
While general government disposable income was at elevated levels from the late 1990s to 2008, public spending on goods and services was trending lower as a share of GDP. Consumption expenditure on education, defence and general public services (such as outlays on administration and operation of general public services) all declined relative to GDP over this period. In contrast, spending on health, social security and welfare, and public order and safety trended higher as a share of GDP. With income remaining elevated and consumption declining, the level of gross saving by the government sector increased to around 5 per cent of GDP. This meant that the general government was able to deliver budget surpluses of around 1 per cent of GDP, given that general government investment spending remained broadly steady at around 3 per cent of GDP. In addition to being used to pay down government debt, these budget surpluses were deposited into the independently managed Future Fund to help cater for the increased fiscal pressures in the future arising from an ageing of the population.
Government saving has fallen since the economic slowdown of 2008/09. Government disposable income declined particularly sharply, due to a fall in tax collections. At the same time, public investment, particularly by the state governments, has risen relative to GDP (see ‘Investment’ below). This led to an increase in public net debt to around 6½ per cent of GDP in 2010/11, although debt levels remain relatively low by international standards.[13] The Australian Government has committed to a significant fiscal consolidation over the next few years, assuming modest increases in expenses, and a recovery in tax revenues.
Investment
Australia has a relatively high level of investment as a share of GDP compared with other advanced economies (Graph 3). Private business investment accounts for over half of national investment on average and as a share of GDP private business investment has increased to close to 50-year highs (Graph 15). Over the next few years, investment growth is expected to be driven by the mining sector, with around $180 billion of liquefied natural gas (LNG) projects approved or under construction, as well as expansions in the capacity of the coal and iron ore sectors. This is expected to see mining investment reach a record of close to 8 per cent of GDP, which is more than double its share in previous mining booms.
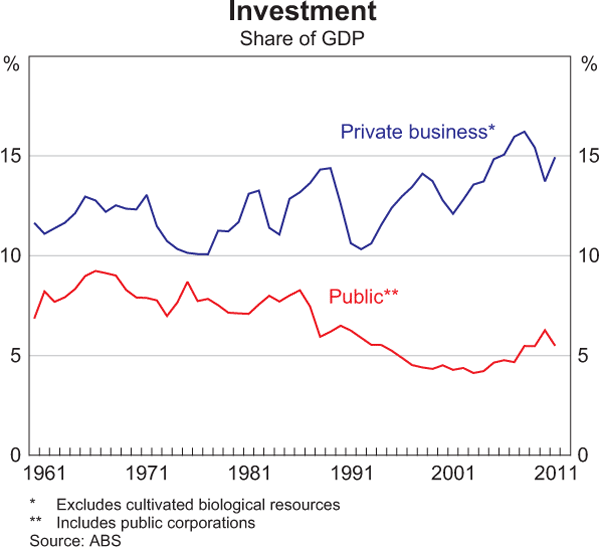
In contrast, non-mining investment has fallen sharply as a share of GDP in recent years, which may be due to the impact of the high exchange rate on profitability in trade-exposed industries. However, the sharp appreciation of the Australian dollar over recent years also reduces the price of investment relative to prices paid for other goods and services (Lowe 2011).
Public investment – which covers a broad range of spending, including on transport infrastructure, hospitals, educational facilities and state-owned utilities – declined significantly as a share of GDP through the 1990s. This partly reflected fiscal consolidation, as well as the private provision of services previously provided by the public sector (such as transport infrastructure projects) and the privatisation of public enterprises. This decline reversed in the 2000s, with public investment rising from 4½ per cent of GDP in 2000 to 6 per cent of GDP in 2010. Initially this recovery was underpinned by infrastructure spending by state governments, although in more recent years it has been driven by stimulus spending by the Australian Government on school buildings and public housing.
The increase in investment in infrastructure-related industries (which include utilities, transport and communications) over the 2000s has been unwound more recently (Graph 16). While investment in utilities has fallen as a share of GDP, it remains at elevated levels, as firms update ageing infrastructure and expand capacity to meet demand (following under-investment during much of the 1990s).[14] Investment in the finance, property and business services industries has also fallen relative to GDP, while investment in the manufacturing industry continues to trend lower as a share of GDP consistent with the industry's longer-run structural decline as a share of the economy and, more recently, the impact of the high exchange rate.
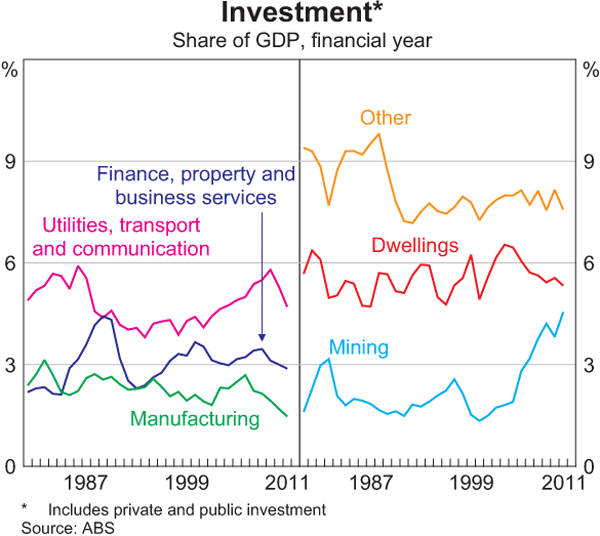
Investment by households is predominantly on residential dwellings, which includes spending on newly constructed homes and renovations to existing dwellings.[15] Private dwelling investment has fluctuated in a fairly narrow band of 4–6 per cent of GDP but has fallen in more recent years, following the strong housing cycle in the early 2000s (Graph 16). The public sector also invests in dwellings. After peaking at 1 per cent of GDP in the years following the Second World War (to accommodate the housing needs of returned servicemen), public investment in housing has remained at relatively low levels.
Conclusion
Australia tends to have higher rates of national saving and investment than other advanced economies. The national saving rate has been trending higher in recent years, as households and the corporate sector have increased their saving, more than offsetting the decline in government saving over this period. The higher rate of national saving has funded much of the recent mining-led increase in investment, with the current account deficit currently around historically low levels.
Footnotes
The authors are from Economic Analysis Department. [*]
The implications for an economy running a persistent current account deficit have been much debated and are not pursued in this article. See Belkar, Cockerell and Kent (2007) and Debelle (2011) for a discussion. [1]
Compulsory superannuation increases the level of national saving if it is not offset by reductions in other forms of saving. This might be the case if compulsory superannuation makes households more aware of the need to save for retirement, and thereby boosts voluntary saving. Connolly (2007) estimated that for every dollar contributed to superannuation, other saving falls by around 30 cents. [2]
Household saving tends to be reported on a net basis, which adjusts household income for depreciation of the capital assets of the household sector. However, gross measures of saving have generally been preferred for sectoral analysis and in international comparisons due to uncertainties in the estimation of depreciation (Edey and Gower 2000). [3]
A transition to higher indebtedness following an easing in credit constraints can take some years and reduce aggregate saving rates during the process. Older generations tend to not borrow but can still increase consumption if asset prices rise (e.g. housing prices) and they choose not to bequeath all of this extra wealth to younger generations. [4]
This article distinguishes between household and corporate income because they can be influenced by different factors. It should be noted, however, that the household sector (along with foreign owners) owns the private corporate sector, and hence the income of the household sector ultimately includes the profits of businesses, whether they are retained within the company or paid out as dividends. [5]
GMI includes both the returns on labour inputs (compensation of employees) and the return on capital inputs (operating surplus). The decline in GMI as a share of GDP is also partly due to a fall in the size of the farm sector, relative to other sectors in Australia. Gross operating surplus is measured as profits before interest, tax, depreciation and amortisation. [6]
Public corporations are included in this analysis because separate data on private corporations are not available prior to 1989/90. [7]
See Ellis and Smith (2007) for a discussion of this trend. [8]
It should be noted that inflation distorts the measurement of saving since, in effect, the national accounting aggregates count interest payments and receipts on a nominal rather than a real basis. Edey and Gower (2000) adjusted saving measures to account for this effect in the high-inflation period, when real interest rates were relatively low. While the inflation adjustment to total national saving is quite small, the adjustment substantially boosts government saving in the 1970s and early 1980s. Inflation adjustment has the reverse impact on private saving, reducing the level of saving in earlier periods and flattening out the longer-run trend. [9]
The general government budget balance is government saving (and net capital transfers) minus public investment. [10]
Interest payments include the imputed interest accrued during the period on unfunded superannuation liabilities. These ‘payments’ accounted for half the value of interest payments in 2010/11. [11]
See Greagg, Parham and Stojanovski (2010). [12]
For a comparison of the Australian Government's net debt to the G7 economies, see Australian Government (2011). [13]
For further discussion of investment in utilities, and the impact on utilities prices, see Plumb and Davis (2010). [14]
Households also invest in durable goods like cars and household appliances, but in the national accounts this expenditure is treated as consumption rather than investment. [15]
References
Australian Government (2011), ‘Box 2: The Strength of the Australian Government's Financial Position’, in 2011–12 Australian Government Budget – Budget Paper No. 1, Commonwealth of Australia, Canberra, pp 7-6–7-7.
Belkar R, L Cockerell and C Kent (2007), ‘Current Account Deficits: The Australian Debate’, RBA Research Discussion Paper No 2007-02.
Connolly E (2007), ‘The Effect of the Australian Superannuation Guarantee on Household Saving Behaviour’, RBA Research Discussion Paper No 2007-08.
Debelle G (2011), ‘In Defence of Current Account Deficits’, Address to the ADBI/UniSA Workshop on Growth and Integration in Asia, Adelaide, 8 July.
Edey M and L Gower (2000), ‘National Saving: Trends and Policy’, in D Gruen and S Shrestha (eds), The Australian Economy in the 1990s, Proceedings of a Conference, Reserve Bank of Australia, Sydney, pp 227–310.
Ellis L and K Smith (2007), ‘The Global Upward Trend in the Profit Share’, BIS Working Paper No 231.
Greagg P, D Parham and P Stojanovski (2010), ‘Disparities in Average Rates of Tax Across Industries’, Economic Roundup, Winter, pp 91–103.
Gruen D and L Soding (2011), ‘Compulsory Superannuation and National Saving’, Paper presented to the Melbourne Institute and The Australian Economic and Social Outlook Conference 2011 ‘Growth Challenge: Riding the Resources Boom to Lasting Prosperity’, Melbourne, 30 June–1 July.
Harmer J (2008), ‘Pension Review: Background Paper’, Department of Families, Housing, Community Services and Indigenous Affairs, August. Available at <http://www.facs.gov.au/sa/seniors/progserv/PensionReview/Documents/pension_review/pension_review_paper.pdf>.
Hiebert P (2006), ‘Household Saving and Asset Valuations in Selected Industrialised Countries’, RBA Research Discussion Paper No 2006-07.
Lowe P (2011), ‘Changing Patterns in Household Saving and Spending’, Address to the Australian Economic Forum, Sydney, 22 September.
Plumb M and K Davis (2010), ‘Developments in Utilities Prices’, RBA Bulletin, December, pp 9–17.
Stevens G (2011), ‘The Cautious Consumer’, RBA Bulletin, September, pp 77–82.