RDP 2016-08: The Slowdown in US Productivity Growth: Breaks and Beliefs 6. Robustness
October 2016
- Download the Paper 1.59MB
6.1 Model-based Extensions
So far, we have presented results under the assumption that there has been a single break in US productivity growth and that agents may have failed to observe the break in real time. An alternative hypothesis is that there have been multiple breaks in steady-state productivity growth over our sample. For example, the break that we identify in agents' beliefs about productivity growth may actually represent a further break in steady-state growth. Alternatively, the strong productivity outcomes recorded in the 1990s might indicate that there was an increase in steady-state productivity growth at this time alongside a decrease at another time. To investigate these possibilities, we estimate a model allowing for two breaks in productivity growth.[14]
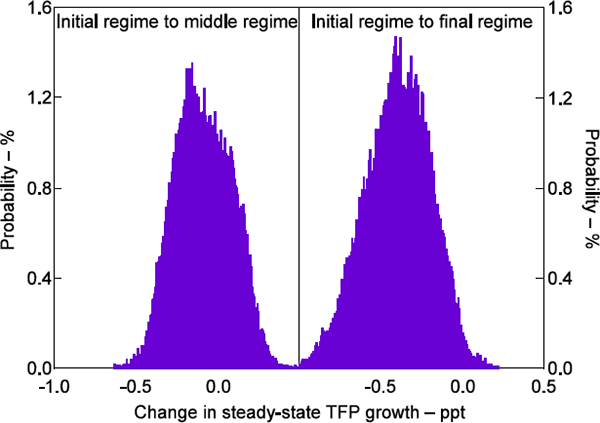
With two breaks in productivity growth we allow for three productivity regimes, an initial, a middle and a final regime. Figure 13 shows the estimated change in steady-state productivity growth between the initial regime and the middle regime (left panel) and the initial regime and the final regime (right panel). Clearly, the estimation struggles to identify more than a single break in TFP growth – the estimate of productivity growth in the middle regime is about as likely be larger than productivity growth in the initial regime as it is to be smaller. In contrast, there is a high probability that productivity growth in the final regime was lower than in the initial regime. The difference in productivity between the initial and final regime is also broadly in line with our baseline results. Overall, a single break appears to be sufficient to account for changes in productivity over our estimation sample.

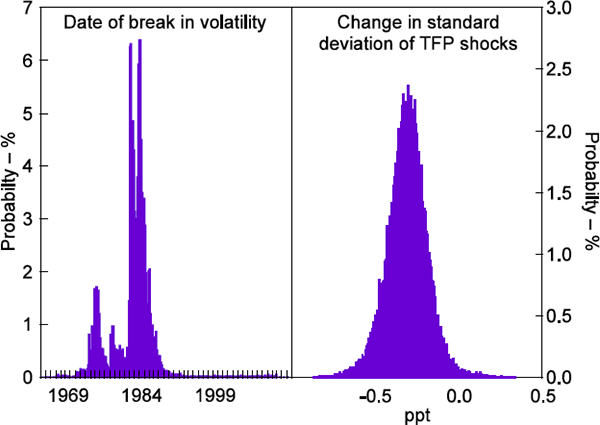
Our estimation sample spans the period before and after the start of the ‘Great Moderation’, when the volatility of many US macroeconomic series declined noticeably. One might wonder whether the shifts in productivity growth that we estimate might actually be accounting for time variation in the variance of productivity. To explore this possibility, we re-estimate our preferred model allowing for a break in the variance of productivity shocks. As one might expect, we find strong evidence that the variance of productivity shocks declined in the early 1980s (Figure 14). But allowing for a break in the variance of productivity growth has little effect on the estimated timing or magnitude of the break in steady-state productivity growth.
In estimation, we used a single measure of wages growth – hourly compensation of employees. In this regard we depart from the approach of Justiniano et al (2013), who use the same model as ours but in estimation include an additional observable wage series – average hourly earnings of non-supervisory employees. Figure 15 summarises our main results when we estimate our model using the same observable series as Justiniano et al (2013).
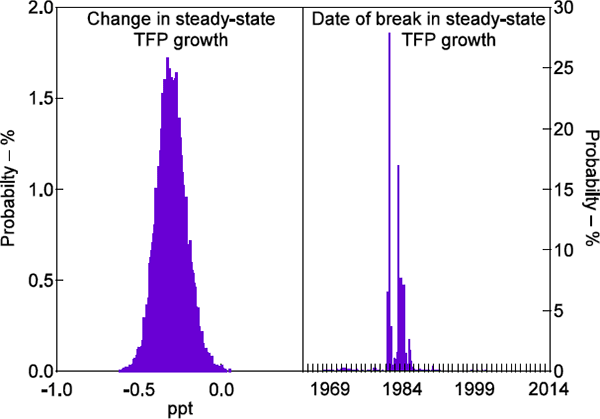
Including an additional observable wage series does not alter our inferences regarding the size of the change in steady-state productivity growth (left panel). If anything, the estimated probability that steady-state productivity growth has fallen is slightly larger in this specification. Moreover, our estimates of initial and final steady-state productivity growth are also largely unaffected.


However, our estimates of the date at which productivity growth decreased shift by around a decade, to the early 1980s.[15] We find it difficult to rationalise a break at this date. As we discuss in greater detail in Appendix F, we suspect that the estimation may be using the break to account for the lower mean of the hourly earnings series relative to the compensation series. This lower mean is likely, in part, to reflect the fact that the coverage of the hourly earnings series is less representative of the US workforce than the compensation series. As we do not want these compositional issues to affect our estimates it is appropriate to exclude this series from our baseline specification.
We have also experimented with alternative specifications that include: increasing the number of breaks allowed in estimation, adding long-term interest rates (which may contain information about expectations of future productivity growth) as additional observable variables and allowing agents to anticipate future shifts in steady-state productivity growth. All of these cases support our core findings of a decrease in steady-state productivity growth in the early 1970s and an adjustment of agents' beliefs about steady-state productivity growth some decades after that.
6.2 Other Considerations
There are a number of other issues that, while not amenable to formal econometric analysis in our model, warrant discussion and investigation in future work.
Since the mid 1980s, the labour share of income in the United States has fallen substantially (Elsby, Hobijn and Şahin 2013). A number of competing explanations for this development exist. These include: a fall in the relative price of information technology-related goods that has led firms to substitute labour for capital (Karabarbounis and Neiman 2014); a decrease in trade unionisation (Elsby et al 2013); rising housing costs (Rognlie 2015); and increased import penetration (Autor, Dorn and Hanson 2013; Elsby et al 2013).
Changes in steady-state productivity growth have only small, temporary effects on the labour share in our model. Therefore, the model attributes changes in factor shares to other structural shocks. Nevertheless, it is notable that the start of the decline in the labour share occurred shortly after the break that we identify in steady-state productivity growth. As discussed above, our identification of this break rests in large part on the behaviour of real wages.
Given the lack of consensus on the cause of the changes in factor shares observed in the United States over recent decades, we are hesitant to say whether allowing for these changes would affect our result. Our sense is that, as the break that we identify occurs prior to the large decrease in the labour share, our results are likely to be robust to such extensions. However, this is ultimately an empirical question. A particularly promising avenue for future research, given the results presented in Rognlie (2015), would be to incorporate a housing sector in the model. Understanding how changes in steady-state productivity growth affect relative housing costs, and how these developments relate to agents' beliefs about future productivity growth would be an interesting question in its own right.
Our results also raise the question of what factors and mechanisms may have prompted the decrease in steady-state productivity growth that we identify. Answering this question is beyond the scope of our model, which is designed to capture the effects of productivity growth rather than its determinants. However, the fact that we identify a break in growth in the early 1970s cautions against explanations that rely heavily on recent economic developments. For instance, a number of authors have argued that the US economy's weak productivity growth in recent years is due in part to the collapse in housing prices that occurred in the late 2000s (e.g. Fort et al 2013). They argue that this development reduced the supply of young businesses, as the owners of these firms often rely on home equity as a source of collateral and to establish credit lines. While this mechanism may well have affected US productivity outcomes in recent years, our results indicate that longer-term factors have also been important.