RDP 2016-08: The Slowdown in US Productivity Growth: Breaks and Beliefs 5. Implications of Lower Productivity Growth
October 2016
- Download the Paper 1.59MB
In this section we highlight some of the implications of lower steady-state productivity growth for the US economy.
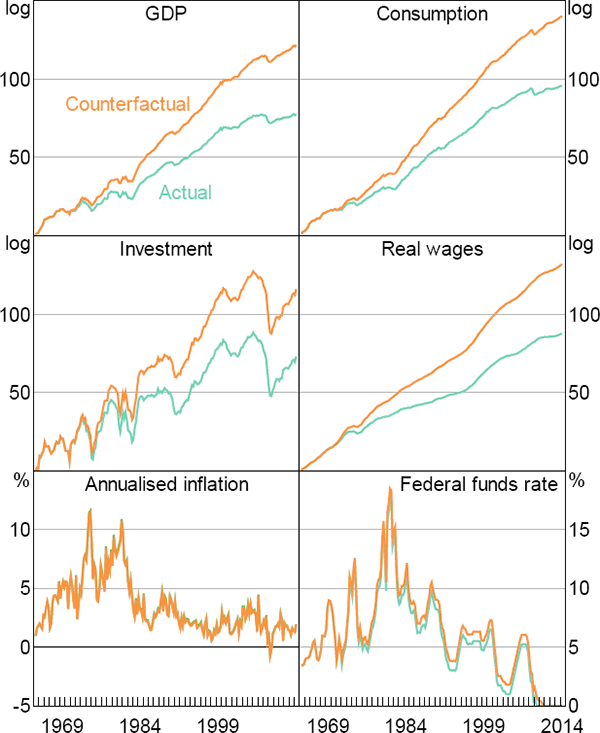
We first focus on how the break in productivity growth has affected the US economy over recent decades. Figure 12 presents counterfactuals that show how economic outcomes would have evolved without the break in productivity growth. The lines marked ‘actual’ show the actual paths of GDP, consumption, investment, real wages, inflation and interest rates since the mid 1960s. The lines marked ‘counterfactual’ adjust the actual path of these variables for the estimated effects of the break in productivity growth, incorporating the delay in the adjustment of beliefs.
Our estimates point to a halving of steady-state productivity growth. Cumulated over three decades, this implies a substantial fall in living standards relative to their counterfactual levels. For instance, the levels of per capita GDP and consumption would both be around 45 per cent higher if productivity growth had not declined. Moreover, our estimation attributes almost all of the stagnation in real wages over recent decades to the slowdown in productivity growth.
Aside from its effects on real variables, the counterfactual exercise also highlights the consequences of the decrease in productivity growth for monetary policy. Counterfactual interest rates tracked the federal funds rate closely until the late 1980s. From that point the two series diverge. By the mid 2000s, the counterfactual federal funds rate is almost 75 basis points above the actual rate. Without the slowdown in productivity growth, US interest rates would not have been nearly so low in the mid 2000s.
The implications are even more significant in the more recent period, in which the Federal Reserve has been constrained by the zero lower bound. The federal funds rate reached its lower bound in 2008:Q4. At that time, the counterfactual federal funds rate was still above 1 per cent. This rate did not reach zero until 2010:Q4. That is, without the slowdown in productivity growth, it appears that the Federal Reserve would have had more room to address the negative consequences of the Great Recession.

Sources: Authors' calculations; Bureau of Economic Analysis; Bureau of Labor Statistics
Looking forward, slower steady-state productivity growth implies a lower neutral real interest rate. For a given inflation target, this implies a lower neutral nominal interest rate. Unless the size of the shocks affecting the US economy become smaller than has been the case over recent decades, this means that the zero lower bound (ZLB) is likely to bind more frequently in the future than has been the case in the past.
To give a sense of the magnitudes, for both the initial and final steady-state productivity growth rates we conducted 10,000 model simulations of 240 quarters, setting all other parameters to their posterior median values. In the simulations we imposed a zero lower bound on nominal interest rates.[12] For each simulation, we record the number of times the nominal interest rate reached zero and the proportion of time the interest rate spends at zero.[13] Table 2 shows the results.
Our estimates suggest that the neutral real interest rate in the United States has fallen from 2.9 per cent before the early 1980s to 1.9 per cent today. Similarly, the neutral nominal interest rate has fallen from 5.5 per cent to 4.4 per cent. In the simulations, lower neutral rates substantially increase the frequency and duration of zero lower bound episodes. The average number of lower bound episodes per simulation increases from 2.5, or one every 25 years, to 4, or one ever 15 years. And the proportion of time spent at the zero lower bound roughly doubles.
| Regime | Neutral real interest rate | Neutral nominal interest rate | Number of ZLB episodes | Proportion of time spent at ZLB | ||
|---|---|---|---|---|---|---|
| Mean | Median | Mean | Median | |||
| Initial (γ= 0.59) | 2.90 | 5.45 | 2.5 | 2.0 | 2.6 | 1.2 |
| Final (γ= 0.33) | 1.86 | 4.39 | 3.9 | 3.0 | 4.7 | 3.2 |
Footnotes
We imposed the lower bound using the techniques described in Kulish et al (2014) and Jones (2015). In addition to imposing the zero lower bound constraint period-by-period, these techniques also account for the fact that agents may expect the zero lower bound to bind in future periods. [12]
We classify a zero lower bound episode as one in which the interest rate reaches the lower bound for the first time in at least eight quarters. That is, we categorise episodes in which the interest rate shifts from the lower bound to a positive value for just a few quarters before returning to zero as a single lower bound episode. [13]