RBA Annual Conference – 2016 China's Evolving Demand for Commodities Ivan Roberts, Trent Saunders, Gareth Spence and Natasha Cassidy[*]
- Download 706KB
1. Introduction
The slowing of the Chinese economy and falling global commodity prices in recent years have raised questions about the future of China as a stable source of demand for commodities. Many commentators have argued that China's growth will weaken further in the future, chiefly for structural reasons such as declining productivity growth (Wu 2015), a falling return to capital (Ma, Roberts and Kelly this volume) and the reversal of demographic tailwinds (Cai and Lu 2013). Even relatively optimistic analysts see the potential for future growth in China being concentrated in less resource-intensive activities such as services (Lardy 2014). This paper gives an overview of current issues affecting the composition of China's commodity demand and considers the implications of a different pattern of commodity imports in coming years.
China's role in global commodity markets is changing. Over the past decade, the Chinese economy experienced growth averaging 10 per cent per annum, driven by rapid urbanisation, industrialisation and greater openness to world trade. The fundamental drivers of Chinese growth – resource-intensive investment and manufacturing exports – underpinned a considerable increase in its demand for imported raw materials. As a result, the degree of China's participation in global commodity markets and its share of global trade in commodities rose substantially.
The China-led commodities boom had a tangible impact on many economies. First, during and after the global financial crisis of 2008–09, Chinese demand supported growth in economies that supply commodities, including Australia, Brazil, Chile and Canada. The surge in Chinese demand during this period reflected the government's macroeconomic stimulus, which underpinned rapid growth in residential construction and infrastructure investment and related manufacturing production, giving rise to strong imports of iron ore, coal and base metals.
An additional role that resilient commodity demand from China played in the late 2000s was to mitigate and reverse falls in commodity prices stemming from the unanticipated negative shock to growth in the advanced economies during the crisis (Figure 1). As the positive Chinese demand shock was largely unanticipated by resource exporters, the lagged global supply response for many commodities meant that the upward pressure on prices only began to unwind noticeably in 2011.
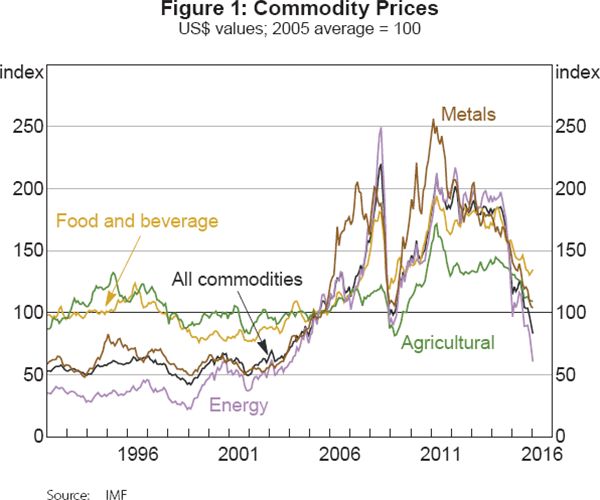
Sustained downward pressure on metal ore and energy prices in the past few years has in large part reflected expansions in international supply. But slowing Chinese demand has also been an important factor weighing on the prices of many commodities. Excesses in residential property investment that became apparent in the aftermath of China's 2008–09 macroeconomic stimulus generated a large oversupply of housing, which in turn prompted a decline in the growth of building investment and associated demand for steel (and hence iron ore). Chinese merchandise exports, which historically have also been an important driver of commodity demand, have been falling since early 2014 amid subdued global and regional economic conditions.[1] As broader economic activity has slowed in China, electricity consumption growth has moderated across all non-agricultural sectors, placing downward pressure on the demand for coal.
Declining Chinese demand for resource commodities has been augmented by policy efforts to mitigate the harsh effect of resource-intensive investment and production on the natural environment. In the case of iron ore, steel, base metals and coal, growth in bank lending has been curtailed, new investment has been restricted and high-emissions capacity has been forcibly reduced. Air pollution controls that limit coal use have been expanded, and surveillance of high-polluting metal manufacturing operations has increased.
In global oil markets, the effect of Chinese demand has been more subtle. Although China is now the second-largest importer of crude oil in the world (after the United States), most commentators attribute the sharp falls in crude oil prices since mid 2014 to supply-side factors including OPEC's decision to abandon oil price targeting and the impact of shale and tight gas discoveries in the United States and Canada on longer-term supply expectations (e.g. World Bank 2015). In fact, Chinese crude oil import demand surged in 2014, possibly preventing even sharper price falls, but more recently it has slowed in line with domestic economic conditions.[2]
A consequence of weaker economic prospects in China and policy commitments to reduce carbon emissions is that efforts to predict future growth areas in Chinese commodity demand focus on agricultural products and ‘new’ energy (e.g. Coates and Luu 2012). On this view, anticipated rises in wealth among households as China develops, a steady movement of the population towards urban areas and the increased policy emphasis on environmental sustainability will shift the composition of demand towards these commodities. In recent years, a rapid turn in Chinese energy policy in favour of renewables and low-carbon alternatives to coal has contributed to a marked increase in renewables capacity and rising imports of natural gas (at least until 2015). Global excess supply, and the effect of lower international oil prices, has placed downward pressure on prices of agricultural commodities and natural gas over the past couple of years,[3] but Chinese imports of some agricultural products have also grown strongly over this period.
In this paper, we consider the prospects for such a restructuring of Chinese commodity demand. We use panel techniques to estimate the historical relationship between a country's demand for various commodities and its stage of development. Projections based on the estimated relationships suggest that if Chinese commodity demand follows international historical patterns, and government targets for non-fossil fuels are achieved, an evolution of commodity demand towards food and low-carbon energy is indeed likely. This basic finding is robust to a range of alternative paths for Chinese income per capita.
Our work adds to a growing literature on the sources and implications of Chinese demand for commodities. A range of studies document an inverted U-shape relationship between a country's per capita metal consumption (or metal intensity per unit of GDP) and income per capita (Wårell and Olsson 2009; McKay, Sheng and Song 2010; Döhrn and Krätschell 2013; Jaunky 2014). McKay et al (2010) use historical panel data on steel consumption, GDP per capita and a number of other measures of activity for a large number of countries to project Chinese steel demand. Beidas-Strom (2014) uses similar models to assess the trajectory of Chinese metal and energy consumption. An analogous approach has been used to fit the data for food consumption (Cole and McCoskey 2013). We compare our findings to an alternative approach (the panel smooth transition regression method) used in recent efforts to estimate ‘environmental Kuznets curves’ (Destais, Fouquau and Hurlin 2007; Aslanidis and Xepapadeas 2008; Duarte, Pinilla and Serrano 2013). A contribution of our work is to apply a relatively consistent projection method to a range of different commodities (steel/iron ore, copper, aluminium, nickel, energy and food).
Finally, to draw out potential implications for Chinese–Australian bilateral commodity trade, we conduct a thought experiment in which Chinese imports from Australia move in step with changing patterns of domestic consumption. Assuming no change in relative prices and Australia's market share, these projections suggest that the implied increase in Chinese food and liquefied natural gas (LNG) imports partly offsets slowing growth in metal ore imports, but that resources still account for a larger share of commodity imports from Australia than food in the coming 10–20 years. Relaxing some of our assumptions, however, we argue that there is scope for food imports to start eroding the importance of traditional resource commodities within the coming decade.
The paper proceeds as follows. The next section gives an overview of recent trends in China's imports and domestic uses of a range of globally traded commodities. It also discusses factors and uncertainties conditioning the outlook for iron ore, base metals, energy and food/agricultural products, and describes how China's evolving policies could influence the trajectory and composition of commodity demand. Section 3 describes our projection method and extrapolates Chinese iron ore, energy and food consumption under a range of hypothetical trajectories for income per capita. Section 4 discusses how the changing structure of Chinese commodity demand may affect the future composition of bilateral Chinese–Australian commodity trade. Section 5 concludes.
2. China's Demand for Commodities: An Overview
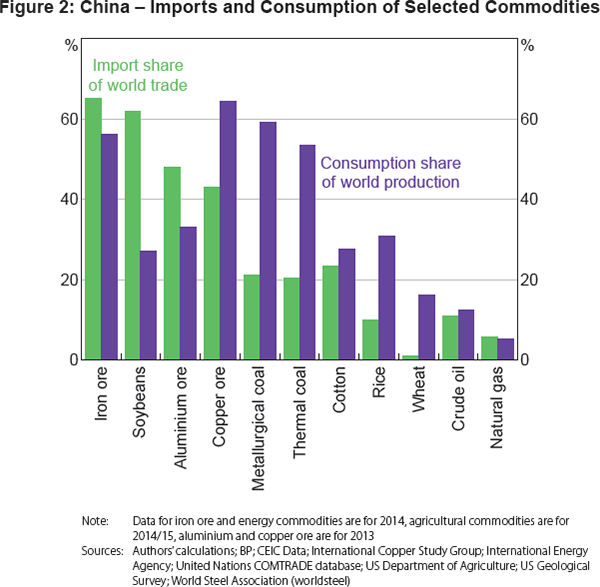
China accounts for a large proportion of global trade in natural resources such as iron ore, aluminium ore, copper ore and coal (Figure 2). For some commodities, such as coal, it tends to import significantly less than it consumes, reflecting substantial domestic production. While China is also a large producer of iron ore, the nature and location of its iron ore reserves mean that locally produced iron ore tends to be more expensive than that available on international markets. Similar constraints on local supply mean that China depends on imports for around two-thirds of its copper ore and aluminium ore needs.
In contrast, partly reflecting a policy to maintain self-sufficiency in certain grains, China at present plays a more limited role in global markets for food and agricultural feedstocks. Even so, a substantial import trade supports Chinese consumption of certain commodities such as soybeans and cotton. In energy markets, China has been rising in importance as a consumer and importer of oil and natural gas. But its historical dependence on coal for energy and the high use of other fossil fuels globally means that China accounts for a smaller share of activity in these markets than for many other commodities.
China's commodity consumption and trade have evolved in step with its pattern of development. China's growth since the period of ‘reform and opening’ was initiated in 1978 has been characterised by rapid growth of heavy industry and associated investment in equipment and buildings. Between 2000 and 2014, China's urbanisation rate rose from one-third to more than one-half, representing an average increase in the urban population of around 21 million per year.
Rural–urban migration has supported both urban residential construction and investment in transport and utilities infrastructure to service the needs of a growing urban population, boosting demand for commodities used in this investment. It has also imposed heavy requirements on China's power generation network. At the same time, rising efficiency of agricultural production and the long-term movement of citizens to higher-productivity employment in the non-agricultural sector have contributed to rising incomes and living standards (Brandt and Rawski 2008). This has influenced commodity requirements across a wide range of sectors, including metals, food products and energy.
Chinese imports of resource commodities have therefore grown significantly as a share of global trade since the early 2000s (Figure 3). For some commodities, such as iron ore, copper ore and aluminium ore, the increase in China's share has been a long-term trend, while for others, such as nickel ore, coal, oil and natural gas, the importance of China has become apparent more recently as demand has outpaced domestic production capabilities or as industrial processes have changed.
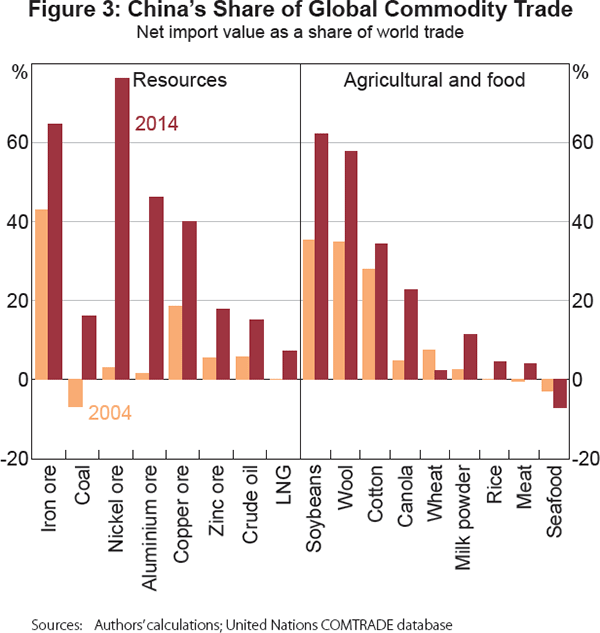
In the agricultural sector, China has become notably more dependent on imports for a wide range of commodities over the past decade. This tendency has been especially pronounced for oil-bearing crops such as soybeans used in the production of cooking oil, protein-rich animal feed and processed foods such as tofu, as well as wool. In contrast, China's role in world trade has remained modest for grain, meat, fruit and vegetables, as demand is still largely met by domestic supply. In some cases, however, China's import demand has increased rapidly from a low base, particularly for meat products and dairy products, such as powdered milk.
Consistent with the above trends, the composition of China's commodity imports has changed noticeably over the past decade (Table 1). Between 2004 and 2014, metal ores rose in importance in China's import mix, as domestic output of metal products increased, while the share of metal products in total imports declined. The share of mineral fuel imports increased, led by crude oil and accompanied by a rise in the share of coal and gas imports. Food imports have gradually risen in importance, while the share of other agricultural commodities has fallen.
| 2004 | 2014 | |
|---|---|---|
| Metal ores | 11.7 | 19.8 |
| Iron | 8.6 | 13.7 |
| Copper | 1.5 | 3.2 |
| Nickel | 0.0 | 0.7 |
| Aluminium | 0.0 | 0.3 |
| Zinc | 0.1 | 0.2 |
| Manganese | 0.4 | 0.4 |
| Lead | 0.3 | 0.3 |
| Metal products | 31.5 | 14.1 |
| Iron and steel | 19.2 | 4.8 |
| Base metals | 12.3 | 9.3 |
| Mineral fuels | 32.6 | 46.5 |
| Coal | 0.6 | 2.8 |
| Crude oil | 23.0 | 33.5 |
| Natural gas | 0.0 | 3.5 |
| Food | 13.8 | 14.8 |
| Cereals | 1.5 | 0.9 |
| Meat | 0.3 | 0.9 |
| Seafood | 1.6 | 1.0 |
| Dairy, eggs and honey | 0.3 | 1.0 |
| Beverages, spirits and vinegar | 0.2 | 0.4 |
| Other food | 9.9 | 10.7 |
| Other agricultural | 10.5 | 4.8 |
| Wool | 4.7 | 1.9 |
| Cotton | 1.4 | 0.5 |
| Animal skins, furs and hides | 3.3 | 1.4 |
| Live animals | 1.0 | 1.0 |
|
Notes: Total is defined as the sum of the current price value of metal ores, metal products, mineral fuels and selected food and other rural imports (specifically, harmonised codes 1–24, 26–27, 41, 43, 51–52 and 72–81); precious metals are excluded Sources: Authors' calculations; United Nations COMTRADE database |
||
2.1 Iron ore and steel
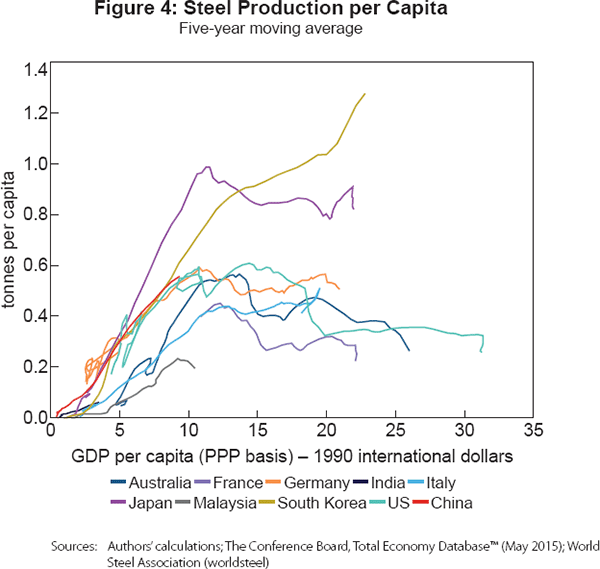
Due to the predominance of the blast furnace-basic oxygen converter production technique in China, steel is primarily produced using iron ore and metallurgical (or coking) coal as inputs. Chinese iron ore demand is mainly driven by steel production for domestic use and for the export market. While broadly similar in magnitude to increases that have occurred in other economies that have industrialised, the run-up in steel production (scaled by population) has occurred at lower levels of income per capita than other economies (Figure 4).
The primary sources of demand for steel in China are construction (which accounts for more than half) and manufacturing, particularly machinery and automobiles (Table 2). The importance of construction as an end use in recent years reflects China's rapid urbanisation. While growth in urban residential construction is one important source of steel demand, the process of urbanisation is correlated too with the growth of public infrastructure including rail, highways and public buildings, which also involve the intensive use of steel and other metal products.
| 2000 | 2010 | 2014 | |
|---|---|---|---|
| Construction | 56 | 56 | 55 |
| Machinery | 15 | 18 | 19 |
| Automobile | 6 | 7 | 7 |
| Home appliance | 3 | 1 | 1 |
| Rail | 2 | 1 | 1 |
| Energy | 7 | 4 | 5 |
| Shipping(a) | 3 | 5 | 2 |
| Other | 8 | 8 | 11 |
|
Note: (a) We define ‘shipping’ as the sum of the ‘container’ and ‘shipbuilding’ categories Source: China Metallurgical Industry Planning and Research Institute, reported by Li (2015) |
|||
China is itself a major producer of iron ore and possesses extensive reserves, but these have relatively low average iron content, which increases the cost of processing.[4] In addition, the location of iron ore reserves in the north and west of China makes it costly to transport ore to steel mills elsewhere in the country. As a result, the imported share of iron ore supply (measured in terms of equivalent iron content) has increased from approximately one-quarter in the early 1990s to at least one-half currently.[5] Reflecting both the quality and proximity of Australian iron ore production, roughly two-thirds of China's imported iron ore is currently sourced from Australia (Figure 5).
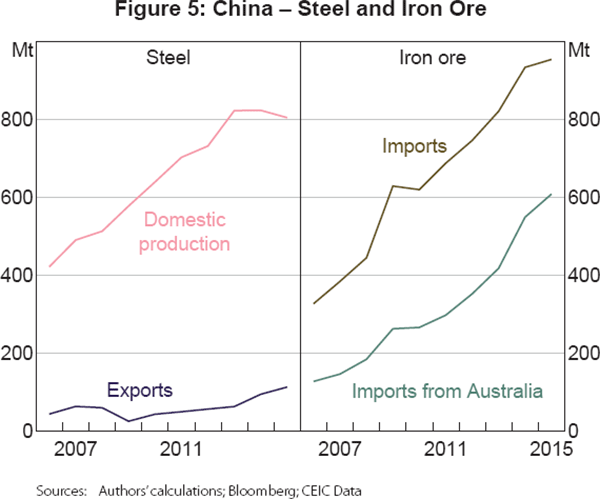
Chinese iron ore imports have grown strongly in recent years, supported by the government's macroeconomic stimulus policies and the falling cost of imported iron ore. But the slowing of activity in China over 2014 and 2015, led by the residential construction and manufacturing sectors, has weighed on steel demand. Crude steel production was flat in 2014, and fell by 2.3 per cent in 2015 despite a strong increase in steel exports. Domestic consumption of steel fell by 5.4 per cent in 2015.[6] While imports of iron ore have continued to increase (including from Australia), demand for iron ore looks to have fallen as declines in domestic production have outweighed the increase in imports.[7]
The widespread perception that economic growth will continue to ease has raised doubts about the future of Chinese steel and iron ore demand. Thus a view has emerged among analysts in China that steel production has already ‘peaked’ or is close to peaking, and is destined to fall in the years ahead (Li 2015; Zhang, G 2015). On this view, China's transition to a more consumption- and services-driven economy implies a reduction in its steel intensity. This contrasts with long-term cross-country comparisons suggesting that Chinese steel production and consumption have scope to increase before approaching the (population-scaled) levels of Japan and South Korea. Some analysts argue that such cross-country comparisons are misleading, as the economies to which China is compared have historically exported a much larger share of their steel production than has been the case for China (Batson 2015). In contrast, large iron ore producers such as Rio Tinto and BHP Billiton forecast that steel production will continue to rise for many years, based in part on projected further strength in steel exports (Chambers 2015; Ng and Riseborough 2015).
2.1.1 The outlook for steel and iron ore
In the near-to-medium term, there are a number of reasons for downward pressure on steel production to persist. First, the extent of developers' stock of unsold housing in some regions is large, implying that residential property markets may face conditions of oversupply for a sustained period (Chivakul et al 2015; Wu, Gyourko and Deng 2015). Second, industrial output has weakened sharply since late 2014, with particular weakness in industries exposed to residential and non-residential construction. Even aside from the recent property sector downturn, excess capacity in manufacturing has led to a trend slowing in manufacturing investment since 2010. Third, there are doubts about the sustainability of the rebound in steel exports in 2015, as the latter could falter if the business ceases to be profitable (for example, due to continued falls in steel prices) or if importing countries erect trade barriers against China to protect their domestic steel industries. Reflecting these influences, the steel industry experienced declining profitability in 2015 and faces a protracted consolidation.
In the longer term, a number of factors can be expected to support a relatively high level of steel production and consumption in China. One such factor is continued urbanisation. To the extent that this process underpins longer-run growth in demand for residential housing, motor vehicles and manufactured items, it will increase the country's overall steel requirement or help offset declines due to other factors. However, a continued upward trend in the urbanisation rate cannot be taken for granted, in part because the starting point is clouded by measurement issues. On the one hand, there is evidence that as much as a quarter of reported increases in the urbanisation rate since the 1990s represented the statistical reclassification of areas from ‘rural’ to ‘urban’ and adjustment of urban definitions rather than the physical relocation of residents (Chan and Hu 2003; Qin and Zhang 2014). On the other hand, estimates by the OECD (2015) suggest that the share of the population living in ‘functional urban areas’ within the gravitational pull of major cities could already be as high as 61 per cent. Even if the official urbanisation rate of 56 per cent is accurate, the urbanisation process is responsive to a range of factors including, for example, reform of the hukou (household registration) system and the availability of employment opportunities in urban areas relative to rural China.
A second factor that will support the long-run demand for steel is public spending to close gaps in national infrastructure. The share of paved roads in China remains well below that observed in more developed Asian nations such as Japan and South Korea, as does the degree of access to sanitation and water facilities (Wilkins and Zurawski 2014). The government has committed to expand municipal infrastructure investment (which accounts for about one-third of total infrastructure fixed asset investment), particularly subterranean infrastructure such as pipes, sewage works, flood management systems, roads and bridges (State Council 2013c; Government of the PRC 2014). As part of its strategy to develop China's interior, the authorities continue to devote substantial resources to building rail infrastructure, with plans to extend high-speed rail to cover all cities with a population of 500,000 or more by 2020. There is also scope to expand urban rail networks, which are less developed in China's major urban centres than other large international cities (Wilkins and Zurawski 2014).
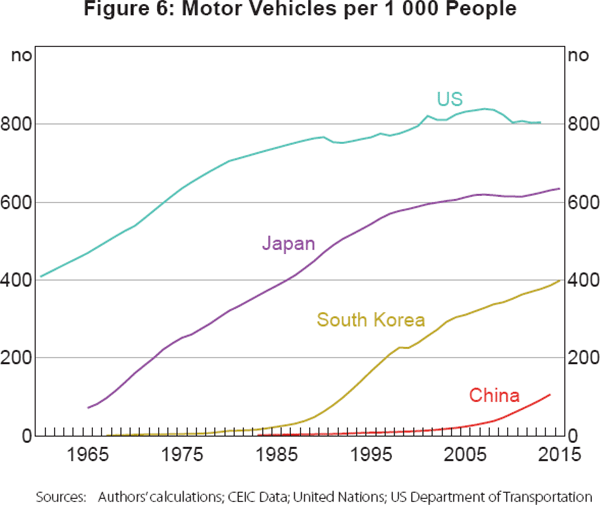
A third factor is motor vehicle use. While it currently accounts for a modest share of domestic steel consumption, rising automobile use will contribute to longer-run demand for steel. The near-term outlook will be conditioned by the broader impact of slowing growth on consumer demand. Nonetheless, China's highway network has capacity to accommodate expanded automobile use: China has 2.8 million kilometres of paved roads for around 127 million motor vehicles, compared with 2.6 million kilometres of paved roads for 256 million motor vehicles in the United States. International comparisons suggest that per capita vehicle ownership in China would need to increase substantially even to approach levels observed in the United States, South Korea and Japan (Figure 6).[8]
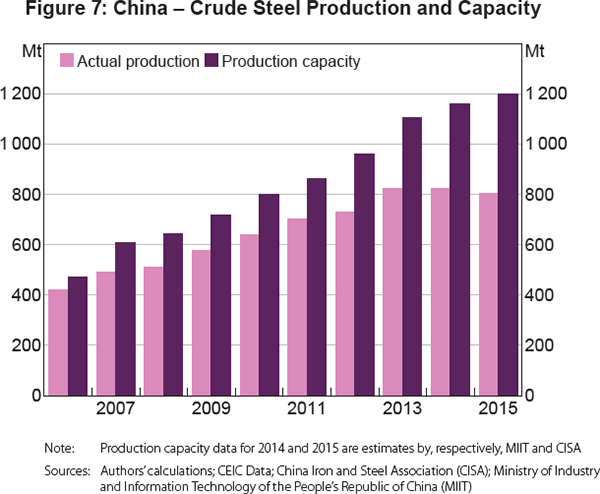
Notwithstanding the above positive factors, Chinese steel production in coming years will also face countervailing downward pressure from government policies favouring consolidation of the industry. In the past decade, crude steel capacity has increased at a faster rate than actual production (Figure 7). In addition to resolving to reduce excess capacity, in recent years policymakers have also turned their attention to environmental protection given mounting public discontent about pollution and increased evidence of environmental degradation (see Section 2.4). In essence, this involves reducing energy consumption and eliminating energy-inefficient or obsolete production capacity through increased monitoring, forced closures and also by encouraging consolidation of smaller steel enterprises.[9]
Aside from factors affecting steel production, future growth in iron ore demand is subject to an independent source of downward pressure: increased secondary production of steel using scrap. Steel mills in the United States and Europe make extensive use of electric arc furnace technology, which allows between one-half and two-thirds of crude steel to be produced using scrap (and other inputs). By comparison, in China more than 90 per cent of crude steel is produced by steelworks using basic oxygen converters (World Steel Association 2015), which require iron ore as a primary input.
The reasons for limited use of scrap in China to date include the fragmented nature of the scrap recycling industry, limited and inconsistent policy support,[10] the high price of domestic and imported scrap relative to iron ore and metallurgical coal, and limited participation by equipment manufacturers in the recycling process.[11] Domestic availability of scrap is constrained by the fact that as much as two-thirds of the stock of steel in China was added between 2006 and 2010 and many of the associated appliances, buildings and infrastructure have not yet reached end-of-life (Wübbeke and Heroth 2014). Another reason is the practical difficulty of recycling certain forms of steel that are in common use in China, such as steel bars used to reinforce concrete for buildings (Stanway 2015). Thus, while China's 12th Steel Industry Five-Year Plan (2011–15) called for a rise in scrap utilisation, the ratio of scrap use to crude steel production actually fell from around 14 per cent in 2011 to 11 per cent in 2014 (Bureau of International Recycling 2013; Kong 2015). Nonetheless, policy efforts to improve scrap collection, and the sheer amount of secondary ferrous material that is likely to become available in coming years, are likely to support a gradual increase in the scrap ratio over time towards international levels.
2.2 Base metals
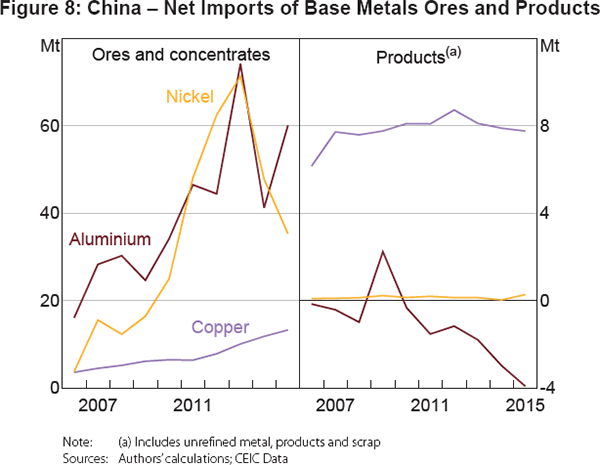
China plays a prominent role in global base metal markets. By value, China's largest base metal commodity imports are aluminium, copper and nickel ores and products. Overall, similar to crude steel and iron ore, the demand for base metals (especially ores and concentrates) grew strongly in the years following the 2008–09 macroeconomic stimulus, driven in part by residential construction and manufacturing production. More recently, import volumes have declined or their growth has slowed in line with weaker growth of domestic activity (Figure 8).
Base metal product imports and prices have been affected by two additional factors. The State Reserve Bureau (SRB) buys significant (undisclosed) quantities of base metals, including copper, aluminium and nickel (Angel 2012; Els 2013; Yam 2013). The SRB reportedly bought large supplies of base metals after the global financial crisis and has resumed purchases more recently as commodity prices have eased (Farchy 2013). Another practice that has been especially prominent in the post-2008 period is the importing of base metal products by firms to arbitrage international interest rate differentials through collateral financing deals (e.g. Lian and Wong 2014).
2.2.1 Aluminium
China is the world's largest producer and consumer of aluminium products. The domestic market is generally viewed as oversupplied, and in recent years China has become a sizeable net exporter of aluminium products.[12] Rising domestic aluminium production has led to a sharp pick-up in imports of aluminium ores and concentrates (bauxite and alumina) since the late 2000s. The construction sector is the largest source of demand for aluminium in China, followed by power and electronics, while transportation, household appliances and machinery account for the bulk of the remainder (Tse 2015).
2.2.2 Copper
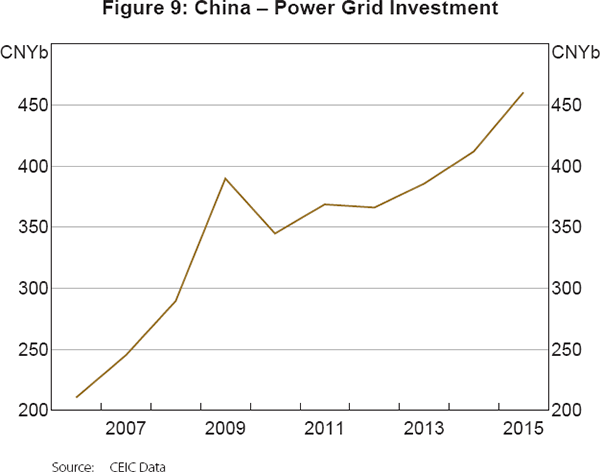
China has limited reserves of copper and therefore sources the bulk of its supply of copper ore and concentrates from abroad. It also imports scrap and waste copper in significant quantities. Copper is primarily consumed in the power sector, although it is also used intensively in the household appliances, transportation, construction and electronics sectors (Tse 2015). Around 60 per cent of semi-fabricated copper products are used for the purpose of conducting electricity (Trussell 2013). In addition to financial incentives and government-sponsored warehousing, growth in copper demand has over time been linked with power grid construction, which itself has increased in line with the requirements of the growing urban population and heavy industry (Figure 9).
2.2.3 Nickel
Chinese demand for imported nickel ore has also grown rapidly over the past decade from a very low base. The primary source of demand for nickel ore is stainless steel.[13] Imported nickel ore is primarily used in China to produce nickel pig iron (NPI) via electric arc or blast furnace techniques. The bulk of high quality nickel ore is produced by Indonesia and the Philippines. Rising utilisation of NPI by Chinese producers as an alternative to (more expensive) pure nickel in the production of stainless steel saw China move from being a relatively minor stainless steel producer to the world's largest manufacturer, accounting for more than half of global production, in the space of a decade. However, the 2014 decision by Indonesian authorities to ban exports of mineral ores (including nickel ore) has contributed to sharp falls in Chinese nickel imports, and has brought into question the sustainability of Chinese stainless steel production.
2.2.4 The outlook for base metals
Although demand for imported base metals is likely to come under pressure as growth moderates, there is scope for official efforts to develop and upgrade power infrastructure to provide some offsetting support. In September 2015, the government pledged to spend CNY2 trillion on improvements to power grid infrastructure over the 2015–20 period. As of mid 2015, construction had begun on four (of an eventual nine) west-east ultra-high voltage (UHV) power lines that would allow more efficient energy transmission over long distances (Xinhua News Agency 2014; Chu 2015).[14] These developments will contribute to demand for both copper and aluminium, as high voltage transmission lines also use aluminium cables and wires intensively (China Aluminium Network 2014). The push by policymakers to develop renewable sources of energy could likewise have a positive impact (see Section 2.3), as renewable energy generation tends to be more intensive in the use of certain base metals, such as copper, than fossil fuel-based generation (Trussell 2013).[15]
However, for the aluminium smelting industry, another important factor is that the industry has been marked by the government as an ‘overcapacity’ sector needing consolidation (State Council 2013a). Combined with the fragmentation of production across many small and medium-sized enterprises, high water and electricity requirements have made aluminium smelting a target for policymakers seeking to improve the environmental sustainability of heavy industry. Efforts to reduce excess capacity in aluminium smelting are being conducted via a number of measures, including credit restrictions, regulation of electricity pricing and a prohibition on local governments providing discounted electricity supply to local smelters (particularly those with geographic access to supplies of renewable energy such as hydro-electricity).
2.3 Energy
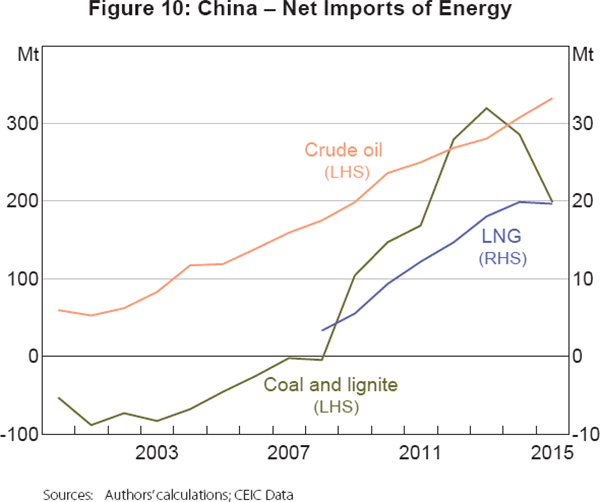
China imports energy commodities such as crude oil, coal and natural gas in large quantities. Crude oil imports have risen steadily over the past decade, whereas coal and natural gas imports increased sharply in the late 2000s from a low base but have trended lower over the past 1–2 years (Figure 10). By value, crude oil and petroleum account for the bulk of energy imports, but domestic energy consumption is heavily tilted towards coal. China relies on coal for 75–80 per cent of its electricity generation, which is high by international standards.[16] In 2014, coal accounted for two-thirds of domestic energy consumption, while crude oil, hydro-electricity and natural gas accounted for 17 per cent, 7 per cent and 6 per cent.
2.3.1 Coal
Around 43 per cent of coal consumption is accounted for by large-scale electricity generation, with a similar proportion used in the manufacturing sector, predominantly heavy industry, as a means of onsite power generation.[17] The dominance of coal as a source of energy reflects the country's substantial natural endowments. Prior to the late 2000s, China was largely self-sufficient in coal, and was a net exporter, chiefly of thermal coal. However, by 2009, imports of a range of coal grades had increased sharply. This surge reflected a combination of factors, including the rise in steel production, a significant decline in international freight rates, lower Chinese production of coal due to consolidation in the coal sector, and mine closures or renovations for safety reasons.
The increased attractiveness of coal imports (relative to domestic production) partly reflected geographic factors that had increased the relative cost of domestic supply. Despite having extensive reserves of coal, the majority of deposits are located in the north and west of the country, which means that coal has typically been transported to the north-east coast and then shipped by sea to southern locations (Tu and Johnson-Reiser 2012).[18] The bulk of coal is still sourced locally, but rising Chinese coal imports have nonetheless had a significant impact on the global coal trade. China's imports of coal account for less than 5 per cent of domestic coal consumption (Figure 11), yet in recent years they have accounted for almost one-third of the global trade in coal.[19]
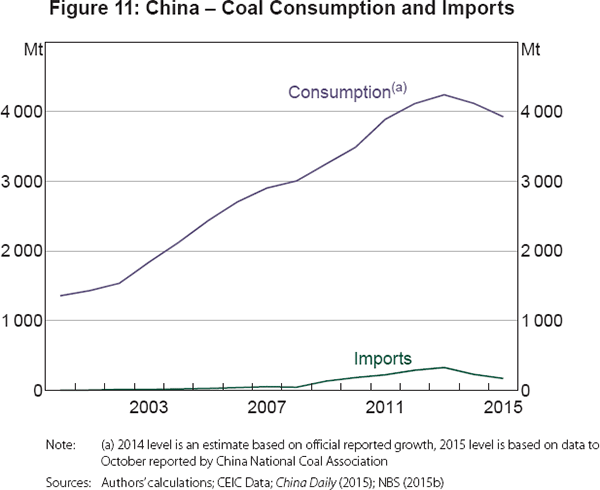
Official estimates suggest that in 2014, Chinese coal consumption recorded its first annual decline in over a decade, and industry estimates indicate a further weakening in 2015 (China Daily 2015). Domestic coal producers have experienced dwindling profitability (a trend which began in 2012) and official data suggest that around a third of coal enterprises are currently making losses. Imports have declined even more sharply than domestic consumption. The falls are consistent with weaker overall growth in electricity demand in a slowing economy, but also the shifting composition of energy demand towards crude oil, natural gas, renewables (hydro-electric, wind and solar) and nuclear power.
2.3.2 Oil
In global oil markets, the role of China has also grown over time. China's own proven reserves of crude oil are substantial, and increasing, but domestic production has been outpaced by growth in demand.[20] Until recently, total oil consumption was moderate compared to that of many advanced economies. But industrial and automotive use has increased at a time when the larger domestic oil fields are maturing and the growth of production has fallen from earlier higher rates. Imports of crude oil have therefore risen sharply, more than doubling since 2004. China's net imports are now the second largest in the world after the United States, while its oil consumption is two-thirds that of the United States (BP 2015).
Growth in crude oil imports has been supported by official efforts to achieve energy security. To provide a buffer against global supply disruptions, the government has been building a strategic petroleum reserve since the early 2000s. By mid 2015 the official reserves were reported to be 191 million barrels of crude oil (NBS 2015a), equivalent to several weeks of net imports, and there were plans to expand coverage to at least 100 days' worth of net imports by 2020 (China Economic Information Network 2015). The large state-owned oil companies also have sizeable storage capacity, with some estimates in the range of 350 million barrels (EIA 2015).[21]
2.3.3 Natural gas
Chinese demand for imported natural gas has grown strongly in the years since China first started importing the fuel in 2006. Low historical use of natural gas reflected a lack of infrastructure, especially long-distance pipelines connecting gas fields located in the inland central and western regions to major cities in the eastern coastal regions. Up to the end of 2014, LNG and piped gas consumption and imports increased rapidly, driven by industrial use.[22] This has prompted efforts to secure large quantities of piped gas from Russia and central Asia and has led importers to sign long-term LNG contracts with a range of suppliers, including Australia. In 2015, however, LNG imports fell in line with the overall slowing of growth in industrial production and energy demand.
2.3.4 The outlook for energy commodities
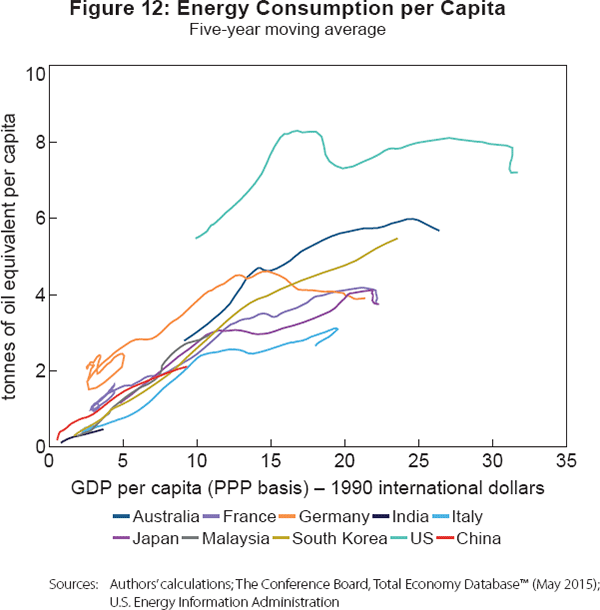
Currently, China's per capita energy consumption is low relative to many advanced economies, suggesting that there is room for expansion as the economy develops (Figure 12). Yet growth of total primary energy consumption has already eased in line with broader activity, falling from over 7 per cent at the start of the current decade to a little more than 2 per cent in 2014. Further moderation of economic growth can be expected to place downward pressure on growth in energy demand, at least in the near term. Likewise, government policies to respond to citizens' concerns about harmful effects on the environment and quality of life are likely to change both the growth and composition of energy consumption in coming years.
In 2006, China overtook the United States as the world's leading source of carbon emissions, and since 2009 carbon dioxide emissions from Chinese coal combustion alone have exceeded national carbon emissions in the United States (Tu and Johnson-Reiser 2012). Per capita emissions are now similar to levels in the European Union. In recent years, the government has moved to restrict carbon emissions and reduce the weight of coal in China's energy mix, including by becoming party to international treaties to reduce carbon emissions, such as the 2015 Paris Agreement to implement legally binding emissions targets.
The government also hopes to achieve these targets through increases in renewable energy generation capacity. The ‘Energy Development Strategy Action Plan’ released by the State Council (2014) called for large increases in renewable and nuclear capacity, including hydro, wind and solar energy generation.[23] The Plan also stated a target for non-fossil fuel sources to generate 15 per cent of energy supply by 2020 (Table 3), while separate announcements have pledged a 20 per cent non-fossil fuel share by 2030 (White House 2014). Since the late 2000s, the government has introduced a range of support measures (including financial incentives) for solar and wind power industries (Mathews and Tan 2015, pp 99–100). In late 2015, the government further pledged to implement a ‘green dispatch’ system prioritising (lower cost) renewable energy sources over (higher cost) coal-fired generation on the energy grid (White House 2015).
| 2000 | 2014 | 2020(a) | |
|---|---|---|---|
| Coal | 68.5 | 66.0 | 62.0 |
| Crude oil | 22.0 | 17.1 | 13.0(b) |
| Natural gas | 2.2 | 5.7 | 10.0 |
| Renewable, nuclear and other | 7.3 | 11.2 | 15.0 |
|
Notes: (a) Official targets Sources: Authors' calculations; CEIC Data; State Council (2014) |
|||
Moreover, the authorities have implemented direct restrictions on coal use. In September 2013, as part of its ‘action plan’ for addressing air pollution, the State Council pledged to reduce coal consumption to 65 per cent of primary energy consumption by 2017 (MEP 2013). In March 2014, the government committed to shut down 50,000 small coal-fired furnaces. In late 2015, the government pledged to reduce coal-fired power emissions by 60 per cent by 2020 and to set tighter efficiency targets for electricity production.[24]
Efforts to address environmental problems and reduce carbon emissions are likely to lead to changes in the composition of China's energy imports and, in particular, place downward pressure on imports of coal and oil over the longer term. The transition away from heavily polluting fossil fuels may also increase demand for imported natural gas, which produces significantly lower carbon emissions than coal or oil.[25] But natural gas will face significant competition from renewables, which have seen sizeable increases in capacity in recent years, and have received broad-based government support.
As different types of fuel are often substitutes, China's energy mix will also be affected by international and domestic relative prices. China's retail oil prices have become more closely linked with international prices over time,[26] but deregulation of domestic gas prices has proceeded at a slower pace.[27] The impact of further energy price deregulation on the extent and composition of energy consumption is uncertain. For example, higher relative urban gas prices could stimulate investment in the sector, but they could also lead to substitution by consumers towards cheaper alternatives.
Another uncertainty relates to the development of new domestic sources of fuel. China has substantial reserves of coal bed methane and shale gas, which if developed could compete with piped natural gas and imported LNG. In recent years, the government has also approved numerous coal-to-gas conversion projects. Despite the potential for these industries to contribute to domestic energy supply, they remain at an early stage of development, constrained by technical challenges and gaps in transport infrastructure (EIA 2015).
2.4 Food and agricultural products
Currently, China plays a more limited role in global agricultural markets than it does in markets for metal ores and energy. The modest reliance on imports of food commodities reflects the fact that the government has historically placed a high value on food security and has a longstanding policy of stockpiling key products in state storage facilities. To maintain basic self-sufficiency in food production, the government subsidises production in the agricultural sector, particularly to support production of grain, oilseeds, hogs and meat products (Li 2014). As part of a suite of policies aimed at supporting the agricultural sector in place since the early 2000s (the san nong policies), the government has provided subsidies to farmers for seed, fertilisers, pesticides, feed and energy. The central bank has also created incentives for financial institutions to prioritise credit to the farming sector.
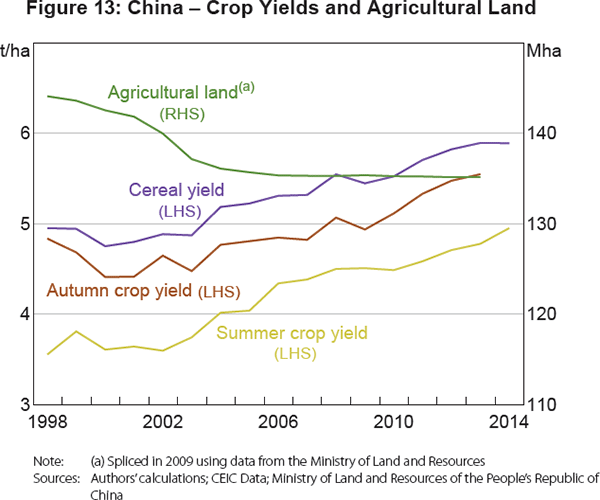
These policies have contributed to rapid growth in domestic supply. Between 2005 and 2015, the annual grain crop has grown by nearly 30 per cent. In contrast, agricultural land has declined as a share of total land due to soil erosion, desertification and conversion for industrial and urban use.
Declining land for agricultural use has coincided with falling growth in the prime-aged agricultural labour force as farmers have migrated to urban areas in search of off-farm work (Park, Cai and Du 2010). Thus, increased agricultural production has been underpinned by increases in yields (Figure 13).
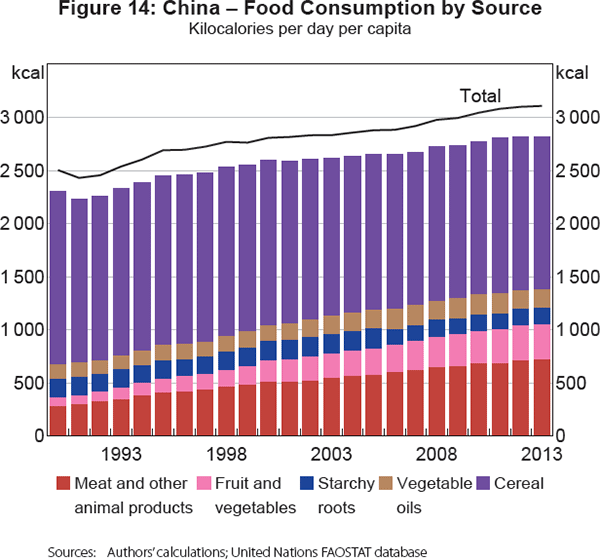
Rising demand for food in China has stemmed from both the growing population and improved living standards, which have led to higher consumption of protein (particularly meat) and a shift in patterns of food consumption towards more western-style diets (Figure 14). Data from the Food and Agriculture Organization of the United Nations (FAO) indicate that between 1990 and 2013, total Chinese food consumption per capita (measured in calories) increased by 24 per cent, while consumption of protein per capita grew by a similar amount, and consumption of starchy foods, such as cereals and tubers, declined. These changing patterns have been correlated with improved efficiency, quality and safety in food supply (through modern food marketing chains and the growth of supermarkets) and increased consumption of meals away from home (Hamshere et al 2014).
In recent years, the government has made a public commitment to ensuring that China's cultivated land does not fall below a ‘red line’ of 120 million hectares.[28] It has also committed to continue closely managing purchases and stockpiling of grains, edible oils, cotton, sugar, pork and chemical fertilisers. But changing consumption patterns, and the impact of environmental degradation on arable land and food safety, have made China's historically low reliance on imported agricultural commodities unsustainable. Accordingly, the government's revised food security strategy in 2013 acknowledged the need for imports to supplement domestic production and meet changing consumer demand while emphasising the primacy of domestic production as a source of food.
2.4.1 The outlook for food and agricultural commodities
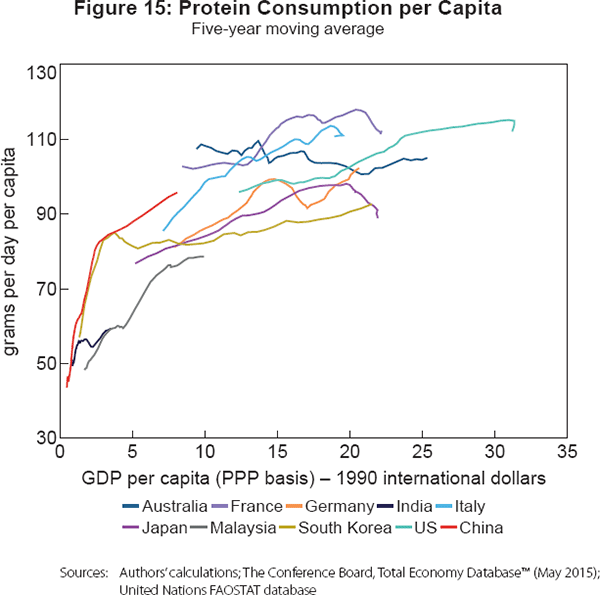
As per capita incomes rise, the consumption of protein-rich foods tends to increase. In China's case, protein consumption has increased rapidly, reaching or exceeding per capita levels exhibited by other countries at a comparable stage of development (Figure 15). While per capita protein consumption may increase more gradually in coming years, continued population growth is likely to underpin strong growth in the total amount consumed, and underpin demand for imported food commodities. Such trends are likely to be reinforced by a series of food safety scandals since 2008 (including cases of contaminated infant formula and meat supplies), which have contributed to strong demand for imported meat and dairy products.[29]
China currently sources most of its meat from domestic production, but a shift towards higher meat consumption has already begun to support increased imports of meat, live animals and animal feed (such as maize).[30] Similarly, imports of dairy products have surged over the past decade, with milk powder accounting for half of the increase and other products such as cheese, butter and yoghurt accounting for the remainder.
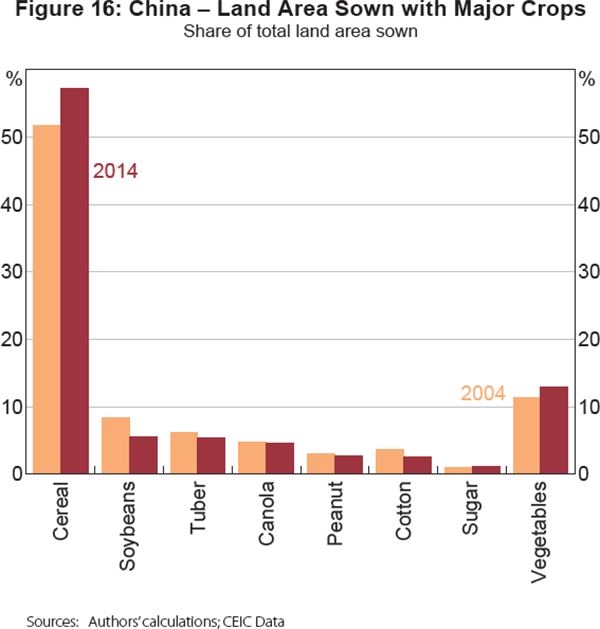
In a period of flat or declining agricultural land supply, and moderating labour input, continuous increases in yields are needed to expand domestic production of the full range of agricultural crops. As China still lags other countries in the relative efficiency of production for some crops, there is scope for crop yields to continue to grow.[31] But constraints on land supply could support imports of certain commodities, particularly those crops (for example, oil-bearing crops such as soybeans, canola or peanuts, and cotton) which are already experiencing flat or declining domestic land area sown (Figure 16).
Indeed, the environmental obstacles facing domestic agricultural production could increase the scope for imports of agricultural commodities in coming years. According to some estimates, almost 7½ per cent of farming land is irrigated with polluted water (Xie 2009, p 21). Water is polluted by industrial run-off, widespread overuse of fertilisers in farming and waste from intensive livestock rearing (Ongley and Yu 2013). The Chinese Ministry of Land and Resources estimates that levels of water quality have been falling since 2011. Water at almost 60 per cent of groundwater monitoring stations was classified as ‘poor’ or ‘extremely poor’ in 2013, implying high levels of certain minerals including iron, manganese, sulfates and lead (China Daily 2014).
Soil pollution is also a growing problem: according to the Ministry of Land and Resources and Ministry of Environmental Protection (MLR and MEP 2014) up to 16 per cent of China's soil and 19 per cent of its arable land is polluted with industrial pollutants such as cadmium, nickel and arsenic.[32] Recognising the over-exploitation of land and water resources, in late 2015 the government announced an amendment to its strategy for food security, promising subsidies to farmers who allowed crop land to be idled or rotated with legumes to restore nitrogen to the soil during periods of abundant grain supply (People's Daily 2015).
3. Projecting Chinese Demand for Commodities
To consider possible future trajectories of Chinese demand for commodities and the sensitivity to different growth paths, we consider a range of simple econometric projections and scenarios. Our projection method embodies two steps.
In the first step, we conduct a cross-country regression of per capita consumption (or production) of a given commodity on some function of GDP per capita. We construct estimates for physical volumes of crude steel, aluminium, copper and nickel, quantities of energy (in tonnes of oil equivalent) and quantities of food (in calories).[33] The time period and number of economies for which we have data differs by commodity, but in general we use unbalanced panels including at least 40 economies over a period of no less than 40 years (see Appendix A). In the case of crude steel, we construct estimates for steel production, while for all other commodities our results are for consumption.
The different treatment of steel reflects our interest in steel production as a source of Chinese demand for iron ore. While some countries rely heavily on imports of finished steel or steel scrap to satisfy domestic demand for steel products, China predominantly imports raw inputs for use in blast furnace crude steel production (iron ore and metallurgical coal) rather than steel products or scrap.[34] Another reason for modelling production rather than consumption in this case is that China has grown in significance as an exporter of steel, whereas its exports of most other commodities account for a comparatively modest share of global trade.[35]
Following the literature on commodity demand and the ‘environmental Kuznets curve’, we choose a non-linear functional form to model the historical relationship between commodity consumption or production and economic development. We consider two approaches to the selection of this functional form.
The first approach utilises a basic panel fixed-effects specification. For most commodities, we use a specification that has, with minor variation, become relatively standard in the literature on commodity demand. In the case of steel, aluminium, copper, nickel and energy we express per capita consumption or production as a quadratic function of GDP per capita. This is consistent with the approaches of McKay et al (2010) and Döhrn and Krätschell (2013) for steel production or consumption.[36] Beidas-Strom (2014) uses a similar approach for other metal and energy commodities.[37] The quadratic functional form implies that after a certain level of income per capita is attained, commodity consumption declines. For aggregate food consumption per capita, we instead apply an inverse functional form, which imposes a less symmetric curvature upon the food intensity and income per capita locus than the quadratic. Our experiments suggest that this specification fits the international data for food consumption better than a quadratic model.
Specifically, for steel, base metals and energy, we estimate:
and for food we estimate:
where  is per capita consumption or production of commodity j
for country i in physical units, gdppc is real GDP per capita (constant
1990 international dollars at purchasing power parity rates), μi is a
country fixed effect and uit is an error term.[38]
We follow the literature by including a deterministic trend, trend, to capture the effects of new technology, material substitution and long-run price trends that are correlated with time rather than per capita income. An alternative would be to include time dummies to control for year-specific factors. We find that the in-sample results are robust to the inclusion of time dummies instead of a time trend. Moreover, the use of the time trend is convenient in constructing projections, which would otherwise require assumptions to be made about how year effects are projected out-of-sample.
As a crosscheck on the basic panel fixed-effects approach, we also apply an alternative approach that follows recent work in the estimation of environmental Kuznets curves using flexible non-linear functional forms. Work by Destais et al (2007), Aslanidis and Xepapadeas (2008) and Duarte et al (2013) recommends the use of panel smooth transition regression (PSTR) models that allow a change in the underlying economic relationship (that is, regime switching) to occur when a certain threshold, such as a level of income per capita, is passed. The technique applied is the basic model of González, Teräsvirta and van Dijk (2005) that features two regimes.
For consumption per capita of each commodity we estimate:
where εi is a country fixed effect and eit is an error term. We follow González et al (2005) by using the logistic specification for the transition function ƒ(·):
where γ > 0 is a slope parameter that determines the smoothness of the change in the value of the logistic function and hence the speed of transition from one regime to another. The parameter a is the threshold that income per capita must pass to initiate a change in regime, such as a change in the slope of the relationship between the intensity with which a commodity is used and income per capita. We impose γ > 0 and α > 0 as identifying restrictions. The equation is estimated using non-linear least squares.[39]
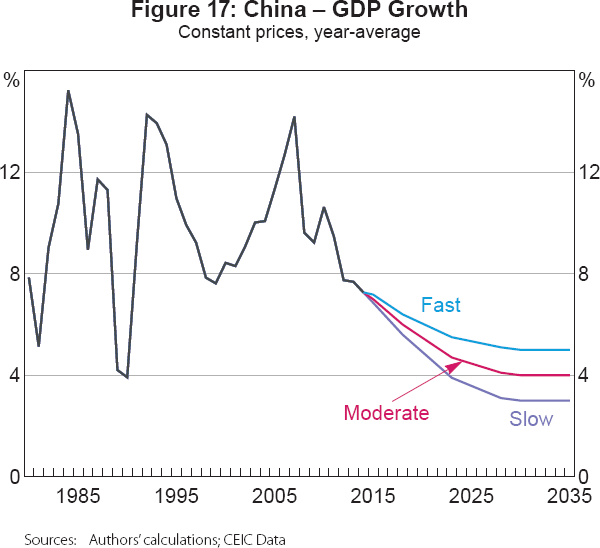
In the second step of our method, we use the above approaches and the estimated country fixed effects for China to project Chinese per capita commodity consumption or production to 2035. To do so we need projections of Chinese population growth and GDP growth. In the case of population growth, we use projections by the United Nations to 2035. For GDP growth, we follow Ma, Roberts and Kelly (this volume) in defining a gently slowing trend in annual growth towards a ‘terminal’ rate in 2030. We consider terminal growth rates of 3 per cent (‘slow’ growth), 4 per cent (‘moderate’ growth) and 5 per cent (‘fast’ growth) as scenarios. We hold these rates constant between 2030 and 2035 (Figure 17).
In constructing our projections, the key piece of information we draw from the panel regressions is the level of GDP per capita at which per capita consumption or production of a particular commodity is predicted to ‘peak’. We then project current actual per capita commodity consumption or production to such a point, using linear interpolation, and allow the data series to follow values predicted by the estimated coefficients thereafter. Thus, for a commodity where per capita demand is predicted to peak at a level higher than current actual levels, our projections will embody a rise towards that peak. If demand is predicted to have peaked earlier than suggested by the actual data, we project a gradual transition from current levels towards the ‘peak’ implied by the cross-country regression. Under a moderate growth scenario, we observe peaks for some commodities (steel and copper) within the projection period, while for others (aluminium, nickel, food and energy) the peak occurs after 2035. If the peak occurs after the end of our projection period, we simply interpolate between the final actual observation and the predicted 2035 observation for demand per capita.[40]
It is worth highlighting that the method described above differs notably from a more common practice among commodity analysts, which is to construct forecasts based on a combination of judgement and disaggregated assessments of likely future end-use demand for various commodities. An advantage of our framework is that it relies on relatively few assumptions and can be used to do scenario analysis. While we allow for country fixed effects, a key disadvantage of such a simple approach is that it does not consider the detailed time-varying sources of demand for individual commodities in any given country and may provide a poor forecast if a country's commodity demand has reached, or is about to reach, a turning point at an earlier stage than would be expected based on patterns observed in other countries.
3.1 Findings
The estimation results for the basic fixed-effects regressions are reported in Table 4.[41] A number of findings are worth noting. For the quadratic specifications, the sign of the squared term is negative, suggesting that per capita commodity consumption (or production in the case of steel) declines when a certain threshold of GDP per capita is passed, consistent with intuition. In the case of food, the coefficient on the inverse of GDP per capita is also negative, implying that food consumption per capita rises at a declining rate as income per capita increases. The China fixed effect varies in sign and magnitude across specifications, but the effects are particularly large and positive for steel, copper, aluminium and nickel, consistent with the unusually rapid growth of China's demand for these commodities. With the exception of the food equation, the coefficient on the time trend is negative, consistent with the hypothesis that technological progress reduces the intensity with which resource commodities are used as economic development proceeds (McKay et al 2010).
| Steel | Energy | Copper | Aluminium | Nickel | Food Inverse model |
|
|---|---|---|---|---|---|---|
| Quadratic model | ||||||
| gdppc | 63.6*** | 267.0*** | 1,421.0*** | 1,325.0*** | 105.4** | |
| gdppc2 | −1.5*** | −4.8*** | −33.2*** | −22.7*** | −1.7** | |
| 1/gdppc | −454.0*** | |||||
| Constant | −66.2** | 247.0*** | −124.9 | −3,066.0*** | −522.5** | 2,952.0*** |
| China fixed effect | 119.7*** | −7.4 | 808.4*** | 2,980.0*** | 549.3*** | −358.1*** |
| Trend | −2.8** | −2.9 | −63.9* | −6.4 | −8.5*** | 8.0*** |
| Obs | 3,159 | 4,053 | 2,393 | 2,067 | 1,446 | 5,134 |
| ‘Within’ R-squared | 0.27 | 0.43 | 0.25 | 0.62 | 0.10 | 0.46 |
| Hausman (1978) test (χ2) | 6.9* | 90.7*** | 16.4*** | 6.7* | 2.9 | 36.1*** |
|
Notes: ***, ** and * denote significance at the 1, 5 and 10 per cent levels, respectively; standard errors are robust and clustered at the country level |
||||||
For the PSTR specifications, the thresholds for per capita steel production and food consumption were found to be negative if estimated unconstrained and were found to be close to zero if constrained to be positive. We therefore disregard the models for these commodities. For other commodities, in all cases the coefficient β2 is negative, implying declining per capita consumption above the threshold (Table 5).
| Energy | Copper | Aluminium | Nickel | |
|---|---|---|---|---|
| β1 | 198.8*** | 1,028.7* | 808.8*** | 69.4** |
| β2 | −125.5*** | −885.2 | −214.4*** | −26.1** |
| γ | 191.9*** | 0.2* | 1.9 | 0.5 |
| α | 24.6*** | 14.8*** | 21.6*** | 23.2*** |
| China fixed effect | −37.1*** | 1,747.8*** | 2,387.4*** | 301.7*** |
| Trend | −2.0 | −27.1* | 11.4 | −15.5** |
| Obs | 4,053 | 2,333 | 2,067 | 1,446 |
|
Notes: ***, ** and * denote significance at the 1, 5 and 10 per cent levels, respectively; standard errors are robust and clustered at the country level |
||||
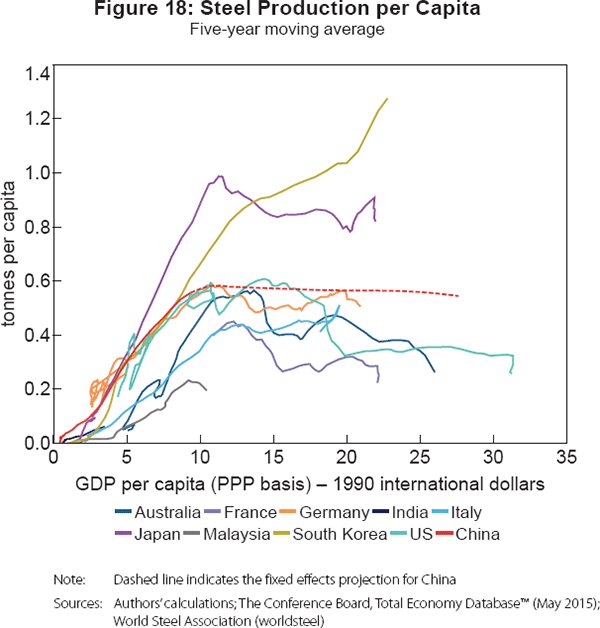
We now consider the results of our projections based on the moderate growth scenario for individual commodities in turn. For crude steel production, results from the basic panel fixed-effects specification suggest that actual steel production per capita (which was nearly 600 kilograms per capita in 2014 and around 585 kilograms per capita in 2015) has already exceeded the ‘peak’ predicted by our cross-country regression (around 560 kilograms per capita). Steel production therefore falls gradually, in per capita and aggregate terms, from current levels in our projection (Figure 18).
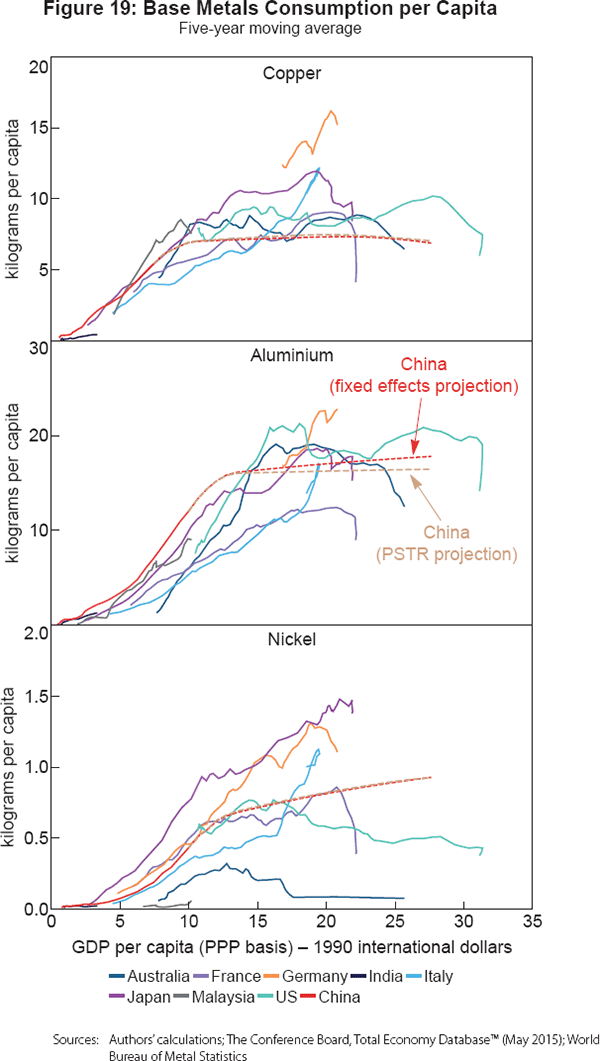
The results for base metals are a little different. In the case of copper, both models predict per capita consumption to peak at similar levels in the mid-to-late 2020s (Figure 19). In the case of aluminium, the models both suggest that consumption peaks after the projection period. Yet they diverge in that the basic fixed effects model estimates that the peak has not yet been reached whereas the PSTR predicts a peak below current actual levels. Thus, in the latter case, aluminium consumption is projected to fall in coming years. As aluminium consumption has grown unusually rapidly in China, in both cases the projected levels of consumption per capita are not dramatically different from current levels.
For nickel, the results of the two approaches are similar for much of the projection period. The main difference is that the PSTR model predicts consumption per capita to peak at a level of income per capita that China is projected to reach in the late 2020s, whereas the basic panel fixed effects model finds a higher peak that occurs after the end of our projection period.
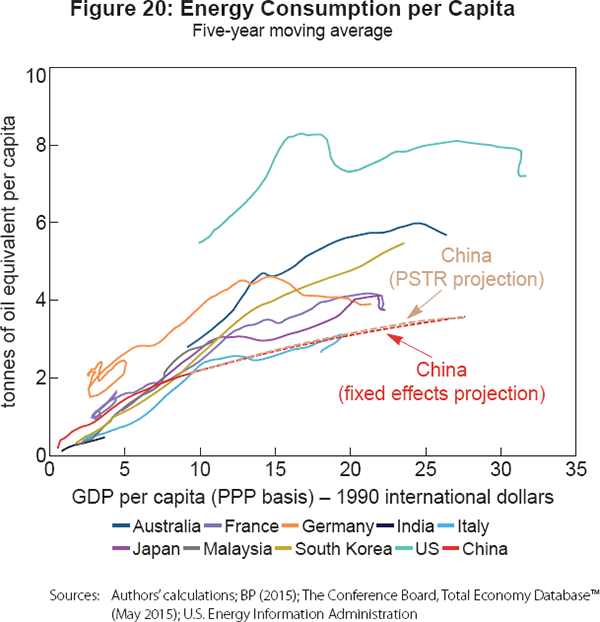
While for base metals, the PSTR technique generally suggests a weaker projection of consumption per capita than the basic fixed-effects specification, in the case of energy the results are more closely aligned. Both models suggest that, if history is a guide, Chinese per capita energy consumption is unlikely to peak within the next two decades (Figure 20). This finding is not surprising given the large gap between per capita consumption in China and other economies in our sample. Indeed, as discussed in the previous section, the more salient issue is likely to be the extent to which the composition of energy consumption changes as government (and public) pressure to reduce the use of fossil fuels becomes more prominent in China.
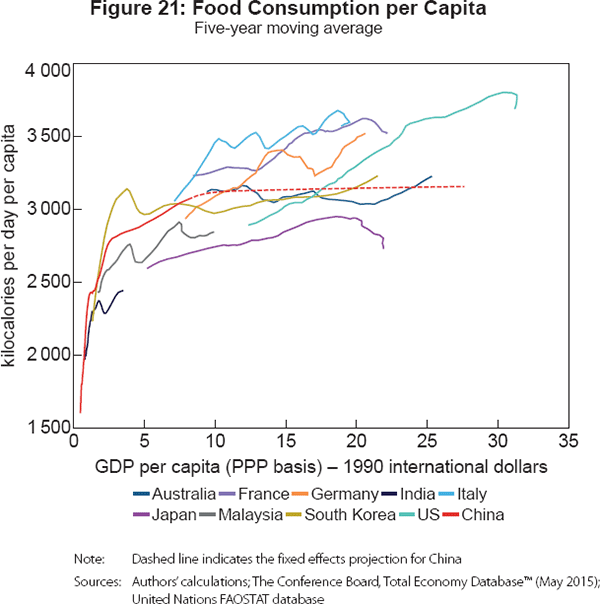
Finally, in the case of food consumption, the panel fixed effects model suggests a marginal further rise in calorie intake per capita from current levels (Figure 21). Data from the FAO indicate that the ratio of Chinese food consumption by weight (kilograms) to total calories consumed has been rising steadily over time. Thus, the total quantity of food consumed is likely to rise noticeably from current levels, even in per capita terms. However, as per capita consumption has already risen at a faster rate than several developing and advanced economies, the model suggests that future increases are likely to be more moderate than growth in the past.
The projections described above are linked to a particular (‘moderate’) scenario for Chinese economic growth, which may prove either too optimistic or pessimistic in practice. To consider the sensitivity to different growth scenarios, we apply the same estimated coefficients to our alternative ‘slow’ and ‘fast’ growth scenarios. The results for copper using the basic fixed effects approach can be used as an illustration (Figure 22). The results for other commodities are presented in Appendix B.
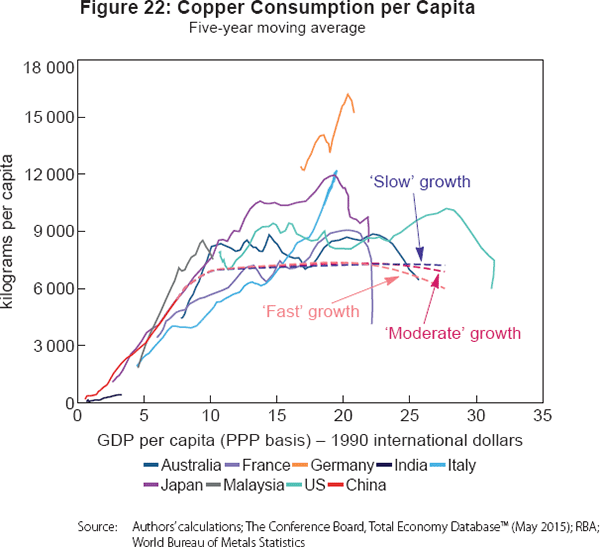
For commodities whose per capita consumption peaks during the projection period, a faster growth projection mechanically brings forward the timing of the peak. Thus, under the ‘fast’ growth scenario, all commodities except food experience a peak in per capita consumption before 2035. The idea that commodity consumption per capita could peak sooner under stronger growth might seem counterintuitive, and interpreted naively, could create an impression that growing the economy faster (for example, using stimulatory policy measures) would lead to an earlier peak in commodity demand. But such an interpretation would be incorrect. What the projections highlight is that as economies develop, their whole pattern of growth and hence their commodity intensity changes. For example, as a heavy industrialisation phase passes, the economy eventually becomes more focused on less-commodity-intensive activities such as services. Our results suggest that in China's case food and energy demand do not peak until the 2030s at the earliest. Thus, in contrast to copper, a stronger growth scenario is projected to increase per capita consumption of these commodities.
4. Bilateral Chinese–Australian Commodity Trade
In this section, we make some observations about China's bilateral trade with Australia in metal, energy and food commodities and consider some implications of the analysis in Section 3. China is Australia's largest export destination, accounting for 34 per cent of Australian merchandise exports and 30 per cent of Australia's total exports. By value, China's largest commodity import from Australia is iron ore, followed by coal, base metals, food products and other rural products (Table 6). Over the past decade, China's commodity trade with Australia has been characterised by a sharp increase in the share of iron ore, coal and natural gas imports and a corresponding decline in the share of agricultural products and base metals.
| 2004 | 2014 | |
|---|---|---|
| Metal ores | 44.3 | 70.6 |
| Iron | 36.4 | 63.5 |
| Copper | 6.6 | 5.9 |
| Nickel | 0.3 | 0.4 |
| Aluminium | 0.0 | 1.1 |
| Other base metals | 5.8 | 3.6 |
| Metal products | 15.7 | 5.9 |
| Iron and steel | 3.1 | 0.1 |
| Base metals | 12.6 | 5.9 |
| Mineral fuels | 12.3 | 13.9 |
| Coal | 4.2 | 10.5 |
| Natural gas | 0.0 | 1.7 |
| Food | 10.4 | 5.1 |
| Cereals | 6.6 | 2.0 |
| Meat | 0.4 | 1.2 |
| Seafood | 0.2 | 0.1 |
| Dairy, eggs and honey | 0.6 | 0.4 |
| Beverages, spirits and vinegar | 0.1 | 0.3 |
| Fruit and vegetables | 0.1 | 0.1 |
| Other rural | 17.3 | 4.4 |
| Wool | 10.1 | 1.8 |
| Cotton | 2.0 | 1.3 |
| Animal skins, furs and hides | 4.0 | 1.0 |
| Live animals | 1.2 | 0.3 |
|
Notes: Total is defined as the sum of the current price value of metal ores, metal products, mineral fuels and selected food and other rural imports (specifically, harmonised codes 1–24, 26–27, 41, 43, 51–52 and 72–81); precious metals are excluded Sources: Authors' calculations; United Nations COMTRADE database |
||
Although the decline in the share of bilateral food and other rural imports is noteworthy, the absolute value of these imports has more than tripled. China is Australia's largest market for hides and skins and second largest market for live animals, certain types of meat and dairy. Moreover, the relatively modest share of food in Australian exports to China is not matched for Australia's other trading partners. Rural exports account for around 13 per cent of Australia's total merchandise exports and occupy a greater share of total exports to Japan, South Korea and the ASEAN economies than they do of exports to China.
The future trajectory of Australian bilateral trade with China is highly uncertain. Nonetheless, to consider some possible implications of our projections in the previous section for China's future mix of imports from Australia, we conduct a simple thought experiment. First, we assume that commodity prices are unchanged over the projection period. In practice, this implies that relative prices do not change either, notwithstanding the greater importance of Chinese demand for some commodity markets than for others. While this is clearly an abstraction, the partial equilibrium nature of the analysis precludes the generation of price projections that are consistent with our demand estimates. Second, we assume that China's import demand for Australian commodities moves in line with its consumption demand for those commodities, as projected by our basic panel fixed-effects regressions. In other words, we ignore (for now) the possibility that Chinese import demand might increase or fall at a faster rate than domestic consumption for some commodities and we constrain Australian market shares for individual commodities to be fixed over the projection period. We also abstract from any consideration about relative levels of trade protection facing Australian exporters in specific markets or any domestic infrastructure or natural resource constraints that would prevent Australian producers from meeting all demand from Chinese consumers.
- To project iron ore, we assume a constant ratio of iron ore to crude steel in basic oxygen furnace production of 1.6 kilograms of iron ore to 1 kilogram of crude steel.[42] We further assume a gradual increase in the use of scrap steel. This is achieved by imposing a decline in the basic oxygen furnace/electric arc furnace ratio from 93 per cent in 2013 to 83 per cent in 2025 and to 73 per cent by 2035. A share of 73 per cent corresponds to the international average in 2013 according to the World Steel Association.
- To project coal and LNG, we assume that China meets its energy targets for 2020. We further allow the increase in the share of non-fossil fuels in the energy mix targeted for 2030 to be accommodated entirely by a decline in coal use. An assumption along these lines may be justified given the rapid growth in renewables capacity in the past few years and recent falls in domestic coal consumption and imports. To proceed, we apply an interpolated profile for the share in total energy for these commodities based on available targets to 2030 and allow demand for both to grow in line with total energy consumption thereafter to 2035.
- As our food projections use data expressed in calories, we apply a conversion factor to express the projections in physical units. We use data from the FAO on the historical relationship between kilograms of supply per capita and calories per capita in China. This ratio has gradually increased over time. We allow it to continue to increase at the 10-year annualised pace recorded between 2004 and 2014 to obtain projections for food demand in tonnes.
- To project base metals, we use data on the relative share of each base metal in China's imports of base metals from Australia and project total base metals assuming that growth follows a weighted average growth rate for these three commodities. For other metal ores and products, we construct projections using a weighted average of iron ore and base metal imports from Australia.
- All other commodities are projected to grow at the weighted average pace of industrial metal, food and energy imports. We use actual bilateral trade data where possible for 2015.[43] These data suggest that, in value terms, bilateral imports of mineral ores, metals and coal declined in 2015 while imports of LNG and food grew strongly. (In some cases, such as iron ore, the volume of bilateral imports increased but the value declined due to falls in commodity prices.)
Making the above assumptions, we project how the mix of Chinese imports of Australian commodities might evolve over time. As the future trajectory of Chinese growth is uncertain, we use the different growth scenarios described previously to generate a range of possible outcomes (Table 7). Given the projected decline in Chinese crude steel production, and the expected rise of scrap metal use over time, under all scenarios the share of iron ore in bilateral trade falls over the projection period. The projected peak in per capita base metal demand, in the mid to late 2020s, places gradual downward pressure on bilateral imports of these commodities from Australia.
| 2005 | 2015 | 2025 | 2035 | |
|---|---|---|---|---|
| Commodity | Actual | Estimated | Projection | Projection |
| Iron ore | 47.3 | 57.9 | 51–51½ | 43–47½ |
| Base metals | 25.1 | 13.2 | 13 | 12–13 |
| Coal | 4.3 | 8.7 | 9½–10 | 11–13 |
| Natural gas (LNG) | 0.0 | 5.4 | 10 | 12–14 |
| Food | 5.8 | 8.6 | 9 | 9½–11 |
|
Notes: Total is defined as the sum of the current price value of metal ores, metal products, mineral fuels and selected food and other rural imports (specifically, harmonised codes 2–24, 26–27, 41, 43, 51–52 and 72–81); precious metals are excluded; maximal and minimal values of projections do not always correspond to identical growth scenarios and for this reason (and rounding) will not sum to 100 per cent Sources: Authors' calculations; United Nations COMTRADE database |
||||
Meanwhile, growing energy use, combined with government targets to increase the share of natural gas and renewables in the energy mix, sees a gradual rise in imports of both coal and LNG. However, LNG imports increase at a faster pace, overtaking coal by the end of the projection period. Food imports increase at a steady pace, but our assumptions that commodity prices are unchanged and that Chinese import demand follows domestic consumption patterns restrict food from approaching the share of resource commodities in China's imports from Australia over the period considered.
Under a moderate growth scenario for China, the value of projected total bilateral trade increases gradually over the projection period, as rising food and energy imports more than offset falling iron ore imports. For some commodities, faster growth in China implies that the peak in demand is reached sooner, and the commodity's share declines more rapidly (base metals), while for others faster growth generally increases that commodity's share of the basket of imported commodities (coal, LNG and food).
Taken at face value, our thought experiment suggests that the shares of food and LNG imports from Australia would not overtake those of iron ore and coal unless relative prices were to rise sharply or Australia were able to increase export volumes to China at a rapid pace over the next two decades. The latter possibilities should not be ruled out for a number of reasons. First, as we do not directly model bilateral food or LNG imports and we hold prices fixed, our experiment mechanically constrains imports to move in line with domestic consumption trends and Chinese government targets for primary energy consumption. Second, if China's demand for imported metal ores or coal were to weaken dramatically, natural gas, food and agricultural exports would become commensurately more important in the bilateral trade relationship.
There are a number of downside risks to the projections for coal, iron ore and base metals. Policy commitments (both domestically and internationally) to improve environmental sustainability through numerous practical measures could result in a sharper-than-projected curtailment of coal consumption and imports. Imports of coal have already fallen in recent years (both total and bilateral) and the sheer size of China's domestic coal reserves and production means that, should domestic consumption decline sufficiently, the need for imports from Australia and other countries could be correspondingly reduced. Our iron ore projections make a specific assumption about the prospects for steel recycling in China. Greater-than-projected scrap use could weigh further on future import demand. Moreover, the model-based profiles for base metals rely on the basic panel fixed-effects specification described in the previous section, which suggests a stronger outlook for per capita consumption than the alternative PSTR model.
Several other considerations are also relevant. The outlook for LNG depends on factors including competition from pipeline gas, international fuel prices and domestic gas price regulation in China. Notwithstanding falls in aggregate Chinese LNG imports in 2015, the value of imports from Australia grew very strongly. If Australia meets predictions that it will overtake Qatar to becomes the world's dominant supplier of LNG within the current decade (Cassidy and Kosev 2015), bilateral trade could grow more quickly than projected.[44] Even if our volume projections for bilateral natural gas imports are accurate, the price paid by Chinese importers for Australian LNG was generally lower than Asian prices in 2015. Given the considerable lags in the process of adjusting prices in long-term LNG contracts, there may be scope for the average value of LNG imported from Australia to rise from current levels.[45] Against this, if China fails to achieve its ambitious targets for natural gas consumption, our projection could overstate growth in bilateral LNG imports.
Similarly, food imports could grow faster than domestic consumption if domestic supply were constrained or if behavioural shifts described earlier were to lead Chinese consumers to bias their spending towards foreign products. Such a bias could affect the relative prices of certain food and agricultural commodities, and, given the perishable nature of some of these products, it could benefit suppliers in close geographical proximity to China such as Australia. Also, a feature of our scenarios is that they say little about the changing composition of food imports, which could benefit some trading partners more than others. If the shift towards higher-protein foods in China continues, and Australian exporters benefit from this trend (as is widely expected), [46] a sharper rise in the share of food could be observed than that embodied in our estimates.
Indeed, the share of food commodities in Chinese–Australian bilateral trade has already risen noticeably in recent years. If, instead of following the profile suggested by our projection of Chinese food consumption, the value of food imports from Australia continued to grow at its 10-year annualised rate (around 16½ per cent), and holding our other assumed profiles constant, its share in bilateral trade would eclipse that of iron ore (and all other commodities) by the late 2020s. The realism of such a naїve projection can be questioned, however, especially if Chinese household consumption slows over the projection period. Moreover, the extent to which Australia could displace other exporters in accommodating China's rising demand would depend, among other things, on the relative efficiency of production, the cost of freight and storage, and the level of the exchange rate. It would also be contingent on the availability of arable land and the efficient utilisation of scarce water resources in Australia. But it is worth noting that even if food imports from Australia were to increase at a more moderate rate of 5 per cent per annum (nearly five times the pace implied by our food consumption projection), and leaving other projections unchanged, these imports might account for a larger share of Chinese imports from Australia than coal or LNG within a decade.
5. Concluding Remarks
China's role in global commodity markets is changing as it undertakes a transition from a growth pattern that is highly intensive in its use of natural resources, driven by investment and the development of heavy industry, to a more sustainable path that uses these resources less intensively. The slowing of the Chinese economy has placed downward pressure on demand for many imported commodities, particularly metal ores and coal, although natural gas and food imports have also not been immune. An analysis of the detailed drivers of Chinese demand suggests that the outlook is weak for some commodities, but for others there is scope for consumption per capita to increase further from current levels.
For mineral ores and metals, the burden of excess capacity in manufacturing and weakness in residential construction has weighed heavily on consumption of these commodities, but in the longer term such factors may be partly offset by efforts to fill residual infrastructure gaps and to meet the remaining requirements of urbanisation. For mineral fuels and other sources of energy, heightened public concerns regarding air pollution and environmental degradation, together with government efforts to meet official commitments addressing climate change, favour growth in demand for renewable energy and natural gas at the expense of more carbon-intensive fuels such as coal and crude oil. The long-term upward trend in Chinese consumption of higher-calorie and higher-protein foods may translate into increased imports as domestic constraints on arable land start to bind and concerns about food safety and soil and water pollution rise in prominence.
To quantify how changing patterns of development may affect China's future commodity demand, this paper exploits the historical relationship between commodity consumption (or production) and income per capita for a large number of economies across a wide range of commodities. We find that, if historical patterns are a guide, the demand for iron ore is likely to fall in coming years. In contrast, our estimates suggest that demand for energy and food commodities will increase even under a relatively pessimistic scenario for Chinese growth.
There is great uncertainty about how such developments might affect Chinese imports of commodities from its trading partners. To explore the range of possible outcomes, we describe a thought experiment in which bilateral commodity trade between China and Australia follows patterns dictated by our projections for China's domestic commodity consumption. Such an exercise suggests that the shares of food and LNG are unlikely, in the near-to-medium term, to rise above those of metal ores and coal in the import basket if we assume that relative prices and Australia's export penetration into the Chinese market are unchanged. An implication is that a wholesale shift in the composition of China's commodity imports from Australia may not be a foregone conclusion. However, relaxing these restrictive assumptions unveils a wider range of possibilities, including the prospect that imported Australian food commodities could begin to erode the importance of traditional resource commodities within the coming decade.
Appendix A: Data
| Series | Sources | Period | Number of economies |
|---|---|---|---|
| Crude steel production (million tonnes) | World Steel Association, Steel Statistical Yearbook (1978, 1986) World Steel Association, Annual crude steel production per country and region 1980–2013 | 1967–2013 | 68 |
| Refined aluminium consumption (million tonnes) | World Bureau of Metals Statistics | 1953–2012 | 43 |
| Refined copper consumption (million tonnes) | World Bureau of Metals Statistics | 1953–2012 | 48 |
| Refined nickel consumption (million tonnes) | World Bureau of Metals Statistics | 1970–2012 | 41 |
| Energy consumption (million tonnes of oil equivalent) | B P, Statistical Review of World Energy: June 2015 US Energy Information Administration, International Energy Statistics World Bank, World Development Indicators | 1970–2012 | 105 |
| Food consumption (calories per capita per day) | Food and Agricultural Organization of the United Nations, Statistics Division | 1962–2012 | 115 |
| Gross domestic product (PPP basis, 1990 international dollars) | The Conference Board, Total Economy Database™ (May 2015) The Maddison-Project, http://www.ggdc.net/maddison/maddison-project/home.htm, 2013 version | 1953–2013 | 115 |
| Population | The Conference Board, Total Economy Database™ (May 2015) The Maddison-Project, http://www.ggdc.net/maddison/maddison-project/home.htm, 2013 version | 1953–2013 | 115 |
Appendix B: Sensitivity of Projections to Alternative Growth Scenarios
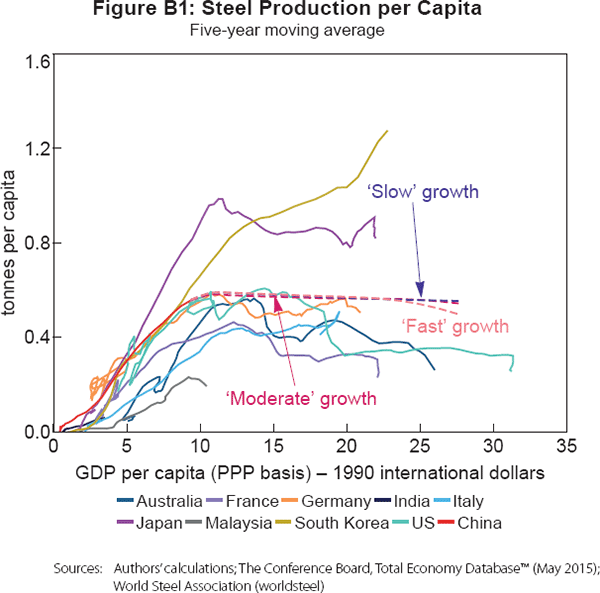
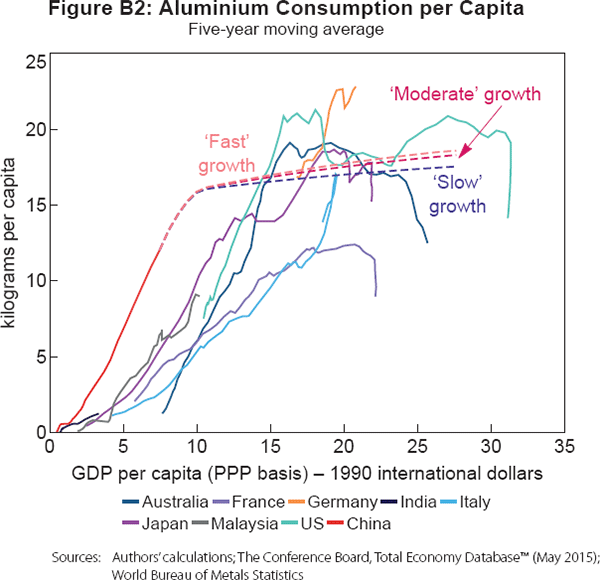
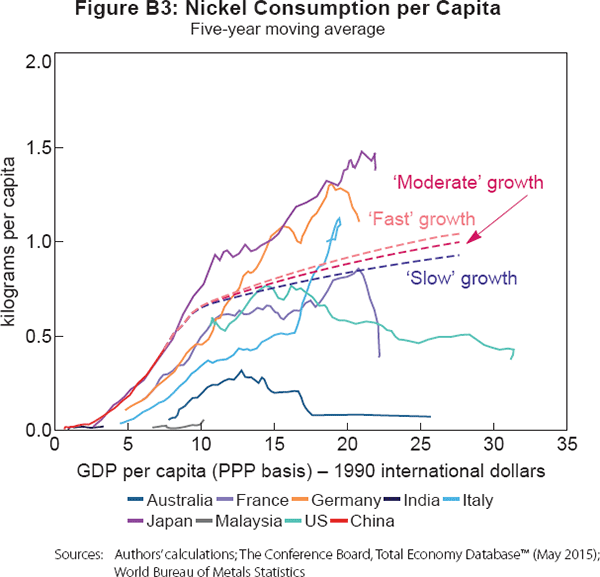
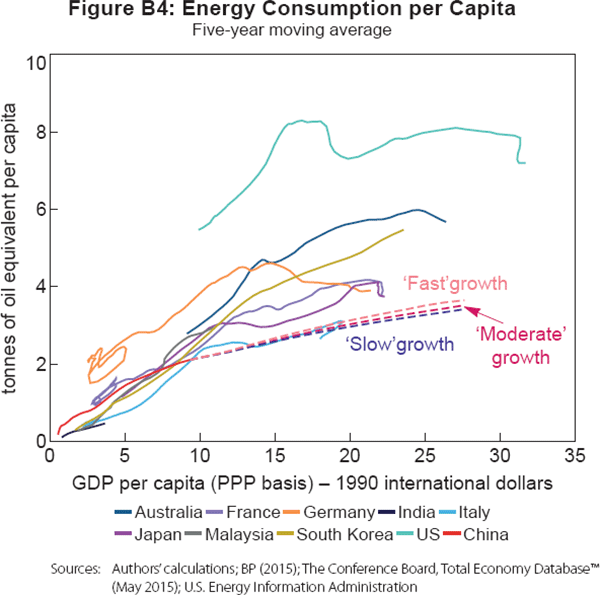
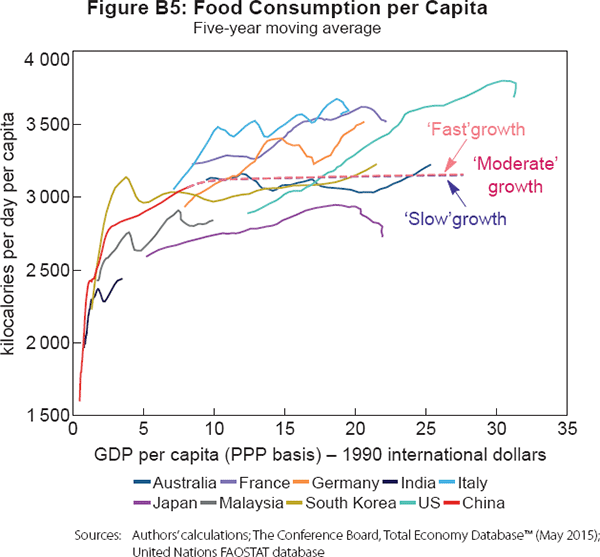
Footnotes
The authors are from Economic Group (Roberts, Saunders and Cassidy) and Risk Management Department (Spence) of the Reserve Bank of Australia. [*]
Evidence of the importance of China's manufacturing export industry as a driver of its demand for iron ore, base metals and coal is provided by Roberts and Rush (2010, 2012), based on findings from input-output tables and a gravity model of trade. [1]
Recent literature has suggested that international crude oil prices are influenced strongly by demand factors (Kilian 2008). [2]
Natural gas prices are typically oil-linked (Cassidy and Kosev 2015). Lower crude oil prices have reduced costs in agriculture, which is particularly oil-intensive. Increased supply of low-cost unconventional fuel has also undercut more costly biofuel production, leading to increased supply of certain agricultural products on the global market (World Bank 2015). [3]
According to the US Geological Survey (Tuck 2015), China's iron ore reserves have an average ferrous content of 31 per cent, compared with 43 per cent in Australia, 52 per cent in Brazil, 56 per cent in Russia and 64 per cent in India. [4]
There is considerable uncertainty surrounding these estimates as the average ferrous content of Chinese and imported ore have been changing over time. For the present calculation we assume an average ferrous content of 31 per cent for domestic ore and a range of 50–62 per cent for imported ore. [5]
Domestic steel consumption is measured as steel production plus net imports less the change in inventories. [6]
Consumption of iron ore is measured as domestic production plus net imports less the change in inventories, estimated on an equivalent iron content basis. A range of estimates suggest that iron ore consumption fell slightly in 2015, although magnitudes vary depending on the measure of iron ore inventory used. [7]
For a discussion, see Baker and Hyvonen (2011). [8]
In 2013, the State Council issued plans to reduce obsolete and polluting capacity in selected industries, including the steel sector (State Council 2013a, 2013b). These plans involve the elimination of more than 80 million tonnes of steel production capacity by 2017 (about 10 per cent of total capacity in 2014) and a decision to suspend the approval of new projects. In 2014, the government committed to remove 27 million tonnes of outdated capacity to help meet targets to eliminate all blast furnaces, converters and other steel production processes below specified size limits (NDRC 2014). In early 2016, the State Council separately pledged to cut 100–150 million tonnes of excess capacity in steel over an unspecified time frame (State Council 2016). The government has also sought to eliminate obsolete and polluting capacity through credit policies, with the central bank restricting lending to firms in the steel sector that do not meet environmental requirements (People's Daily 2014). Since 2012, the Ministry of Environmental Protection has trialled the use of remote control drones to inspect emissions via aerial photography and sample particulate matter with spectroscopy technology, and has used such methods on a large scale since late 2013 (Zhang, X 2015). [9]
For example, the call to strengthen steel recycling capacity in the 12th Steel Industry Five-Year Plan (MIIT 2011) may have been undermined by the contemporaneous decision to close down small-scale electric arc furnaces and the decision in 2011 to cancel a 70 per cent rebate on value-added tax (and impose a 17 per cent VAT) for sales of recycled steel. [10]
The industry consists of a number of large-scale steel recycling enterprises, recycling affiliates of major steel producers and thousands of small privately-run collection shops (Wübbeke and Heroth 2014). [11]
Some commentators attribute domestic oversupply to official efforts to maintain employment and support the coal industry (as most aluminium smelters are coal fired) (Rovnick 2013). Nonetheless, as an officially designated ‘overcapacity' industry, the aluminium sector is also subject to efforts by policymakers to limit continued high production (see below). [12]
Stainless steel accounts for around two-thirds of global consumption of nickel ore (International Nickel Study Group 2016). [13]
The stated goal of this initiative is to alleviate pollution by increasing the efficiency of energy transmission: energy losses from UHV power lines are reportedly 5–6 times lower than conventional power lines (Chen, S 2014). [14]
Trussell estimates that wind, nuclear and solar power sources contain, respectively, 2 tonnes, 2.5 tonnes and 6.8 tonnes of copper for each megawatt of power generation, compared with 1.3 tonnes per megawatt for a coal-fired electricity station. [15]
The global average is around 40 per cent (Saunders 2015). [16]
These figures are for 2014. [17]
The majority of China's coal reserves are located in the inland western provinces of Shanxi, Shaanxi and Inner Mongolia, which together produce around 60 per cent of the country's output of coal (IEA 2013). [18]
Based on estimates of Chinese and global trade in metallurgical and thermal coal provided by the World Coal Association (2014). [19]
China's oil reserves were estimated to be 24.6 billion barrels in January 2015, the highest in the Asia-Pacific region (EIA 2015). [20]
A caveat, however, to such estimates is that the distinction between strategic and commercial reserves is not clearly defined. [21]
China's natural gas imports are currently split evenly between seaborne LNG and piped gas transported overland from neighbouring countries (BP 2015). [22]
The government is targeting growth in renewable and nuclear capacity from 447 gigawatts in 2014 to 708 gigawatts by 2020. [23]
Specifically, the government imposed a nationwide efficiency ‘bottom line’ of 310 grams of coal per kilowatt hour, compared with average efficiency of 318 grams per kilowatt hour (State Council 2015b). [24]
Natural gas produces 370 grams of carbon dioxide per kilowatt hour, compared with 640 grams in the case of crude oil and 720–940 grams for coal (Jacobs 2011). [25]
In 2009, the National Development and Reform Commission (NDRC) adopted a pricing system for oil that allowed it to adjust retail diesel and gasoline prices when the moving average of imported crude oil prices fluctuated outside a 4 per cent range around the domestic benchmark price for 22 consecutive working days. In 2013, the NDRC changed this rule so that fluctuations of greater than CNY50 per tonne over 10 consecutive working days would warrant an adjustment to retail prices (EIA 2015). In late 2015, however, the NDRC stated that it would review pricing regulation and delay passing though falls in international oil prices as a means of addressing environmental pollution concerns (NDRC 2015). [26]
Reform of natural gas pricing began in earnest in 2011 with a pilot to link city gate (local delivery point) natural gas prices to imported fuel oil and liquefied petroleum gas prices. A series of reforms between 2013 and 2015 resulted in significantly higher average prices of imported and domestic pipeline gas for industrial consumers, although wholesale LNG import prices are not subject to regulation. Non-residential city gate prices were cut significantly by the NDRC in late 2015 (State Council 2015a). Residential gas prices remain tightly regulated (Chen, M 2014; EIA 2015). [27]
The total sown area of farm crops was 165 million hectares in 2014. [28]
In 2008, locally produced infant formula tainted with melamine sickened 300,000 babies and caused 6 premature deaths. Subsequent scandals, often involving the use of diseased or rotten meat, have led to widespread public concern about domestic safety standards (e.g. AFP 2014). [29]
Around 80 per cent of China's maize output is used for animal feed (Zhou et al 2012). [30]
For example, farms in the United States produce higher corn yields with less fertiliser than Chinese farms (Gale, Jewison and Hansen 2014). [31]
China also faces challenges in the use of water in farming; official data suggest that nearly 40 per cent of farmland is irrigated. Hamshere et al (2014) argue that inefficiencies in water use in China, if rectified (for example, through use of drip irrigation), could boost the sustainability of farming in coming years. [32]
The reasoning for modelling per capita food demand in terms of calories is to aggregate consumption in homogeneous units. [33]
Steel product imports account for about 1½ per cent of total estimated consumption of steel products. [34]
The main exception is aluminium products, of which China has become a major exporter in recent years. [35]
McKay et al (2010) express their model in log difference form; moreover, they use supplementary regression-based projections of GDP per capita to project future per capita steel output. Wårell and Olsson (2009) use a related approach that regresses steel consumption per unit of GDP on a polynomial function of GDP per capita. Jaunky (2014) estimates the relationship between copper consumption per unit of GDP and income per capita. [36]
Beidas-Strom uses a third order polynomial with fixed effects for energy, but for base metals augments the regression with a number of other variables, including the investment share of GDP and the share of durable goods in private consumption. [37]
We employ fixed effects in preference to random effects as there is little reason to assume that country fixed effects are uncorrelated with the other regressors in the equation. [38]
We initialise the non-linear least squares algorithm using starting values for γ and a obtained from the results of the basic panel fixed-effects regressions described above. [39]
An attractive feature of this approach is that it isolates the key finding of interest from our regressions and prevents discontinuous jumps that sometimes occur when splicing projected values with actual values. For economies in our cross-country panel regressions whose commodity demand patterns deviate substantially from the average patterns in the sample, a simple extrapolation of predicted values from actual values in some cases creates a discontinuous jump in the first period of projection. The inclusion of country fixed effects limits but does not always resolve this problem, which is particularly pronounced in China's case for aluminium and food consumption. [40]
The results on statistical significance (that is, standard errors) and the R-squared for the regressions with quadratic specifications are reported for reference only and should be treated with caution. As gdppc is clearly non-stationary for many countries in the sample, and gdppc2 is a nonlinear transformation of gdppc, the limiting distribution of the ordinary least squares (OLS) estimates, in particular the variance, will be biased, which invalidates standard statistical inference. Ermini and Granger (1993) show that polynomial transformations of I(1) variables behave similarly to a random walk with drift. Accordingly, it is probable that the variables in the commodity consumption/production equations exhibit cointegration. Applying Fisher-type stationarity tests to the residuals, which are proposed by Maddala and Wu (1999) and Choi (2001) for unbalanced panels, we reject the null hypothesis that all panels contain a unit root. Although least squares standard errors will be invalid, Hong and Wagner (2011) explain that for a cointegrated polynomial panel regression the OLS estimator is in general still consistent. Results from simple Monte-Carlo simulations for quadratic functions of I(1) processes support this conclusion. An extension to the approach presented here that might improve the reliability of inference would be to use a fully modified OLS panel estimation as recommended by Hong and Wagner (2011). [41]
The World Steel Association estimates a ratio of 1.5 kilograms of iron ore to 1 kilogram of crude steel, but some estimates for China are higher (Holloway, Roberts and Rush 2010). [42]
For iron ore, base metals, coal and LNG, we use official data on Chinese imports from Australia, sourced from CEIC. For food, we aggregate Australian exports to China at the two-digit SITC level, sourced from the Australian Bureau of Statistics. [43]
Nonetheless, under an unchanged price assumption, the projections in Table 7 are consistent with the estimate of Cassidy and Kosev (2015) that China will purchase around 20 per cent of Australian LNG exports under contract by 2020. [44]
Chinese merchandise trade data suggest an implied price of US$5.8 per million British thermal units (BTU) for Australian LNG in January 2016, compared with an average price of US$7.4 per million BTU for all trading partners, and the Asian spot price of around US$5.8 per million BTU. [45]
For example, see Australia China Business Council (2015). [46]
References
AFP (Agence France-Presse) (2014), ‘Alarm as over 150 Pig Carcasses Found in China's Gan River’, South China Morning Post online international edition, 19 March, updated 20 March 2014, viewed January 2016. Available at <http://www.scmp.com/news/china/article/1452448/renewed-alarm-over-150-pig-carcasses-found-chinas-gan-river>.
Angel M (2012), ‘METALS-Copper Rebounds from 2-Month Lows on Dollar, China Growth’, Reuters.com United States edition, 12 November, viewed January 2016. Available at <http://www.reuters.com/article/2012/11/12/markets-metals-idUSL5E8MC7GP20121112>.
Aslanidis N and A Xepapadeas (2008), ‘Regime Switching and the Shape of the Emission–Income Relationship’, Economic Modelling, 25(4), pp 731–739.
Australia China Business Council (2015), ‘The 2014 Australia-China Trade Report’, 25 March.
Baker M and M Hyvonen (2011), ‘The Emergence of the Chinese Automobile Sector’, RBA Bulletin, March, pp 23–29.
Batson A (2015), ‘The Short Tale of Iron Ore's Long Fall’, Gavekal Dragonomics research note, 6 April.
Beidas-Strom S (2014), ‘Box 1.2: Is China's Spending Pattern Shifting (Away from Commodities)?’, World Economic Outlook: Recovery Strengthens, Remains Uneven, World Economic and Financial Surveys, IMF, Washington DC, pp 36–40.
BP (2015), BP Statistical Review of World Energy: June 2015, BP plc, London.
Brandt L and TG Rawski (2008), ‘China's Great Economic Transformation’, in L Brandt and TG Rawski (eds), China's Great Economic Transformation, Cambridge University Press, New York, pp 1–26.
Bureau of International Recycling (2013), ‘World Steel Recycling in Figures 2008 – 2012: Steel Scrap – A Raw Material for Steelmaking’, Bureau of International Recycling Information Brochure.
Cai F and Y Lu (2013), ‘Population Change and Resulting Slowdown in Potential GDP Growth in China’, China & World Economy, 21(2), pp 1–14.
Cassidy N and M Kosev (2015), ‘Australia and the Global LNG Market’, RBA Bulletin, March, pp 33–43.
Chambers M (2015), ‘Rio, BHP Billiton Keep Faith in China's Future Steel Demand’, The Australian online edition, 5 December, viewed January 2016.
Chan KW and Y Hu (2003), ‘Urbanization in China in the 1990s: New Definition, Different Series, and Revised Trends’, The China Review, 3(2), pp 49–71.
Chen M (2014), The Development of Chinese Gas Pricing: Drivers, Challenges and Implications for Demand, OIES Paper NG 89, The Oxford Institute for Energy Studies, Oxford.
Chen S (2014), ‘China to Build New Hi-Tech Power Network to Help Fight Pollution’, South China Morning Post online international edition, 15 May, viewed January 2016. Available at <http://www.scmp.com/news/china/article/1512282/china-build-new-hi-tech-power-grid-help-fight-pollution>.
China Aluminium Network (2014), ‘Power Grid Growth in China to Boost Demand for Aluminium Cables and Wires’, 28 March, viewed January 2016. Available at <http://www.alu.com.cn/enNews/NewsInfo_20012.html>.
China Daily (2014), ‘Water Quality Levels Falling’, ChinaDaily.com.cn, 23 April, viewed January 2016. Available at <http://www.chinadaily.com.cn/china/2014-04/23/content_17458207.htm>.
China Daily (2015), ‘China's Coal Consumption Continues to Drop’, ChinaDaily.com.cn, 18 November, viewed January 2016. Available at <http://europe.chinadaily.com.cn/business/2015-11/18/content_22482026.htm>.
China Economic Information Network (2015), ‘国家发改委发文鼓励企业储备原油’ (National Development and Reform Commission Issues Paper to Encourage Industrial Crude Oil Reserves), 10 February, viewed January 2016. Available at <http://www1.cei.gov.cn/loadpage.aspx?Page=ShowDoc&CategoryAlias=zonghe/ggmflm_zh&ProductAlias=zuixfg&BlockAlias=lawzxfg&filename=/doc/lawzxfg/201502100089.xml>.
Chivakul M, WR Lam, X Liu, W Maliszewski and A Schipke (2015), ‘Understanding Residential Real Estate in China’, IMF Working Paper No WP/15/84.
Choi I (2001), ‘Unit Root Tests for Panel Data’, Journal of International Money and Finance, 20(2), pp 249–272.
Chu D (2015), ‘China Builds UHV Projects across Regions to Fight Pollution’, Global Times online, 19 May, viewed January 2016. Available at <http://www.globaltimes.cn/content/922428.shtml>.
Coates B and N Luu (2012), ‘China's Emergence in Global Commodity Markets’, Economic Roundup, 1, pp 1–30.
Cole JR and S McCoskey (2013), ‘Does Global Meat Consumption Follow an Environmental Kuznets Curve?’, Sustainability: Science, Practice, & Policy, 9(2), pp 26–36.
Destais G, J Fouquau and C Hurlin (2007), ‘Economic Development and Energy Intensity: A Panel Data Analysis’, in JH Keppler, R Bourbonnais and J Girod (eds), The Econometrics of Energy Systems, Palgrave Macmillan, New York, pp 98–120.
Döhrn R and K Krätschell (2013), ‘Long Term Trends in Steel Consumption’, Ruhr Economic Papers No 415.
Duarte R, V Pinilla and A Serrano (2013), ‘Is There an Environmental Kuznets Curve for Water Use? A Panel Smooth Transition Regression Approach’, Economic Modelling, 31, pp 518–527.
EIA (U.S. Energy Information Administration) (2015), ‘China’, Beta site, International analysis report, 14 May, viewed 20 May 2015. Available at <http://www.eia.gov/beta/international/analysis.cfm?iso=CHN>.
Els F (2013), ‘Report: China Starts Stockpiling Metals Again’, Mining.com, 2 June, viewed January 2016. Available at <http://www.mining.com/report-china-starts-stockpiling-metals-again-90612/>.
Ermini L and CWJ Granger (1993), ‘Some Generalizations on the Algebra of I(1) Processes’, Journal of Econometrics, 58(3), pp 369–384.
Farchy J (2013), ‘Beijing Returns to Global Metals Market’, FT.com, 2 June, viewed January 2016. Available at <http://www.ft.com/cms/s/0/3e624144-cb84-11e2-8ff3-00144feab7de.html>.
Gale F, M Jewison and J Hansen (2014), ‘Prospects for China's Corn Yield Growth and Imports’, United States Department of Agriculture Economic Research Service Report, Feed Outlook No FDS-14D-01.
González A, T Teräsvirta and D van Dijk (2005), ‘Panel Smooth Transition Regression Models’, SSE/EFI Working Paper Series in Economics and Finance No 604.
Government of the PRC (Government of the People's Republic of China) ‘国家新型城镇化规划’ (2014), ‘(2014—2020‘年’)’ (National New-Type Urbanization Plan (2014—2020)), 16 March, viewed January 2016. Available at <http://www.gov.cn/zhengce/2014-03/16/content_2640075.htm>.
Hamshere P, Y Sheng, B Moir, F Syed and C Gunning-Trant (2014), ‘What China Wants: Analysis of China's Food Demand to 2050’, ABARES (Australian Bureau of Agricultural and Resource Economics and Sciences) Conference Paper 14.3.
Hausman JA (1978), ‘Specification Tests in Econometrics’, Econometrica, 46(6), pp 1251–1271.
Holloway J, I Roberts and A Rush (2010), ‘China's Steel Industry’, RBA Bulletin, December, pp 19–25.
Hong SH and M Wagner (2011), ‘Cointegrating Polynomial Regressions: Fully Modified OLS Estimation and Inference’, IHS Economics Series Working Paper No 264.
IEA (International Energy Agency) (2013), World Energy Outlook 2013, International Energy Agency, Paris.
International Nickel Study Group (2016), ‘About Nickel: Production, Usage and Prices’, viewed 22 June 2016.
Jacobs D (2011), ‘The Global Market for Liquefied Natural Gas’, RBA Bulletin, September, pp 17–27.
Jaunky VC (2014), ‘Does a Material Kuznets Curve Exist for Copper?’, Economic Papers, 33(4), pp 374–390.
Kilian L (2008), ‘The Economic Effects of Energy Price Shocks’, Journal of Economic Literature, 46(4), pp 871–909.
Kong D (2015), ‘全球废钢产业格局下中国废钢行业运行现状的分析’ (Analysis of Developments in China's Scrap Steel Industry in the Context of Global Scrap Steel Situation), Mysteel Research Institute Report. Available at <http://mri.mysteel.com/industry_article.html?id=10895>.
Lardy NR (2014), Markets over Mao: The Rise of Private Business in China, Peterson Institute for International Economics, Washington DC.
Li K (2014), ‘Report on the Work of the Government’, Speech delivered at the Second Session of the Twelfth National People's Congress, Beijing, 5 March.
Li X (2015), ‘Steel Market in China’, Presentation to the 78th Session of the OECD Steel Committee, Paris, 11–12 May.
Lian R and F Wong (2014), ‘CORRECTED-UPDATE2-China Banking Regulator Urges Probes on Iron Ore Financing, Futures Slump’, Reuters.com United States edition, 28 April, viewed May 2014. Available at <http://www.reuters.com/article/2014/04/28/markets-ironore-idUSL3N0NK1EU20140428>.
Maddala GS and S Wu (1999), ‘A Comparative Study of Unit Root Tests with Panel Data and a New Simple Test’, Oxford Bulletin of Economics and Statistics, 61(S1), pp 631–652.
Mathews JA and H Tan (2015), China's Renewable Energy Revolution, Building A Sustainable Political Economy: SPERI Research & Policy, Palgrave Macmillan, Basingstoke.
McKay H, Y Sheng and L Song (2010), ‘China's Metal Intensity in Comparative Perspective’, in R Garnaut, J Golley and L Song (eds), China: The Next Twenty Years of Reform and Development, China Update, ANU E Press and Social Sciences Academic Press (China), Canberra, pp 73–98.
MEP (Ministry of Environmental Protection of the People's Republic of China) (2013), ‘The State Council Issues Action Plan on Prevention and Control of Air Pollution Introducing Ten Measures to Improve Air Quality’, 12 September, viewed January 2016. Available at <http://english.mep.gov.cn/News_service/infocus/201309/t20130924_260707.htm>.
MIIT (Ministry of Industry and Information Technology of the People's Republic of China) (2011), ‘关于印发《钢铁工业 “十二五” 发展规划》的通知’ (Notice Regarding the Publication of ‘Iron and Steel Industry Development Twelfth Five-Year Guideline’), 7 November, viewed January 2016. Available at <http://www.miit.gov.cn/n1146295/n1146562/n1146650/c3074215/content.html>.
MLR and MEP (Ministry of Land and Resources of the People's Republic of China and MEP) (2014), ‘全国土壤污染状况调查公报’ (National Soil Pollution Situation Survey Report), 17 April. Available at <http://www.mlr.gov.cn/xwdt/jrxw/201404/P020140417573876167417.pdf>.
NBS (National Bureau of Statistics of China) (2015a), ‘国家石油储备建设取得重要进展’ (National Crude Oil Reserve Construction Achieves Important Progress), Statistical Release, 11 December. Available at <http://www.stats.gov.cn/tjsj/zxfb/201512/t20151211_1288564.html>.
NBS (2015b), ‘Statistical Communiqué of the People's Republic of China on the 2014 National Economic and Social Development’, Press Release, 26 February.
NDRC (National Development and Reform Commission, People's Republic of China) (2014), ‘Report on the Implementation of the 2013 Plan for National Economic and Social Development and on the 2014 Draft Plan for National Economic and Social Development’, Second Session of the Twelfth National People's Congress, Beijing, 5 March.
NDRC (2015), ‘国内成品油价格形成机制将进一步完善’ (The National Oil Product Price Formation Mechanism Will Undergo Further Refinement), Media Release, 15 December. Available at <http://www.ndrc.gov.cn/xwzx/xwfb/201512/t20151215_767558.html>.
Ng J and J Riseborough (2015), ‘BHP Cuts Forecast for China Peak Steel Output by 15pc to Less than 1bn Tons’, AFR.com, 26 August, viewed January 2016. Available at <http://www.afr.com/business/mining/iron-ore/bhp-cuts-forecast-for-china-peak-steel-output-by-15pc-to-less-than-1bn-tons-20150825-gj7p54> .
OECD (Organisation for Economic Co-operation and Development) (2015), OECD Urban Policy Reviews: China 2015, OECD Publishing, Paris.
Ongley ED and T Yu (2013), ‘Role of Agriculture in Water Pollution’, Guidelines to Control Water Pollution from Agriculture in China: Decoupling Water Pollution from Agricultural Production, FAO Water Reports No 40, Food and Agriculture Organization of the United Nations, Rome, pp 1–14.
Park A, F Cai and Y Du (2010), ‘Can China Meet Its Employment Challenges?’, in JC Oi, S Rozelle and X Zhou (eds), Growing Pains: Tensions and Opportunity in China's Transformation, The Walter H. Shorenstein Asia-Pacific Research Center, Stanford, pp 27–56.
People's Daily (2014), ‘中国人民银行行长周小川等就 “金融改革与发展” 答记者问’ (People's Bank of China Governor Zhou Xiaochuan and Others Respond to Journalists' Questions Regarding ‘Financial Reform and Development’), People's Daily online edition, 11 March, viewed January 2016. Transcript available at <http://lianghui.people.com.cn/2014npc/GB/376648/382588/>.
People's Daily (2015), ‘藏粮于地、藏粮于技战略—习近平与 “十三五” 十四大战略’ (Storing Grain in the Ground, Storing Food in Technology – Xi Jinping and the 13th Five Year Plan Fourteen Great Strategies), People's Daily online edition, 22 November, viewed January 2016. Available at <http://politics.people.com.cn/n/2015/1122/c1001-27842000.html>.
Qin B and Y Zhang (2014), ‘Note on Urbanization in China: Urban Definitions and Census Data’, China Economic Review, 30, pp 495–502.
Roberts I and A Rush (2010), ‘Sources of Chinese Demand for Resource Commodities’, RBA Research Discussion Paper No 2010-08.
Roberts I and A Rush (2012), ‘Understanding China's Demand for Resource Imports’, China Economic Review, 23(3), pp 566–579.
Rovnick N (2013), ‘Why China Just Can't Quit Producing Aluminum, Despite a Global Glut’, Quartz, 11 March, viewed January 2016. Available at <http://qz.com/61798/why-china-just-cant-quit-producing-aluminum-despite-a-global-glut/>.
Saunders T (2015), ‘Developments in Thermal Coal Markets’, RBA Bulletin, June, pp 19–27.
Stanway D (2015), ‘China Steel Recycling Seen as Growing Threat to Iron Ore Demand’, Reuters.com United States edition, 6 February, viewed January 2016. Available at <http://www.reuters.com/article/china-steel-scrap-idUSL4N0VG46Q20150206>.
State Council (The State Council The People's Republic of China) (2013a), ‘国务院关于化解产能严重过剩矛盾的指导意见’ (Guidelines from the State Council on Resolving Contradictions Regarding Serious Overcapacity), Document No 41 (2013), 18 October. Available at <http://www.gov.cn/zhengce/content/2013-10/18/content_4854.htm>.
State Council (2013b), ‘国务院关于印发大气污染防治行动计划的通知’ (Notice that the State Council has Issued an Action Plan on Prevention and Control of Air Pollution), Document No 37 (2013), 10 September. Available at <http://www.gov.cn/zhengce/content/2013-09/13/content_4561.htm>.
State Council (2013c), ‘国务院关于加强城市基础设 施建设的意见’ (State Council Notice on Strengthening Urban Infrastructure), Document No 36 (2013), 16 September. Available at <http://www.gov.cn/zwgk/2013-09/16/content_2489070.htm>.
State Council (2014), ‘能源发展战略行动计划 (2014-2020年)’ (Energy Development Strategy Action Plan (2014-2020)), Document No 31 (2014), 7 June. Available at <http://www.gov.cn/zhengce/content/2014-11/19/content_9222.htm>.
State Council (2015a), ‘China Cuts Non-Residential Natural Gas Prices’, 18 November, viewed January 2016. Available at <http://english.gov.cn/news/top_news/2015/11/18/content_281475237414128.htm>.
State Council (2015b), ‘New Standard to Reduce Pollutant Emissions’, 2 December, viewed January 2016. Available at <http://english.gov.cn/premier/news/2015/12/02/content_281475246642991.htm>.
State Council (2016), ‘国务院再压减粗钢产能1-1.5亿吨’ (State Council Decides to Reduce Crude Steel Capacity by a Further 100-150 Million Tonnes), 26 January, viewed 28 January 2016. Available at <http://www.gov.cn/zhengce/2016-01/26/content_5036223.htm>.
Trussell P (2013), ‘Copper: Solving Society's Challenges’, Mines to Markets, Issue 3, Rio Tinto online magazine.
Tse P-K (2015), ‘The Mineral Industry of China’, 2013 Minerals Yearbook, Volume III – Area Reports: International – Asia and the Pacific – China (Advance Release), July 2015, U.S. Geological Survey, Washington DC, pp 9.1–9.28. Available at <http://minerals.usgs.gov/minerals/pubs/country/2013/myb3-2013-ch.pdf>.
Tu KJ and S Johnson-Reiser (2012), ‘Understanding China's Rising Coal Imports’, Carnegie Endowment for International Peace Policy Outlook, 16 February.
Tuck CA (2015), ‘Iron Ore’, Mineral Commodity Summaries 2015, U.S. Geological Survey, Washington DC, pp 84–85. Available at <http://minerals.usgs.gov/minerals/pubs/commodity/iron_ore/mcs-2015-feore.pdf>.
Wårell L and A Olsson (2009), ‘Trends and Developments in the Intensity of Steel Use: An Econometric Analysis’, Paper presented at Securing the Future: Mining, Metals & the Environment in a Sustainable Society and 8th ICARD (International Conference on Acid Rock Drainage), Skellefteå, 22–26 June.
White House (The White House, Office of the Press Secretary) (2014), ‘FACT SHEET: U.S.-China Joint Announcement on Climate Change and Clean Energy Cooperation’, 11 November.
White House (2015), ‘FACT SHEET: The United States and China Issue Joint Presidential Statement on Climate Change with New Domestic Policy Commitments and a Common Vision for an Ambitious Global Climate Agreement in Paris’, 25 September.
Wilkins K and A Zurawski (2014), ‘Infrastructure Investment in China’, RBA Bulletin, June, pp 27–35.
World Bank (2015), ‘Commodity Markets Outlook’, Q1, January.
World Coal Association (2014), ‘Coal Facts 2014’.
World Steel Association (2015), Steel Statistical Yearbook 2015, World Steel Association (worldsteel), Brussels.
Wu HX (2015), ‘Assessing “Returns on Capital” in the Chinese Economy’, The Conference Board China Center Special Briefing Paper No China-SBP-5-15-15.
Wu J, J Gyourko and Y Deng (2015), ‘Evaluating the Risk of Chinese Housing Markets: What We Know and What We Need to Know’, NBER Working Paper No 21346.
Wübbeke J and T Heroth (2014), ‘Challenges and Political Solutions for Steel Recycling in China’, Resources, Conservation & Recycling, 87, pp 1–7.
Xie J (2009), Addressing China's Water Scarcity: Recommendations for Selected Water Resource Management Issues, World Bank, Washington DC.
Xinhua News Agency (2014), ‘China Exclusive: China to Build 12 Power Transmission Lines’, 13 May, viewed January 2016. Available at <http://news.xinhuanet.com/english/indepth/2014-05/13/c_133331061.htm>.
Yam P (2013), ‘UPDATE 1-China State Stockpiler is Considering Buying Copper, Nickel – Sources’, Reuters.com United States edition, 17 December, viewed January 2016. Available at <http://www.reuters.com/article/2013/12/17/china-stockpiles-metals-idUSL3N0JW1YT20131217>.
Zhang G (2015), ‘张广宁: 在中国钢铁工业协会第五次会员大会上的讲话’ (Speech at 5th China Iron and Steel Association Members' Conference), Beijing, 12 January. Available at <http://www.chinaisa.org.cn/gxportal/DispatchAction.do?efFormEname=ECTM40&key=UTJaZVkyUTBQMQcwVzAMbVczAGACZlttVWUBNFk8BTAHFA9ACxBXZwARBUIAFwVn>.
Zhang X (2015), ‘China Uses Drones to Monitor Pollution Problem from Above’, Caixin Online, 29 May, viewed January 2016. Available at <http://english.caixin.com/2015-05-29/100814593.html>.
Zhou Z, W Tian, J Wang, H Liu and L Cao (2012), ‘Food Consumption Trends in China: April 2012’, Report submitted to the Australian Government Department of Agriculture, Fisheries and Forestry.


