RBA Annual Conference – 2016 A Rebalancing Chinese Economy: Challenges and International Implications Guonan Ma, Ivan Roberts and Gerard Kelly[*]
- Download 840KB
1. Introduction
China's twin imbalances – the high investment-to-GDP and low consumption-to-GDP ratios and the current account surplus – have been a focus of international policy discussions since the mid 2000s. Between 2000 and 2007, China's current account surplus surged from less than 2 per cent of GDP to 10 per cent. The rise in the current account surplus was accompanied by a sharp increase in the household saving rate (31 per cent to 39 per cent of household disposable income) and in the investment share of GDP (33 per cent to 40 per cent). In the wake of China's policy response to the global financial crisis, the investment share of GDP expanded even further, reaching 44 per cent in 2014, although the current account surplus has receded to around 2 per cent.
Multiple explanations have been offered to explain China's imbalances, ranging from the managed exchange rate regime (Goldstein and Lardy 2008), ‘financial repression’ (Lardy 2008) and broader factor cost distortions (Huang and Tao 2011) to rapid wealth accumulation (Ma, McCauley and Lam 2013), demographic transition (Cai 2011) and even population control policies (Wei and Zhang 2011). The twin imbalances have in turn been held responsible for the ‘global savings glut’, excessively low global interest rates in the 2000s (Bernanke 2007) and the global financial crisis (Obstfeld and Rogoff 2009). The rise in debt that has accompanied the domestic investment imbalance has also raised concerns that a sudden deleveraging could trigger a financial crisis within China itself (Pettis 2013). Perceived negative implications of these imbalances have led to repeated calls for China to rebalance both its domestic demand structure and its pattern of trade (e.g. IMF 2010, 2015).
The implications of Chinese domestic ‘rebalancing’ are, ex ante, ambiguous for external rebalancing and for the global economy. The relationship between saving, investment and the trade balance can be represented by the identity:
where Y refers to GDP, C refers to consumption, I to investment, X to exports and M to imports. Of course, this accounting identity reveals nothing about the causality between the savings gap (Y − C − I) and China's external surplus (X − M).[1] The rise in China's external surplus in the 2000s coincided with an increase in investment relative to output and an even stronger rise in saving. In an accounting sense, a more balanced domestic demand structure may occur alongside either a rise or a fall in the external balance, depending on the relative speed with which investment and saving ratios adjust.
Ma et al (2013) argue that China's twin imbalances can be understood as the product of large income windfalls that were saved, giving rise to large external surpluses. An advantage of this explanation is that it reconciles rapid growth in both investment and consumption with the rise of the external surplus over the 2000s. Ma et al predict that as these windfalls fade and the real effective exchange rate appreciates alongside rising unit labour costs, saving will fall.
In contrast, Huang and Tao (2011) and Pettis (2013) suggest that both internal and external imbalances in China have had a different root cause: labour and capital market distortions that have artificially lowered the cost of labour and capital, repressed consumption and suppressed the value of the renminbi. They argue that both imbalances may be tackled simultaneously by reducing these distortions. Similarly, Obstfeld and Rogoff (2009, p 39) contend that ‘if typical Chinese savers had access to relatively safe instruments offering higher rates of return, huge positive income effects would in all likelihood swamp substitution effects, resulting in lower, not higher, household saving. The result would be higher household welfare in China, as well as a reduction in China's foreign surplus.’ Yet Fukumoto and Muto (2011) provide an historical counterexample to this claim. They observe that, in practice, a relaxation of factor cost distortions in Japan in the 1970s led to a more rapid fall in the investment rate than in the saving rate, which in turn fuelled a widening of the current account surplus.
To date, domestic rebalancing (defined as a fall in the investment-to-GDP ratio and rise in the consumption-to-GDP ratio) has lagged the reduction of the external imbalance. So a central question is whether, over the next decade or so, China can achieve a meaningful domestic rebalancing while maintaining slower but more sustainable growth, without a much wider external imbalance. In this paper, we make several points about the likelihood of a ‘double rebalancing’.
First, we review the literature and empirical evidence regarding the main factors behind the domestic and external imbalances, highlighting the central role of a high, rising and now peaking Chinese saving rate. China's gross national saving has been evolving in response to large shocks from structural forces, institutional transformation and government policy. These shocks, together with new ones, are likely to condition rebalancing in the decade ahead.
Second, we highlight the extraordinary strength of Chinese household consumption in recent years, by the standards of Chinese history and in comparison to other economies. Even if consumption has been ‘repressed’ by factor price distortions, as argued by many commentators, such comparisons cast doubt on the likelihood that an acceleration of consumption will be the primary driver of further domestic rebalancing. Any meaningful rebalancing will most likely flow from a sharp deceleration of investment, further weighing on an economy that is already experiencing slower growth in potential output.
Third, using an approach similar to Bai, Hsieh and Qian (2006), we provide evidence that the return to capital in China has fallen noticeably in recent years. This has been driven by a steep rise in the capital-to-output ratio, amid signs that the sustained downward pressure on the labour share of income may now be easing or even reversing. The decline in the return to capital has occurred alongside an upward shift in the cost of debt funding, with the result that the gap between the two has narrowed sharply and the incentives to invest have fallen. A continuation of this trend points to a further decline in the growth of investment in coming years.
Fourth, we consider quantitative scenarios of rebalancing for the period of 2015–30 to illustrate that a simultaneous resolution of domestic and external rebalances, while maintaining reasonable growth, is possible but quite challenging. Our scenarios underscore the ‘knife-edged’ nature of domestic rebalancing. Even the ‘moderate’ rebalancing and growth scenario that we consider involves a considerable growth slowdown, a rising capital-to-output ratio and a further decline in the return to capital. If the domestic rebalancing is rapid, the implied disparity between the growth of consumption and investment requires both exceptional resilience of consumer spending on the demand side and a swift increase in the efficiency of investment on the supply side. If it is slow, the capital-to-output ratio rises to potentially unsustainable levels and real household consumption per capita falls short of the levels of a contemporary upper middle-income economy, even by 2030.
Finally, the wider effects of domestic rebalancing in China on its trading partners depend on the composition of bilateral trade flows and the extent to which that composition and relevant prices adjust in response to the changing structure of China's economy. The existing literature does not support an especially sanguine view. Ahuja and Nabar (2013) use a dynamic panel model to assess the spillover effects of an investment slowdown in China. They find that there could be sizeable negative effects for capital goods exporters (such as Germany and Japan) and commodity producers, such as Australia, Brazil and Canada. Mohommad, Unteroberdoerster and Vichyanond (2012) reach similar conclusions using Asian input-output tables, which allow them to account for regional supply-chain linkages.
We confirm and update these findings using broader global input-output tables published by the OECD, building on previous work by Kelly (2014) and Kelly and La Cava (2014). Assuming that the structure of global trade with China remains broadly stable and that relative price adjustments are of second-order importance, our calculations suggest that domestic rebalancing in China will be negative for countries that export resource commodities, including Australia. Regional producers of manufacturing inputs that have been used intensively in Chinese capital formation, including South Korea and Japan, may experience similar effects. Our assumptions can be questioned, but a robust implication is that a large-scale reorientation of production and trade would need to occur to mitigate the negative impact of Chinese rebalancing on these economies.
The paper proceeds as follows. The next section discusses stylised facts about China's domestic and external imbalances and reviews the evidence on factors underpinning the high saving and investment rates that have occurred historically. Section 3 discusses mechanisms that are likely to be important in facilitating continued rebalancing, while Section 4 constructs scenario projections for output, consumption, saving, investment and the return to capital to illustrate the likelihood (or otherwise) of a ‘double rebalancing’. We then explore how different rebalancing scenarios could affect China's trading partners, using data from global OECD input-output tables. Section 5 offers concluding remarks.
2. China's Twin Imbalances: Facts and Issues
This section highlights some stylised facts about China's aggregate demand, raises a number of key issues central to its domestic and external imbalances and explores their implications for rebalancing. First, based on an analysis of flow-of-funds data, we argue that conventional analysis understates the role of the household sector in contributing to the high investment share. Second, we stress that consumption growth has been far from anaemic over the past three decades by international standards, suggesting that looking forward the burden of rebalancing will mostly be assumed by investment. Finally, we argue that, while policy changes designed to remove factor price distortions may facilitate rebalancing, it will probably happen as a natural outcome of dwindling income windfalls from earlier productivity shocks, the unwinding of demographic shifts, and maturing housing markets which helped drive the imbalances in the first place.
In the space of three decades, China's aggregate demand composition has experienced a sea change. From the 1980s to the end of the 2000s, household consumption as a share of GDP fell from more than one-half to a little over one-third, while gross capital formation jumped from one-third to just below one-half (Figure 1). China's saving rate rose even faster than its investment rate, accompanying a large current account surplus peaking at 10 per cent of GDP in 2007. In short, China experienced both greater domestic and external imbalances during this period.
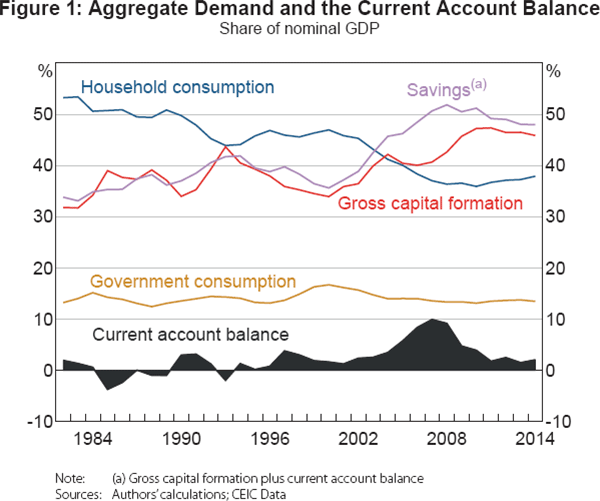
In just a few short years following 2007, the Chinese current account surplus shrank to below 3 per cent of GDP. This rapid external rebalancing was facilitated both by an appreciation in the renminbi and a step rise in the investment rate that coincided with a peaking national saving rate (Ma et al 2013). In other words, China's domestic imbalance increased while its external imbalance eased. This was precisely the opposite of Japan's experience of domestic rebalancing coinciding with a wider external surplus in the 1980s (Fukumoto and Muto 2011).
2.1 Who saves and invests in China?
At a more disaggregated level, an analysis of the Chinese flow-of-fund accounts data, which cover the period from 1992 to 2013, sheds some light on the main sources of the rising saving and investment rates. The flow-of-funds data are conceptually consistent with the national accounts on both an expenditure and an income basis while revealing the sectoral breakdowns of these expenditure and income flows by household, corporate and government. The data help answer the question of who consumes, saves and invests – a core issue in any discussion of rebalancing.[2]
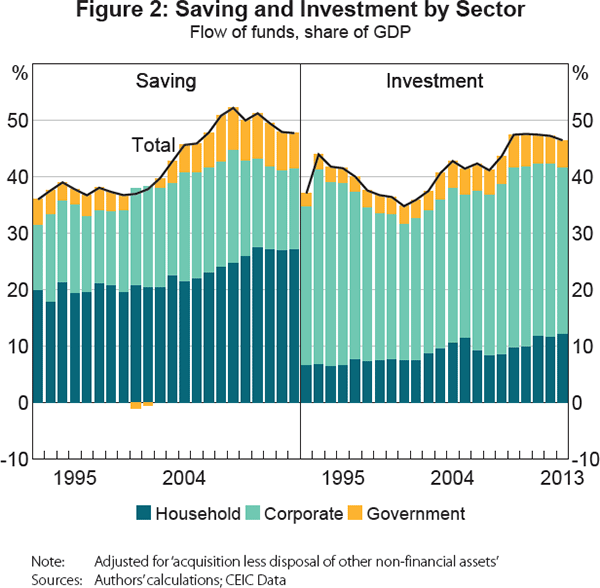
During these two decades, China's gross capital formation as a share of GDP rose by 10 percentage points, yet the national saving rate climbed even more — by 12 percentage points (Figure 2). The saving rate peaked at 52 per cent of GDP in 2008, declining thereafter. By contrast, the investment rate plateaued around 47 per cent in the early years of the current decade, in part owing to the large-scale government stimulus program in the wake of the global financial crisis. The three sectors — household, corporate and government — all contributed positively to China's high and rising investment and saving rates during 1992–2013, albeit to varying degrees.
2.1.1 Saving
The household sector has been the largest driver of China's gross domestic saving, accounting for around half in 2013 and generating nearly two-thirds of the rise in the national saving rate during the two decades for which we have flow-of-funds data. The corporate and government sectors each contributed roughly one-fifth of the increased saving. As a share of GDP, household saving displayed a steady and relentless climb starting in the early 2000s. After a brief period of dissaving in 2000–01, government saving also increased strongly, while corporate saving peaked in 2008 and has fallen since then. Reported lower corporate earnings are consistent with our estimates of the declining return to capital (see Section 3).
2.1.2 Investment
In contrast, the dominant source of investment has been the corporate sector. In 2013, the corporate, household and government sectors represented 63 per cent, 26 per cent and 10 per cent, respectively, of the nation's gross capital formation, which are comparable to the averages of their OECD counterparts. Unsurprisingly, corporate investment has been most volatile, swinging between a quarter and one-third of GDP and apparently peaking in 2010. By comparison, gross capital formation by the government sector has risen steadily over time, particularly since the early 2000s when government saving also began to increase, before easing off in 2011–13.
A little-noticed fact, however, is that within the space of a couple of decades, gross capital formation undertaken by Chinese households almost doubled, single-handedly accounting for well over half of the 9½ percentage point increase in China's investment rate during this period.[3] If the rise in the investment share during the two decades is viewed as evidence of ‘overinvestment’, the Chinese flow-of-funds data suggest that the household sector could be one principal culprit.
There are a couple of reasons why we might observe a rising share of investment by households. The first is capital accumulation associated with self-employment. Between 1992 and 2013, rural and urban self-employment tripled as a share of the nation's total employment, rising to more than 13 per cent. Capital accumulation by households is likely to have accelerated accordingly. Rising self-employment has been an important by-product of China's growing private sector (Lardy 2014).
A second explanation for rising household capital formation is that housing-related investment by individuals has increased substantially since the early 1980s. Following the introduction of the household responsibility system to the rural areas in the 1980s, there was a burst of housing construction activities by farmers. In the 1990s, the government initiated a wave of de facto state housing privatisation in urban areas, which led to substantial renovation, upgrading and extension of old state housing units that had been of poor condition and low quality. The 2000s witnessed a big leap in the floor space of residential housing built by developers, most of which was ultimately funded by households. In addition, much newly completed urban housing in China is in rough ‘shell’ form and thus often requires major fitting outlays managed by new home buyers. These three waves of private housing construction and upgrading activity are likely to have contributed to growth in measured investment by the household sector.
2.1.3 Roles of income and saving rate in household consumption
In contrast to its prominent role in driving both China's rising aggregate saving and investment rates, the household sector's share of gross national disposable income fell noticeably through the 2000s, with the corporate and government sectors splitting the implied gain in the remainder (Figure 3). Since 2008, the household income share has started to rise at the expense, in particular, of the corporate income share, but in net terms the household income ratio has remained below its level in the 1990s. As a share of GDP, the decline in household income and the rise in household saving together imply a steep rise in the average propensity to save out of household disposable income.
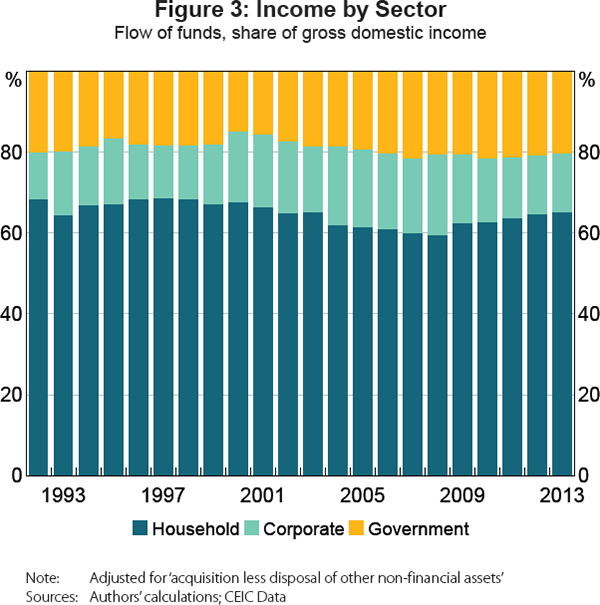
While the literature has emphasised the declining household share of income as the main factor weighing down the household consumption share of GDP (Aziz and Cui 2007; Ma and Yi 2010; Perkins 2015), the Chinese flow-of-funds data suggest that the rise in the average propensity of households to save has been more important in explaining the declining share of household consumption in the Chinese economy. Flow-of-funds data indicate that the decline in the household income share of GDP and increase in the average propensity to save contributed 20 per cent and 80 per cent, respectively, of the observed decline in the household consumption share of GDP during the 1992–2013 period.[4] We now turn to each of these factors in turn.
There is no shortage of potential explanations for a high and rising average propensity to save by Chinese households. Modigliani and Cao (2004) argue that the observed household saving rate can be explained by a life-cycle model featuring dissaving in early life, positive saving in working years and dissaving in retirement, together with China's rising working-age population in recent decades. Blanchard and Giavazzi (2006) and Chamon and Prasad (2010) argue that a rising burden of private health and education expenses in a climate of underdeveloped financial markets has increased self-insurance/precautionary saving motives. Wei and Zhang (2011) attribute increased saving to efforts by young men to purchase housing and signal prosperity in a marriage market characterised by a high male-female gender ratio.
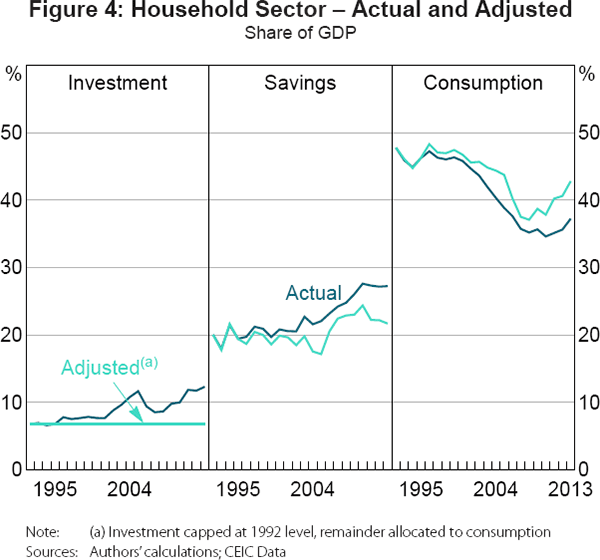
To these we can add a complementary and more straightforward explanation. Specifically, as a share of GDP, the increase we observe in household capital formation can itself account for more than three-quarters of the rise in household saving and thus could explain more than half of the reported fall in household consumption during the 1992–2013 period. Put differently, if we capped gross capital formation undertaken by the household sector at the 1992 level of 6.8 per cent of GDP for all subsequent years and allocated the remaining investment to consumption, household consumption would decline from 48 per cent of GDP to only 43 per cent instead of the recorded 37 per cent in 2013. Similarly, household saving would only rise from 20 per cent of GDP to 22 per cent instead of the observed 27 per cent (Figure 4).
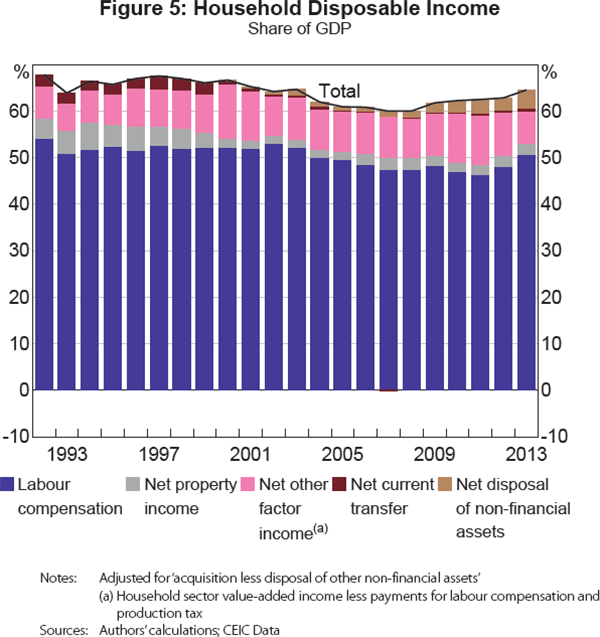
Flow-of-funds data indicate that, for most of the period since 1992, the household income share was primarily weighed down by the falling share of labour compensation, although falls in the shares of net current transfers (consistent with declining social welfare programs) and net property income in the early 2000s also contributed (Figure 5). The falling labour share is attributed by some to the relaxation of controls on internal migration under the hukou (household registration) system from the 1980s, which permitted a larger pool of incoming surplus rural labour and allowed urban enterprises to restrain wage growth despite a relaxation of wage controls (Perkins 2015). The less restrictive hukou system over the years thus helped enhance allocative efficiency and economic growth but also added to the ‘imbalance’ of a high investment rate and low consumption rate.
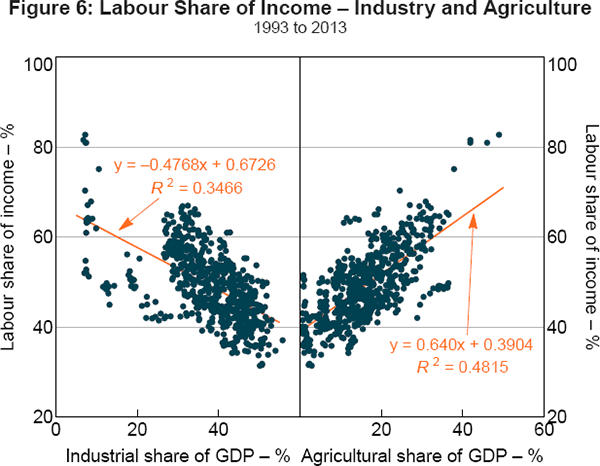
As barriers to internal migration were eased, labour also became more mobile across industries and regions. Using econometric methods, Bai and Qian (2010) argue that around one-third of the decline in the labour share in the early 2000s can be explained by a changing labour share within industries, which they attribute to reforms that restructured state-owned enterprise and expanded monopoly power in the industrial sector. But they find that two-thirds of the decline reflected the structural transition from agriculture (where the labour share is very high) to services (which displays a much lower average labour share). This explanation is supported by the negative correlation between the labour share and the share of more capital-intensive industry at the provincial level (Ma and Yi 2010). Indeed, this relationship has been robust through time, and the reverse correlation can also be observed for agriculture (Figure 6).
While the labour compensation share of GDP declined during the 1990s and 2000s, the negative effect on the household income share was partly offset by rising net income from sales of land use rights (reflected in ‘net acquisition of non-financial assets’) and net ‘other factor income’ associated with the rise in the ranks of self-employed, noted above. Interestingly, net income from property has roughly halved since the early 1990s, largely reflecting a drop in net interest income. According to flow-of-funds data, around 80 per cent of the fall in net interest income is attributable to the rise in household interest payments, suggesting that a sizeable part of the decline in the household income share has actually been related to inclusive financial liberalisation rather than ‘financial repression’.[5]
2.2 How unusual is China's pattern of investment and consumption?
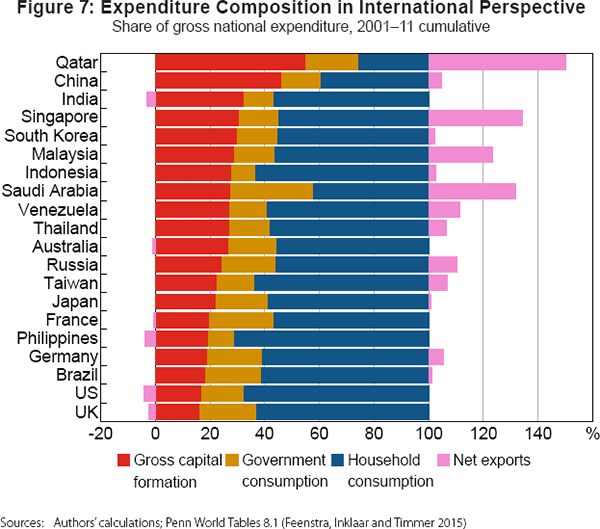
China's investment has typically been deemed too high and too low at the same time: too high relative to consumption in the context of domestic final expenditure (the domestic imbalance) but too low relative to domestic saving from the perspective of the current account (the external imbalance). Descriptions of China's consumption, investment and saving patterns as ‘unbalanced’ are usually made with reference to cross-country and historical comparisons. Indeed, China has one of the most unusual domestic expenditure compositions globally, printing one of the highest investment rates and lowest household consumption rates among major advanced and emerging market economies (Figure 7).[6] The sustained gap between investment and consumption rates is exceptionally large and has few parallels outside major oil-exporting countries. Nevertheless, China's external balance seems quite moderate when compared to many of its international peers, at least when averaged over a run of 10 years or so.
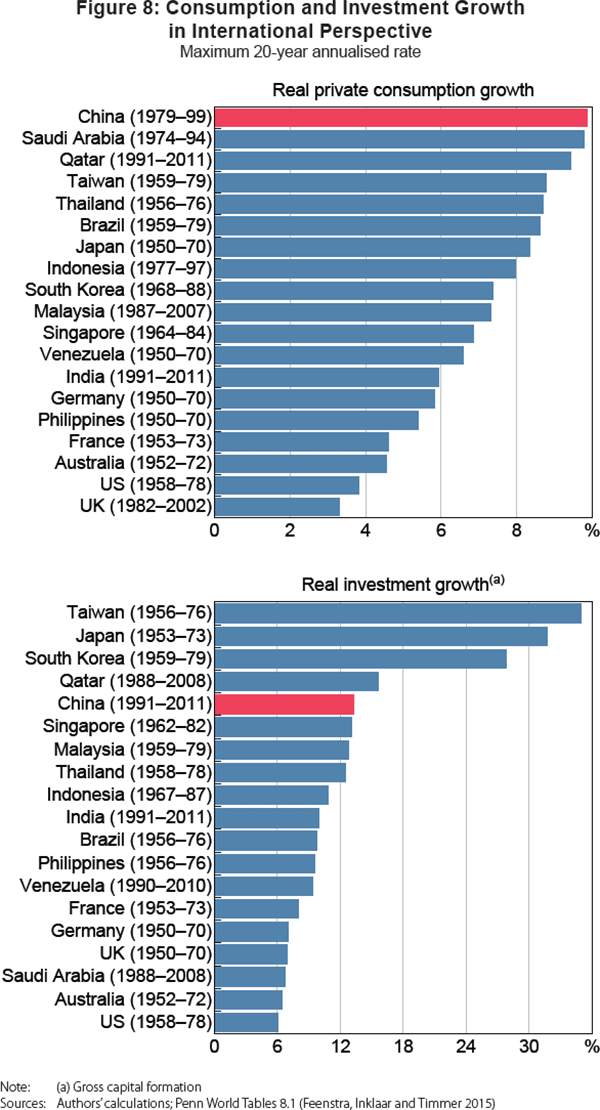
The relatively low consumption share of GDP and its fall over the past few decades raise the question of whether Chinese consumption has been ‘weak’ by international standards or the standards of China's own history. On average, household consumption growth was the lowest among all the major domestic expenditure components during 1978–2014 (Table 1). But growth has nonetheless averaged 9 per cent for more than three decades, a rapid pace by international standards. The lopsided nature of China's growth pattern principally reflects the fact that investment had been expanding at an even faster, double-digit, pace until 2010.
| GDP | Consumption | Gross capital formation | ||||
|---|---|---|---|---|---|---|
| Total | Private | Government | Total | Fixed | ||
| 1978–2014 | 9.7 | 9.2 | 9.0 | 10.0 | 10.4 | 11.1 |
| 1978–2007 | 9.9 | 9.4 | 8.9 | 10.8 | 10.2 | 11.1 |
| 2000–07 | 10.8 | 8.8 | 9.0 | 8.4 | 14.0 | 14.4 |
| 2007–14 | 8.8 | 8.7 | 9.5 | 6.7 | 11.2 | 11.3 |
| 2007–10 | 9.8 | 9.1 | 9.8 | 7.7 | 15.6 | 15.7 |
| 2010–14 | 8.1 | 8.3 | 9.3 | 5.9 | 8.1 | 8.1 |
|
Sources: Authors' calculations; CEIC Data; NBS (2015) |
||||||
A simple international comparison also helps place China's so-called ‘investment-led’ and ‘consumption-repressed’ growth pattern in some perspective. Figure 8 displays 20-year windows for the maximum annualised growth rates for private consumption and investment for selected economies in the post-War era. While high relative to most economies, China's speed of capital accumulation is outstripped by Taiwan, Japan and South Korea's development experiences. In contrast, Chinese private consumption growth has exceeded that of most major advanced and emerging market economies in the period since World War II.
In sum, China's pattern of domestic demand has been quite unusual and lopsided, but it is hard to attribute the big rise in China's saving and investment rates to ‘anaemic’ private consumption. As we discuss below, we place a greater weight on an alternative interpretation that attributes the imbalances to structural drivers of high saving and rapid investment growth.
2.3 Explaining the imbalances
Two competing, but also potentially complementary, hypotheses have been put forward to explain the puzzle of China's sustained surplus saving and unusually unbalanced pattern of domestic demand. One view argues that policy distortions are the principal reason (Huang and Tao 2011; Singh, Nabar and N'Diaye 2013). An alternative view assigns a greater role to structural changes and natural economic forces (Ma et al 2013). These views have different implications for the ongoing and prospective domestic rebalancing.
One view argues that policy distortions, mostly in the form of subsidies to depress factor costs, have been the primary drivers behind the rising external and domestic imbalances. These distortions include currency undervaluation, repressed interest rates ‘subsidising’ corporate investment or the banking system, subsidised costs for land, energy and the environment, and ‘artificially’ low labour compensation under the weight of the household registration (or hukou) system, which restricts the social security entitlements of migrant workers. Collectively, these distortions are viewed as depressing household consumption, stimulating investment and boosting exports relative to an assumed counterfactual, giving rise to the twin imbalances and ‘artificially’ high growth.
Nevertheless, the effects of these distortions are often more ambiguous than they appear at first glance. For instance, while subsidised energy costs may support a higher rate of investment and production than would be possible at market prices, they may also help explain China's rise as a big net energy importer, which, other things equal, tends to reduce its current account surplus. Similarly, while the hukou system impedes rural–urban labour mobility, the effect on aggregate household income growth is ambiguous ex ante. Although greater portability of welfare benefits should buoy household incomes and lower the household saving rate, the net effect of hukou reform on total income will depend on mobility between industries and different sectoral elasticities of substitution between labour and capital. The relaxation of hukou policies may indeed be partly responsible for driving the labour income share lower in the 2000s.
Similarly, low regulated benchmark deposit rates are sometimes thought to suppress household consumption in China (Lardy 2008; Pettis 2013). Nabar (2011) uses provincial panel data from 2006–09 to argue for a dominance of income over substitution effects due to target saving behaviour by households. Berkelmans, Kelly and Sadeghian (2016) present time series evidence that deposit demand does not respond positively to increases in deposit rates. However, the available empirical evidence relies heavily on the relationship between saving or deposits and inflation-adjusted regulated deposit rates. To some extent, de facto interest rate deregulation since the late 2000s via rapid issuance of wealth management products with market-based interest rates may have offset the effect of regulated interest rates in suppressing consumption growth.
In view of the difficulty of identifying the net effect of factor price distortions on imbalances, Ma et al (2013) instead emphasise the central role of China's high saving rate in explaining its twin imbalances. They conjecture that multiple favourable demand and productivity shocks in the 1980s, 1990s and 2000s lifted potential growth of the Chinese economy; in an environment of incomplete financial markets and underdeveloped welfare safety nets, these shocks gave rise to large income windfalls that were mostly saved, while boosting both consumption and investment spending.
The first two decades of the reform era witnessed at least two significant positive shocks to income growth: the successful rural household responsibility system in the 1980s; and the large wave of employees leaving their state employers to create their own private businesses in the wake of Deng Xiaoping's Southern China Tour in the early 1990s. Moreover, the interactions between a falling dependency ratio and massive rural–urban labour migration kept non-farm wages lower than otherwise, lifting corporate earnings and returns to capital. Wrenching restructuring of state firms reduced job security, improved efficiency, cleared room for the expansion of private firms and lifted corporate earnings, all boosting private saving. The institutional changes in the pension system, private home ownership and the introduction of mortgages also strengthened incentives to save and fuelled a property investment boom. Finally, China's World Trade Organization (WTO) accession in 2001 prompted a wide-ranging market opening, attracted more foreign transfers of technology and secured access to a booming foreign market, all of which supported corporate cash flows.
The role played by the development of housing markets in China deserves special emphasis. In 1988, the Chinese constitution was amended to legalise the transactions of land use rights, laying the foundation for private home ownership (Fang et al 2016). Throughout the 1980s and 1990s, most of the housing provided by state-owned enterprises to their employees was privatised at a discount to the replacement cost. Mortgages were introduced in 1997, and official mortgage rates were cut five times during 1998–2002 to counter the negative consequences of the Asian financial crisis.
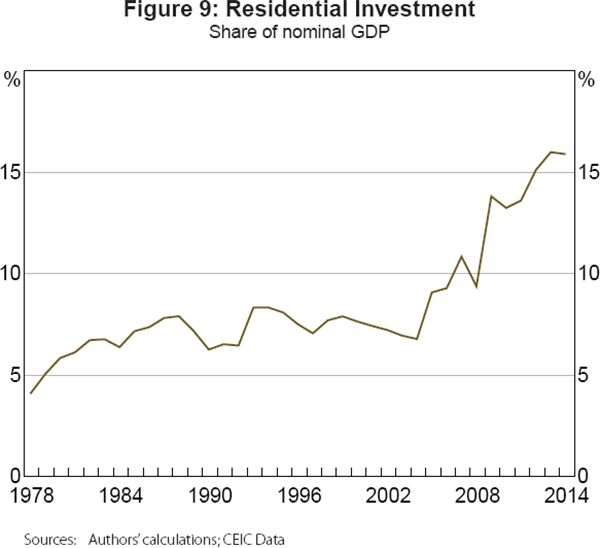
The development and deregulation of housing markets saw residential investment rise sharply starting in the early 2000s to almost 16 per cent of GDP currently (Figure 9).[7] This housing boom stimulated huge capacity building in many related upstream and downstream industries, including steel, cement, glass, household appliances and financial services. Using data from the 2010 input-output tables and more up-to-date data on value added, Xu, Jia and Li (2015) estimate that, directly and indirectly, residential housing accounted for 29.4 per cent of GDP growth in 2013.
It is likely that the housing boom simultaneously boosted growth, investment and saving in China while subtracting from net household income (through higher mortgage payments). The rise of private home ownership in the late 1990s boosted incentives to save by households strongly motivated to upgrade their housing and to build up private assets, while generating higher investment. As discussed, the rise in household investment largely reflected individual investment in residential construction. The property investment booms in the 2000s further boosted land sales proceeds accruing to local Chinese governments, helping to fund investment in infrastructure. At the same time, the steady rise of mortgage loans as a share of total credit (reaching 12 per cent in 2014) implied larger interest payments by home buyers to financial institutions and a corresponding fall in households' net property income. In turn, this contributed to the decline in the household share of income in the 1990s and 2000s.
The housing boom increased both sales volumes and prices, lifting corporate earnings and the return to capital across many related industries and helping to underpin strong corporate saving and investment until the late 2000s. In sum, the opening of the housing market can be viewed as a prolonged positive demand shock to the Chinese economy, sustaining returns to capital, boosting investment and lifting both private and public saving at the same time (Ma et al 2013; Xu et al 2015).
2.4 Prospects for domestic rebalancing
Several reasons have been offered in favour of the view that a more balanced pattern of growth in China would have local and global benefits. Obstfeld and Rogoff (2009) argue that China's current account surplus underpinned global imbalances which contributed to the global financial crisis in 2008–09. Yu (2007) contends that China has misallocated resources by running large current account surpluses. On this view, by running a large capital account surplus and current account surplus simultaneously (accommodated by the accumulation of sizeable foreign exchange reserves), China ‘parks’ its excess savings abroad in the form of US Treasuries rather than undertaking more profitable and socially beneficial domestic investment, which is already high. A higher consumption share could also be directly welfare-enhancing if it is facilitated by reforms and policies that improve the income distribution and develop the social safety net (Cai and Roberts 2015).
An additional argument in favour of rebalancing is that the high investment share in recent years has been sustained by sharply rising leverage. Rebalancing will therefore help address associated financial risks and reduce the likelihood of a financial crisis occurring (Pettis 2013). Indeed, leverage has had an important role to play in China's unbalanced growth pattern, particularly since 2008. Prior to this, the foreign sector appeared to have accommodated China's big capacity build-up without much leverage, as the current account surplus surged (Figure 10). Despite the 1998–2008 investment boom, the nation's total credit to the non-financial private sector as a share of GDP rose modestly from 106 per cent to 116 per cent. One possibility is that the rising Chinese investment was mostly ‘funded’ by retained earnings from a booming export market following China's WTO accession.
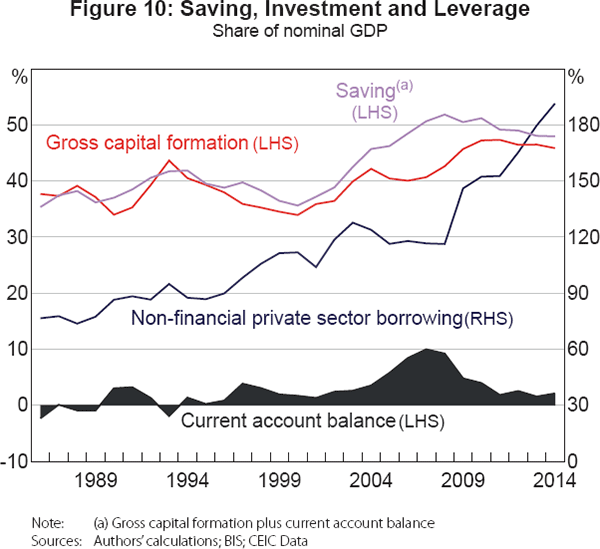
In contrast, the shrinking of China's current account surplus from 10 per cent of GDP in 2007 to 2 per cent in 2014 coincided with a rapid leveraging-up. This surplus saving was mostly reduced by a step rise in the investment rate, as Chinese policymakers hastened to boost growth via a massive credit stimulus. Total credit to the non-financial private sector jumped from 116 per cent in 2008 to 191 per cent in 2014. Moreover, the post-crisis boom of investment in the credit-intensive property sector also triggered a compositional upward shift in the indebtedness of the corporate sector (Chivakul et al 2015; Zhang et al 2015; Roberts and Zurawski 2016). Finally, externally oriented firms with weaker cash flows due to dwindling overseas sales may have been forced to take on higher leverage to fund investment. Thus, the rapid compression of China's external surplus, while reducing global imbalances, probably came at the price of a steep rise in leverage.
Rebalancing may help reduce the risk of disruptive financial dislocations in the future. But more prosaically, it could simply mitigate poor returns to inefficient investment in industries and regions facing conditions of oversupply. The perception by China's government that the existing growth pattern had become ‘unbalanced, uncoordinated and unsustainable’ led to an official commitment in the Twelfth Five-Year Plan (2011–15) to seek a more balanced pattern of domestic demand.[8] This is again reflected in the newly drafted Thirteenth Five-Year Plan of 2016–20.
How might rebalancing play out in practice? The very high rate of consumption growth in recent years suggests that, realistically, any rebalancing to a higher consumption share is more likely to involve a deceleration of investment than an acceleration of consumption. There is historical support for such a conjecture. For this purpose, we define ‘rebalancing’ as a shift from a very ‘unbalanced’ situation in which the investment share of GDP has on average exceeded the household consumption share of GDP for at least five years, to a situation in which the reverse prevails for a subsequent five years. There are relatively few historical examples of such a rebalancing, and it is rarer still for them to be accompanied by an increase in consumption growth from previous rates. In a sample of 167 economies between 1950 and 2011, there are 10 cases of rebalancing on this definition. In the majority of cases, household consumption growth in the five years after such a ‘rebalancing’ was lower than in the five years before (Table 2).[9]
It might be argued that defining rebalancing as a change in the sign of the gap between private consumption and investment shares is too restrictive. After all, the historical rebalancing experiences of Japan and South Korea are excluded on this formulation.[10] But even if we use an alternative criterion (such as an increase in the difference between the household consumption and investment shares of 20 percentage points), the results are similar.[11] It should be noted that the reasons behind different rebalancing experiences are diverse. In some cases (such as that of Angola), the timing corresponds to periods of political conflict and famine. For a number of Middle Eastern nations (including Saudi Arabia), the timing may reflect income shocks due to rapid changes in oil prices, or war (as in the case of Iraq in 2003 and subsequent years). Several Asian economies, including Indonesia, South Korea and Thailand, experienced a degree of rebalancing following the Asian financial crisis. Similarly, the timing of rebalancing for the Philippines and some Latin American economies coincides with periods of external debt crisis.[12]
| Gross capital formation | ||||
|---|---|---|---|---|
| Share of GDP(a) | Growth(b) | |||
| Before | After | Before | After | |
| Angola (1995–2004)(c) | 33.2 | 12.2 | 10.9 | −14.5 |
| Brunei Darussalam (1979–88)(c) | 7.0 | 11.7 | 16.7 | −0.5 |
| Congo (1981–90)(c) | 40.6 | 19.8 | 8.5 | −16.1 |
| Gabon (1984–93)(c) | 35.4 | 21.2 | −3.6 | −7.8 |
| Japan (1970–79)(d) | 37.0 | 31.6 | 6.9 | 2.7 |
| Philippines (1979–87)(d) | 33.8 | 19.9 | 5.4 | −10.4 |
| Qatar (1979–88)(c) | 20.6 | 16.7 | −7.6 | −2.4 |
| Saudi Arabia (1976–85)(c) | 29.1 | 26.9 | 12.8 | −2.4 |
| South Korea (1993–2002)(d) | 36.6 | 28.7 | 6.8 | 1.7 |
| Thailand (1993–2002)(d) | 40.1 | 21.8 | 2.2 | −9.1 |
| Uruguay (1966–75)(c) | 48.6 | 19.7 | 19.0 | 2.2 |
| Venezuela (1978–86)(c) | 46.1 | 25.3 | −9.1 | −4.9 |
| Household consumption | ||||
| Share of GDP(a) | Growth(b) | |||
| Before | After | Before | After | |
| Angola (1995–2004)(c) | 31.5 | 42.4 | 5.1 | 19.5 |
| Brunei Darussalam (1979–88)(c) | 6.3 | 20.6 | 16.2 | 11.7 |
| Congo (1981–90)(c) | 40.2 | 56.3 | 12.7 | −2.3 |
| Gabon (1984–93)(c) | 33.2 | 38.3 | −2.4 | 3.1 |
| Japan (1970–79)(d) | 49.8 | 53.7 | 4.9 | 5.0 |
| Philippines (1979–87)(d) | 62.1 | 69.4 | 3.5 | 2.3 |
| Qatar (1979–88)(c) | 19.6 | 28.0 | −5.8 | −1.5 |
| Saudi Arabia (1976–85)(c) | 26.4 | 40.9 | 16.1 | 10.9 |
| South Korea (1993–2002)(d) | 52.6 | 54.3 | 7.2 | 3.9 |
| Thailand (1993–2002)(d) | 51.9 | 54.1 | 5.5 | 2.4 |
| Uruguay (1966–75)(c) | 46.4 | 71.5 | 3.6 | 1.3 |
| Venezuela (1978–86)(c) | 40.1 | 46.6 | 4.3 | 2.6 |
|
Notes: (a) Five-year cumulative share Sources: Authors' calculations; Penn World Tables 8.1 (Feenstra, Inklaar and Timmer 2015) |
||||
Indeed, the question of how rebalancing might play out depends on the reasons for the imbalances. In practice, it is likely that a combination of both policy distortions and saved windfalls from positive shocks has contributed to China's imbalances. But the implications of the two hypotheses are different for prospective rebalancing. Factor price distortions that arise as a result of public policy can in general only be removed by policy reversals. Logically, for instance, interest rates need to be raised to stimulate household consumption, according to the target saving argument (Nabar 2011). In contrast, vanishing income windfalls, or the negative consequences of slower reallocation of labour, an ageing population, less low-hanging fruit from market liberalisation and diminishing pull effects from a more balanced housing market, may occur naturally and in tandem with slower potential growth, irrespective of the stance of policy.
In Section 3, we consider how some of the earlier tailwinds to the Chinese economy may now have reversed, weighing on potential growth, lowering returns to capital and thereby forcing a prospective domestic rebalancing through slower capital formation. But a fall in investment growth may weaken growth of private consumption too, due to slower job creation and falling wage growth. A benign form of rebalancing would involve household consumption expenditure slowing, but still growing at a faster pace than gross capital formation. A degree of resilience in consumption matters crucially for an orderly domestic rebalancing, as we illustrate in Section 4.
The role of maturing housing markets may prove to be especially important in triggering internal rebalancing. The housing market has evolved from undersupply 20 years ago to a now normalising and more balanced sector in terms of demand and supply, even with some pockets of oversupply (Chivakul et al 2015). The outlooks for urbanisation, demographics and income growth all suggest that, in trend terms, Chinese residential construction may already have peaked (Berkelmans and Wang 2012; Perkins 2015). Wu, Gyourko and Deng (2015) estimate that during the boom decade of 2001–10, housing demand exceeded supply by 14 per cent in aggregate but fell short of it by 10 per cent during 2011–12. Their estimate of the nationwide vacancy rate also doubled between 2002 and 2013. Higher inventories and slower sales should lower returns to capital and investment in real estate and related sectors. Weaker corporate earnings, slower land sales proceeds and slower job creation could in turn combine to trim China's aggregate saving rate as well.
As falling investment growth rather than rising consumption growth is likely to be the main channel through which internal rebalancing will occur, we now consider a key mechanism – namely the decline in the return to capital relative to the cost of funding new corporate investment in China.
3. Mechanisms for Internal Rebalancing
In this section, we revisit and update the estimates constructed by Bai et al (2006) of the return to capital in China, using a slightly modified approach. We then compare our estimates to a proposed measure of the average real funding cost facing the Chinese corporate sector.
Bai et al (2006) use a method derived from Jorgenson's (1967) neoclassical theory of investment. Their basic equation to obtain a real net rate of return for owners of capital is as follows:
where it measures the nominal return to capital,  is the GDP deflator,
  is the price
of capital, αt is the capital share of income,
Yt is total income, Kt is the capital stock and
δt is the depreciation rate. In this formulation, the return to
capital is composed of three parts: an estimate of the marginal revenue product of capital;
a real ‘capital gain’ term (the rate of change in the price of capital in terms
of consumables); and a depreciation rate. When the prices of capital and output are the
same, the return to capital is equal to the marginal physical product of capital
(αtYt/Kt) – that is, the
product of the capital share of income and the inverse capital-to-output ratio – net
of depreciation.[13]
3.1 Components of the return to capital
To estimate Rt, we construct a dataset of its constituents. For GDP, we use official data from the national accounts. To ensure internal consistency between our estimates of the return to capital and the expenditure-side scenarios we present later (see Section 4), we use the National Bureau of Statistics (NBS) expenditure-side estimate of GDP in constant 1978 prices and a corresponding deflator. We derive estimates of real gross capital formation (GCF) and the investment deflator using data on expenditure-side contributions published for the period from 1978 to 2014. These estimates are backcast using data from NBS (2007). Our data on gross fixed capital formation (GFCF; GCF net of inventories) is obtained using the same data sources and a number of assumptions.[14]
Data on the aggregate capital stock are required to estimate a capital-to-output ratio. In their original work, Bai et al (2006) estimate separate capital stocks and prices for structures and equipment investment using rescaled data on flows of fixed asset investment (FAI).[15] In view of the limited available data on the components of gross (fixed) capital formation and bearing in mind the conceptual discrepancies with FAI data (Holz 2006), we instead assume a single homogeneous type of capital. We construct a capital stock using the perpetual inventory method. The capital stock is initialised in 1978 using a method similar to that of Bai et al (2006) and de la Fuente and Donénech (2000).[16] In the absence of reliable information about economy-wide depreciation rates, we use a constant rate of 7 per cent, although our results are robust to the range of depreciation rates used in the literature.[17]
Holz (2006) and Wu (2015) warn against the inclusion of residential housing in estimates of the capital stock on the grounds that it is a non-productive asset. The importance of housing as an engine of growth in China since the late 1990s, discussed in the previous section, raises doubts about the accuracy of excluding it mechanically from estimates of capital accumulation or the return to capital. But it is still worth considering the robustness of our findings to alternative assumptions about the coverage of the capital stock and GDP. Accordingly, to abstract from housing, we estimate the residential housing stock using an approach similar to that described in Koen et al (2013). We estimate GDP excluding expenditure on residential housing by using national accounts data on the consumption of residential housing services.
We estimate the share of payments to capital, αt, by estimating the labour share of income, 1 − αt. As the return to capital that is relevant for the corporate sector is net of taxes, in some variations we also exclude net taxes on production and income from the capital share. We rely on physical transactions data from the flow-of-funds accounts to estimate the labour share of income. A key advantage of these data is that, in theory, they are comprehensive (unlike data on the urban wage bill), and consistent with national accounts estimates of gross value added (unlike provincial compensation of employees data). As the flow-of-funds data are only available from 1992 to 2013, we backcast the labour share for earlier years using aggregate compensation of employees from the gross provincial product data.[18] We project the labour share to 2014 using an estimate of total private (including both private enterprises and self-employed) and non-private compensation in urban areas. We scale this estimate up to the level of total compensation in the flow-of-funds accounts.
We now examine the main constituents of our estimate of the return to capital in detail.
3.1.1 Capital-to-output ratio
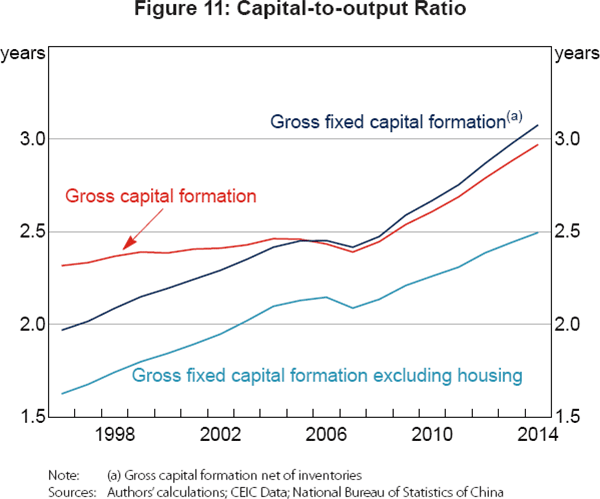
The capital-to-output ratio has grown rapidly in recent years (Figure 11). The ratio increased at a slowing pace through the late 1990s and early 2000s, even declining in 2007. But coinciding with the government's macroeconomic stimulus in 2008–09, the capital-to-output ratio began to increase sharply and has maintained a steep upward trajectory since then. Excluding inventories from the investment measure used to calculate the capital stock tends to increase the level of the capital-to-output ratio and sharpen its upward trajectory, due to a declining contribution of inventories to growth in GCF over much of the recent period. Excluding housing tends to lower the capital-to-output ratio, consistent with large net additions to the stock of residential property over the past 16 years or so.
3.1.2 Labour share of income
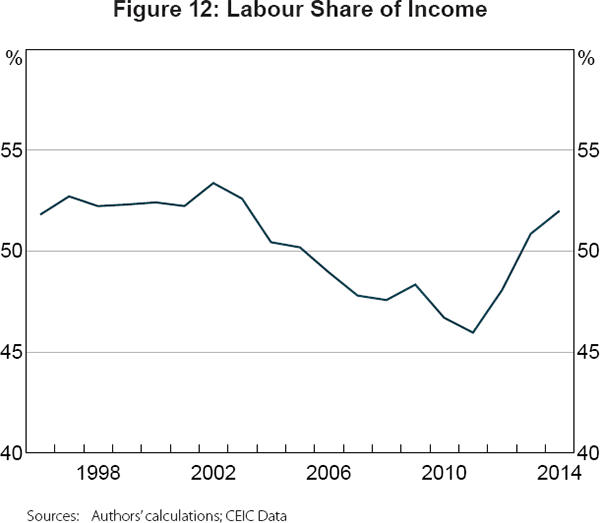
The labour share of income in China has generally fallen since the mid 1990s, consistent with global trends and contributing to China's high return to capital until the early 2010s (Figure 12). China's labour share is low at around 52 per cent of GDP, compared to 75 per cent for the United States. In an international context, the long-term decline in the labour share of income is typically attributed to advances in information technology that have led firms to shift from labour-intensive production towards capital-intensive production (Karabarbounis and Neiman 2014). But as discussed in the previous section, in China's case, explanations for the decline have instead focused on changing patterns of labour migration across regions and sectors.
While the estimate for 2014 is a projection based on trends in urban wage data, and must therefore be treated with caution, it provides tentative evidence that, since 2011, the downward trend has reversed. This development is potentially significant from the perspective of rebalancing. Fukumoto and Muto (2011) argue that a rising labour income share played a crucial role in the rise of Japan's consumption share in the 1970s.
A number of possible reasons for the reversal can be conjectured. China's working-age population has started to decline, placing downward pressure on growth in the labour supply. At the same time, the large-scale migration from rural to urban areas that characterised much of the reform period and depressed urban wages has already slowed substantially, consistent with assessments that the quantity of ‘surplus’ labour in the countryside has fallen (Garnaut 2010; Cai 2011; Ma et al 2013). Industrial structure has also changed noticeably since the early 2000s. While the size of the agricultural sector has continued to decline (which would tend to put downward pressure on the labour income share), the share of services industries, in terms of both output and employment, has been rising, largely at the expense of more capital-intensive heavy manufacturing output in total value added and potentially adding to the labour income share.
3.2 Estimating the return to capital
Combining the above ingredients, we obtain benchmark estimates of the return to capital in China (Figure 13). A feature of the estimates is that the return to capital increased in the mid 2000s, but since 2008 has experienced an oscillating decline. This finding is consistent with the falling share of corporate income in GDP (Figure 3) and is robust to alternative measurements of the capital stock and labour share. If we consider the return to fixed investment (as opposed to investment including inventories), we obtain a higher return to capital. The wedge between the two series has declined over time, reflecting a higher real capital-to-output ratio for fixed investment.[19] Adjusting our calculations to exclude residential housing from gross fixed investment and calculating the capital share net of taxes on production and income, the dynamics are a little different, but a similar overall trend decline in the return to capital since 2008 can be observed.
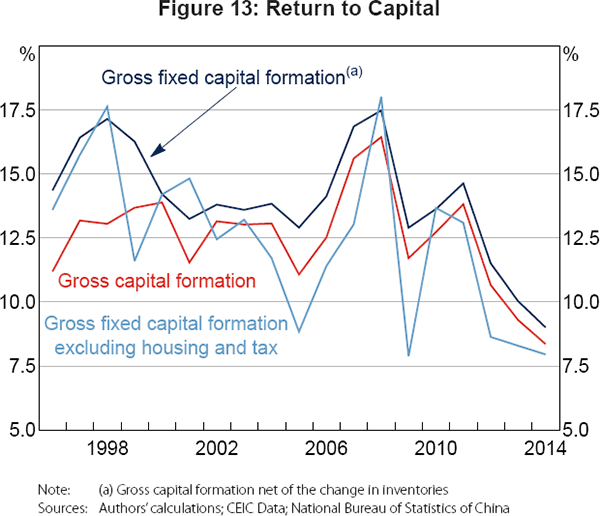
Mechanically, the decline in the return to capital since the late 2000s can largely be accounted for by a resumption of the upward trend in the capital-to-output ratio combined with a jump in the price of investment goods that explains the sharp increase in 2008.[20] Up until 2011, the falling labour share of income offset the deteriorating marginal product of capital, but the reversing labour share tends to reinforce it in the last few years of our sample.[21]
3.3 Corporate funding costs
Business investment hinges on the gap between the prevailing corporate funding cost and the expected earnings from new projects, both on a risk-adjusted basis. Thus, it is plausible that the decline of the return to capital since 2008 has affected the incentives of the corporate sector to undertake new investment. To consider this issue, we treat our estimate of the real return to capital as a proxy for expected corporate earnings and compare it to an estimate of inflation-adjusted corporate borrowing costs.
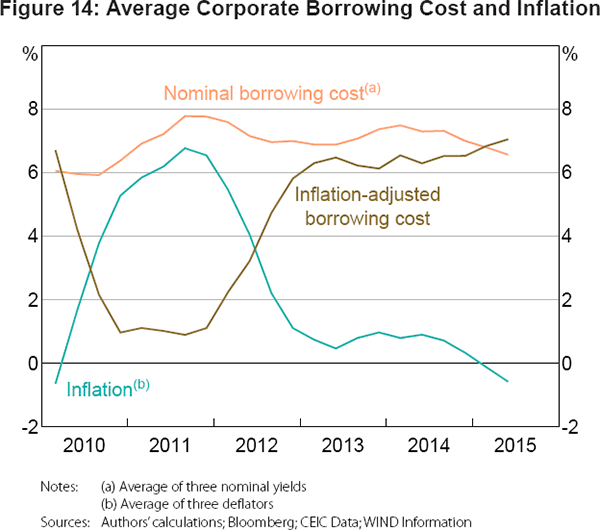
To avoid taking a strong view about which interest rates and inflation rates are most relevant for the Chinese corporate sector, we average a range of nominal interest rates and inflation rates to derive a proxy for the real corporate cost of borrowing. We proxy the nominal corporate borrowing cost with a weighted average of three interest rates: the weighted average rate on general loans published by the People's Bank of China (PBC); the average collective trust product advertised yield (as reported by Wind Information); and the 5-year AA corporate note yield to maturity (sourced from Bloomberg). We choose these interest rates as they are reasonably representative of the medium-term corporate financing cost in a financial system in which banks have a dominant position but the importance of ‘shadow banking’ and corporate debt securities has grown. The interest rates are weighted together using break-adjusted stocks of credit, trust financing and corporate bond financing from the total social financing statistics published by the PBC.[22]
We then adjust the average nominal corporate borrowing cost for inflation using a geometric average of the following three price deflators: the consumer price index (CPI); the implicit GDP deflator; and the producer price index (PPI). These inflation indicators are ex post, but the inclusion of an inflation expectations measure, such as the consensus CPI forecast, does not alter the picture substantially. The three inflation indicators have been quite volatile over time and can diverge considerably from each other from time to time. For instance, while both the CPI and GDP deflator grew by about 1½ per cent in 2014, the PPI was deflating over the same period. Nevertheless, all three price measures since 2011 have shared a distinctly disinflationary trend, which has contributed to an upswing in the real corporate financing cost (Figure 14).
3.4 Comparing corporate funding costs and the return to capital
As our estimates of both the return to capital and the real corporate borrowing cost are only rough, and measured with considerable margin for error, the absolute difference between the two series may not be informative. But the broad trends in both series suggest that the gap might have narrowed considerably in recent years (Figure 15). In combination with the easing of macroeconomic stimulus after 2010 and efforts by authorities to keep broad credit growth in check, the narrowing gap may help account for a halving of the average pace of China's GCF from 15 per cent in the 2000s to 8 per cent in the 2010s (Table 1).
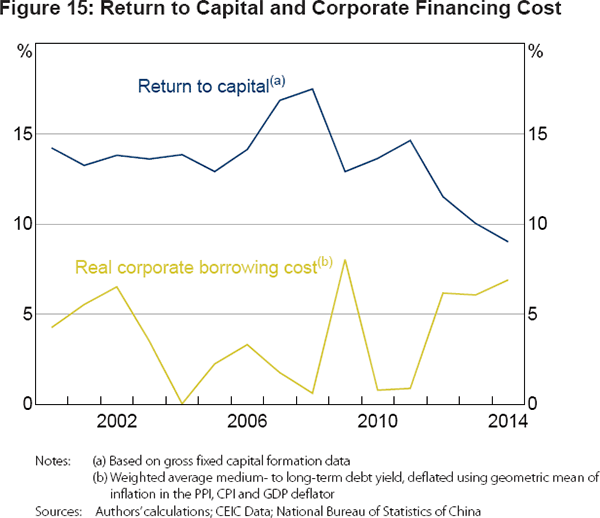
If it persists, the shrinking gap between the cost of funding and returns to investment will continue to exert downward pressure on investment growth. The behaviour of the real interest rate is hard to predict, as it depends on the stance of monetary policy, the domestic saving-investment balance, the degree of capital account openness and global interest rates, among other factors. But our scenarios (Section 4) suggest little upside for the return to capital in the near future, which, all else equal, should contribute to a process of internal rebalancing.
4. Scenarios for Rebalancing
In this section, we argue that China's domestic rebalancing may have started in the current decade. To consider the logical possibilities for continued rebalancing, we then construct rebalancing scenarios and discuss their implications. Our calculations indicate that the case for a meaningful and urgent domestic rebalancing is strong, but that the rebalancing task will be challenging in light of the concurrent slowing in potential growth.
4.1 Has the domestic rebalancing started?
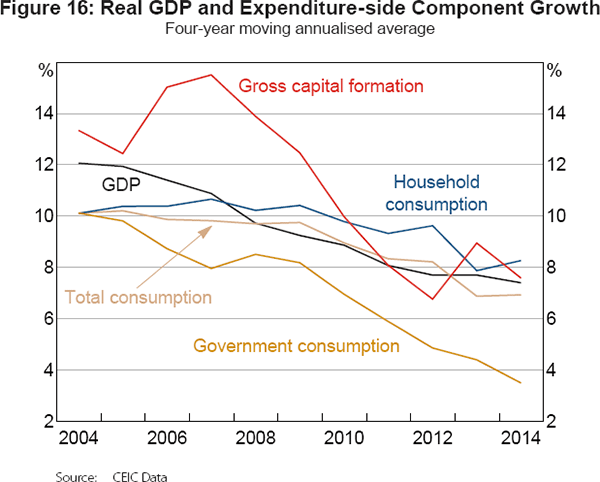
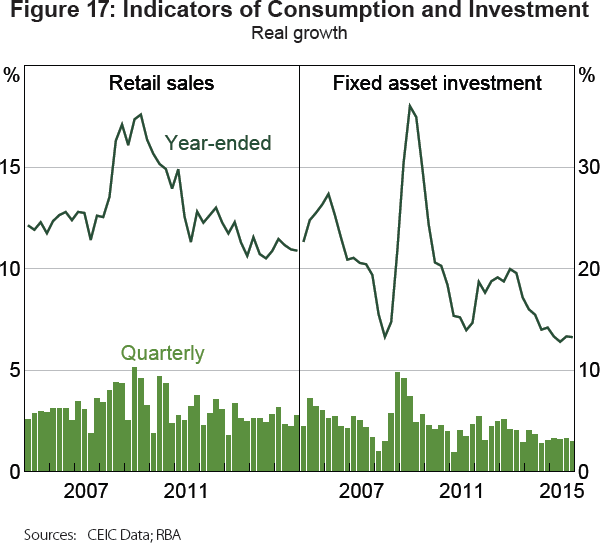
Between 2010 and 2014, the nation's aggregate saving and investment rates both declined from their recent peaks, while the household consumption share of GDP increased from its 2010 trough. Real growth of household consumption outpaced the growth of both investment and government consumption over this period (Figure 16). A similar picture can be gleaned from higher-frequency indicators. Although the growth rates of both retail sales and FAI have moderated since 2010, retail sales growth has been resilient while investment growth has declined (Figure 17).
A question remains whether this apparent turn is cyclical or structural. The process of concurrent rebalancing and moderating growth may not always follow a smooth path, with possible cyclical overshoots and undershoots along the way. While cyclical swings cannot be completely ruled out, there are at least two reasons why the economic adjustments over the past five years can be viewed as having structural features.
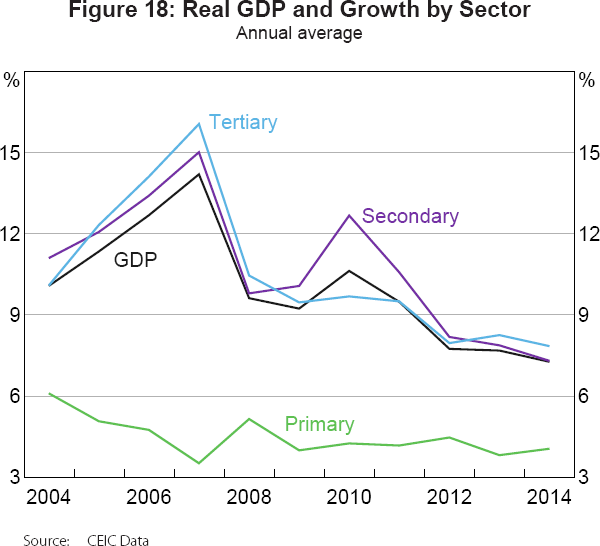
First, the tailwinds behind the positive income shocks in the past two decades (gains related to economic reform and the ‘demographic dividend’ implied by a rising working-age population) have now started vanishing and may even reverse in the decade ahead. Second, there are signs of a more permanent resource reallocation on the supply side of the Chinese economy. A less capital-intensive services industry finally outgrew the manufacturing and construction sectors in the 2010s, contributing to decelerating investment while sustaining a reasonable pace of job creation (Figure 18).
For the past two years, real growth in the less capital-intensive tertiary sector has exceeded that of the rest of the economy. Productivity growth in services is typically found to be lower than in the industrial sector. To the extent that this is true in China, a bigger services sector may weigh on China's potential growth, although there is scope for such a compositional shift to support the labour share of national income and cushion employment and consumption during the slowdown. Furthermore, the production- and expenditure-side trends should be mutually reinforcing. The expansion of a less capital-intensive services sector is likely to reduce overall investment growth, while the expansion of the consumption share of expenditure is likely to support growth in the services sector (for reasons to be discussed in Section 4.4).
4.2 Possible trajectories and their implications
To consider the prospects for domestic rebalancing, we adopt a simple framework to assess the implications of various rebalancing scenarios for the period of 2015–30. In this section, we frame the prospective domestic demand rebalancing as a one-to-one rotation between consumption and GCF.[23] These rebalancing scenarios are combined with alternative growth scenarios to inform us about the implied growth patterns of key aggregate demand components. For now, we assume that the share of net exports in GDP remains unchanged at its 2014 level; this assumption is relaxed in Section 4.4.
We consider three different scenarios for domestic rebalancing over the period of 2015–30, taking the observed 2014 shares of total consumption and GCF in GDP as our starting benchmarks (51.2 per cent and 46 per cent respectively). Our scenario for ‘moderate’ domestic rebalancing assumes a rise of 15 percentage points in the nominal consumption share and a corresponding 15 percentage point fall in the nominal investment share by 2030, with the nominal net export share remaining constant at its 2014 level (2.7 per cent). On average, domestic rebalancing progresses 1 percentage point per annum during 2015–30, unwinding most of the domestic imbalance accumulated over the past three decades and returning China's domestic expenditure profile to the pattern seen in the first half of the 1980s (Figure 19).
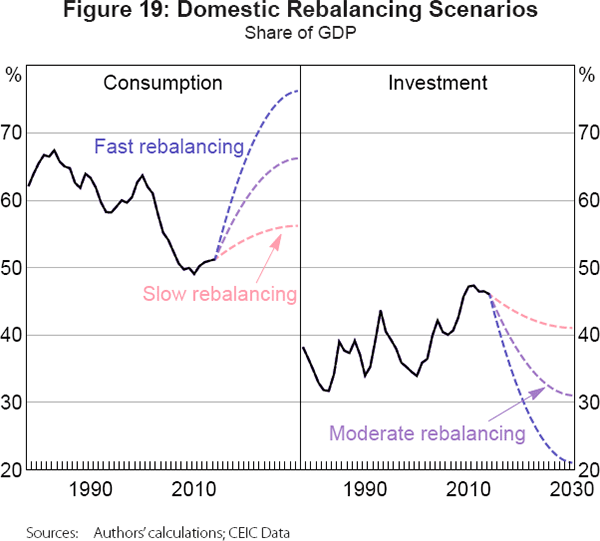
In addition to this ‘moderate’ rebalancing scenario, we consider an alternative ‘slow’ scenario, involving a 5 percentage point rotation between consumption and investment shares, and a ‘fast’ scenario, involving a 25 percentage point rotation (Figure 19). While slow rebalancing only brings China's domestic expenditure composition broadly back to that witnessed around the mid 2000s, a fast rebalancing process would move China to a domestic expenditure pattern that resembles that of an average contemporary OECD economy by 2030. We assume that the rebalancing process is geometric – that is, the component shares converge smoothly to their terminal levels, which are specified in Table 3.
| Rebalancing scenario | Consumption | Gross capital formation | Net exports | ||
|---|---|---|---|---|---|
| Total | Private | Government | |||
| Slow | 56.2 | 41.4 | 14.9 | 41.0 | 2.7 |
| Moderate | 66.2 | 48.7 | 17.5 | 31.0 | 2.7 |
| Fast | 76.2 | 56.1 | 20.1 | 21.0 | 2.7 |
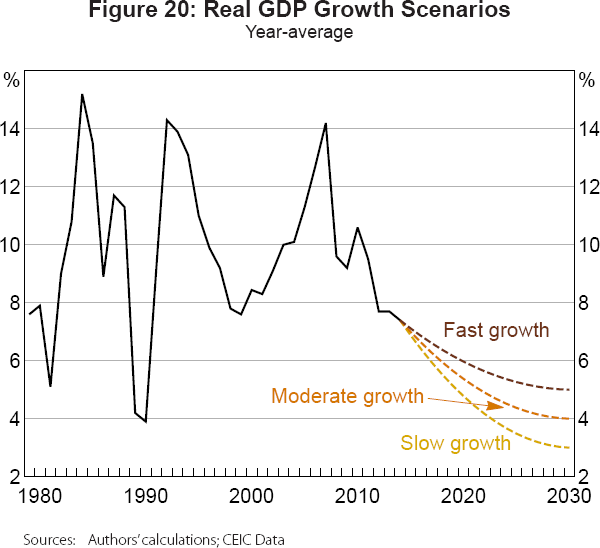
As Chinese living standards rise and the size of its economy expands, the rate of potential growth can be expected to converge gradually towards that of advanced economies. Any domestic rebalancing will be intertwined with this expected potential growth slowdown in the years ahead. In our scenarios for the period of 2015–30, we consider three different cases for the terminal GDP growth rate in 2030: 4 per cent for the ‘moderate’ growth case, 3 per cent for the ‘slow’ growth case, and 5 per cent for the ‘fast’ growth case (Figure 20; Table 4). These 2030 growth rates are relatively conservative and within the ‘ballpark’ estimates and projections of the World Bank and DRC (2013, 2014), Ma et al (2013) and Perkins (2015).
| Growth scenario | Growth rate in 2030 | Average annual growth rate | |||
|---|---|---|---|---|---|
| 2015–30 | 2016–20 | 2021–25 | 2026–30 | ||
| Slow | 3.0 | 4.4 | 5.6 | 3.9 | 3.1 |
| Moderate | 4.0 | 5.1 | 6.0 | 4.7 | 4.1 |
| Fast | 5.0 | 5.7 | 6.4 | 5.5 | 5.1 |
Each GDP growth scenario, combined with a particular rebalancing scenario, will mechanically yield average annualised growth rates for the various GDP components over the scenario period. However, because the scenarios' GDP growth rates are in real terms while the GDP component shares are in nominal terms, the real growth of GDP components implied by such a combination is conditional on an additional assumption regarding changes to relative prices. For simplicity, we assume constant growth in the overall GDP deflator from 2015–30, with equivalent growth in both the consumption and investment deflators, such that relative prices remain unchanged.[24]
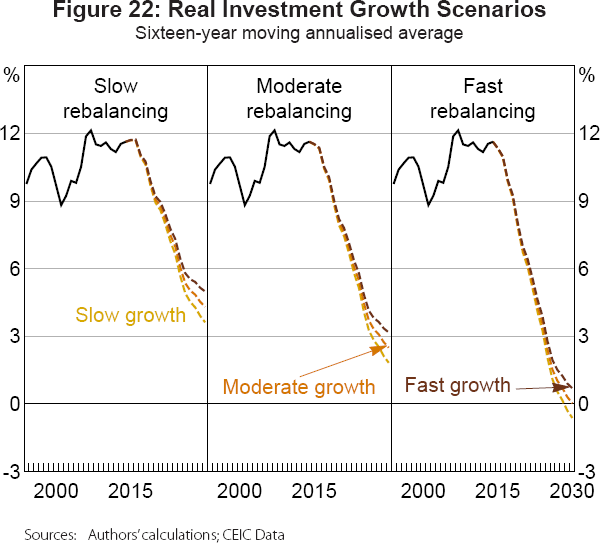
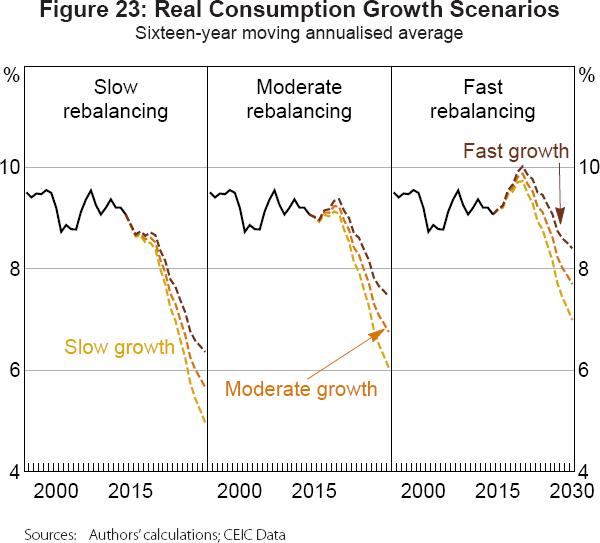
Table 5 summarises the average annualised real growth rates in total consumption and investment (GCF) implied by each combination of growth and rebalancing scenarios for the period 2015–30.[25] For example, a ‘moderate growth and rebalancing’ scenario would require annualised growth rates of 5.1, 6.8 and 2.5 per cent for GDP, consumption and investment.
| Rebalancing scenario |
Growth scenario | ||
|---|---|---|---|
| Slow | Moderate | Fast | |
| GDP | 4.4 | 5.1 | 5.7 |
| Consumption | |||
| Slow | 5.0 | 5.7 | 6.4 |
| Moderate | 6.1 | 6.8 | 7.5 |
| Fast | 7.0 | 7.7 | 8.4 |
| Investment | |||
| Slow | 3.6 | 4.3 | 5.0 |
| Moderate | 1.8 | 2.5 | 3.2 |
| Fast | −0.6 | 0.0 | 0.7 |
While these exercises tell us little about how or whether a particular investment growth rate can support a particular consumption growth rate, they highlight a couple of key points. First, a fast rebalancing in coordination with rapid growth requires continued rapid consumption growth (more than 8 per cent per annum) and virtually no growth in investment. The discussion of historical rebalancing experiences in Section 2 suggests that there are few precedents internationally for such an outcome. Second, even in the event of slow or moderate growth in GDP, a fast rebalancing requires prolonged weakness in investment and rapid growth in consumption. For this to occur, the impact of radically lower investment growth on household incomes and consumption would have to be very small. In other words, these experiments raise doubts about the likelihood that China's rebalancing process will be rapid.
Using the same perpetual inventory method outlined in Section 3, we can estimate the implications of our scenarios for China's capital-to-output ratio, which has surged since the global financial crisis (Figure 21).[26] Under a ‘moderate’ scenario for both growth and rebalancing, the capital-to-output ratio does not stabilise until around 2020, at a level around 3.2 years. By comparison, moderate growth combined with slow domestic rebalancing together imply that the capital-to-output ratio would climb to a level of 3.8 years by 2030 – high by international standards (Berlemann and Wesselhöft 2014) – and continue to rise beyond. Such an outcome would weigh heavily on the return to capital and might be unsustainable, increasing the risks of significant financial stress, misallocation of resources and potentially an abrupt halt to economic growth at some point.
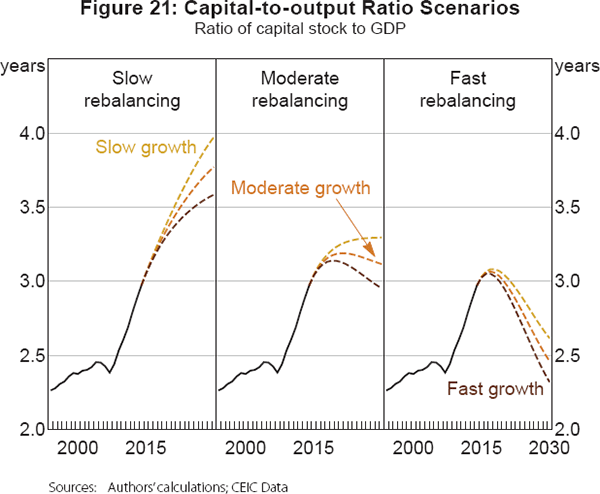
While such a scenario highlights the urgency of the domestic rebalancing task, it also reveals the extent of the challenge facing policymakers. In all our scenarios, a meaningful deceleration of real investment from its current growth rate (around 7½ per cent) is required to restrain growth in the capital-to-output ratio (Figure 22). Similarly, consumption growth significantly below 7 per cent per annum is unlikely to be sufficient to allow a peak in the capital-to-output ratio by 2030 (Figure 23).[27]
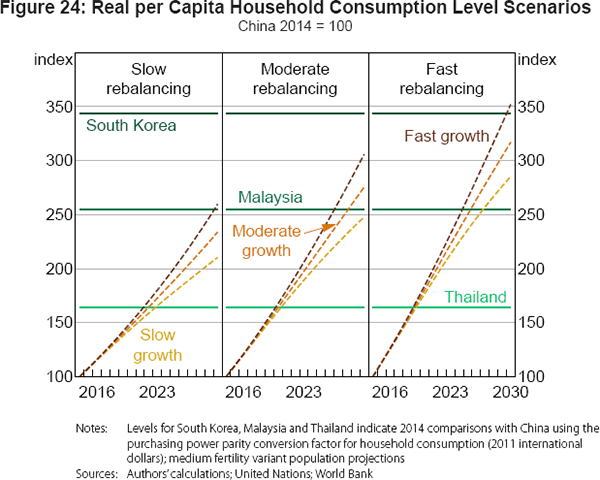
Our scenarios also have implications for the level of household consumption per capita in China. Certain combinations of rebalancing and growth scenarios could see Chinese real per capita household consumption approach or even exceed the current levels of other upper middle-income economies by 2030 (Figure 24).[28] However, this still assumes remarkable resilience in Chinese private consumption in the face of difficult rebalancing, as international experiences of consumption growth outstripping investment growth for an extended period are the exception, rather than the rule. While China did undergo a period of strong overall growth outpaced by even stronger consumption growth in the early reform years, the abatement or reversal of the favourable shocks underpinning that episode suggest that it is unlikely to be repeated in the near future.
The relationship between a given investment share of GDP and the ‘efficiency’ with which this investment translates into GDP growth gives a further perspective on the plausibility of the various scenarios. Assuming no change in the net export share of GDP, a combination of sustained rapid (or even increasing) consumption growth together with a meaningful decline in the investment share of GDP could only occur if new investment had a relatively immediate, sizeable effect on overall GDP growth, implying constant or increasing returns to China's stock of capital at the margin and continuously improving allocative efficiency.[29] If we instead consider the possibility that the efficiency of new investment is invariant to the degree of rebalancing, it would suggest a relationship between the size of the fall in the investment share and the extent of the slowdown in overall growth. In Figure 25, we take the path of the incremental capital-to-output ratio implied by the moderate growth and rebalancing scenario as an independent variable and let growth become dependent on the degree of rebalancing. The comparison indicates that unless faster rebalancing is matched by more efficient investment, the process may drive a slowdown in overall growth that could largely offset the positive effect on consumption caused by the shifting domestic demand profile.
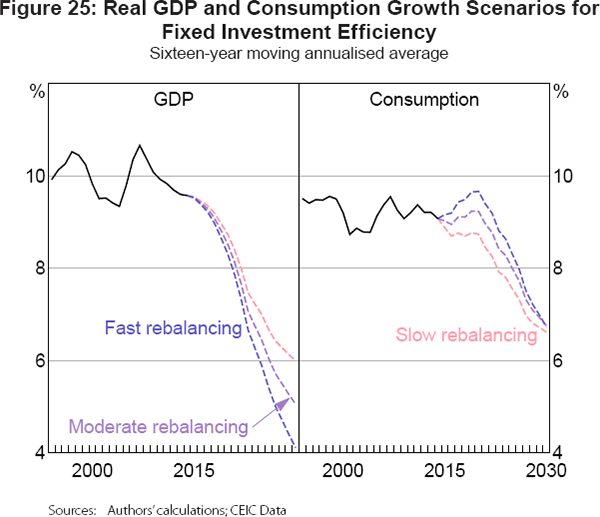
Our scenarios underscore the challenges involved in reconciling a rebalancing Chinese economy with slowing potential growth, and the role that measures to enhance the efficiency of investment would need to play in this process. They also highlight the ‘knife-edged’ nature of domestic rebalancing. If rebalancing is too slow, the capital-to-output ratio rises to potentially unsustainable levels, and real household consumption per capita struggles to attain that of a contemporary upper middle-income economy even by 2030. If it is too fast, the required disparity between the growth of consumption and investment would imply both exceptional resilience of consumer spending on the demand side and a swift increase in the efficiency of investment on the supply side. Finding that delicate balance in practice could prove challenging.
4.3 Expenditure rebalancing and the production side
While a general equilibrium analysis of expenditure rebalancing is beyond the scope of this paper, data on inter-industry linkages suggest that a rotation from investment towards consumption may interact with structural change taking place on the production side of the economy. The ongoing shift in the production share towards more labour-intensive services industries and away from manufacturing and construction should mean that, increasingly, less capital expenditure is required to generate a given level of employment and household income growth. At the same time, the rise in the consumption share of domestic expenditure could be expected to reinforce the shift from the secondary to the tertiary sector, due to the differing impacts that consumption and investment demand have for different industries.
Many industries play an important role in producing goods and services for both consumption and investment, either directly or through the production of intermediate inputs. The direct implications of changes in expenditure shares for the demand for different varieties of final products are relatively clear. Investment expenditure is directed largely towards construction and the production of capital goods, while consumption expenditure is directed primarily towards services industries and the manufacture of consumer goods, including textile and food products. However, the implications for upstream sectors depend on the structure of intermediate production, and can only be inferred much more approximately. The most useful data on these inter-industry linkages come from China's official input-output tables. Although not very timely (the most recent is for the year 2012), these data provide a means of exploring interrelationships between the expenditure, production and income sides of the Chinese economy, albeit at a fairly high level of aggregation.[30]
Figure 26 illustrates the differences between consumption (public and private combined) and investment in terms of total expenditure on various final goods and services by industry. Taking these components' expenditure profiles (as well as that of the exports component of total final demand), and accounting for the sequence of intermediate production linking downstream to upstream industries, Figure 27 splits the gross value added (the difference between the value of an industry's output and the value of its intermediate inputs) for each of the 17 Chinese industries according to the proportions attributable to household consumption, government consumption, investment and export demand.[31]
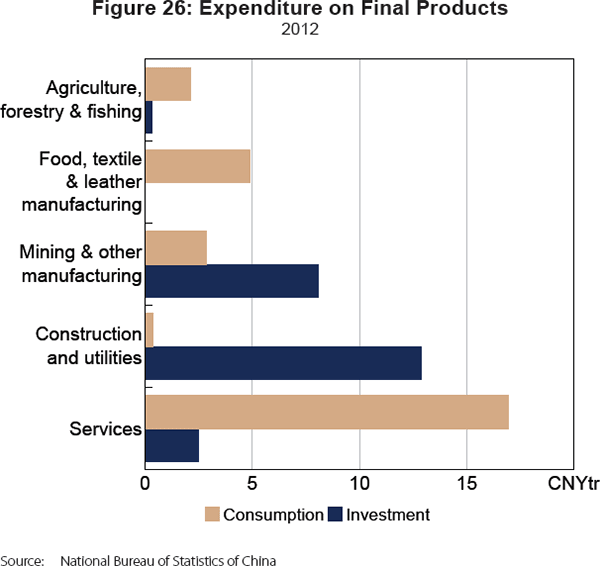
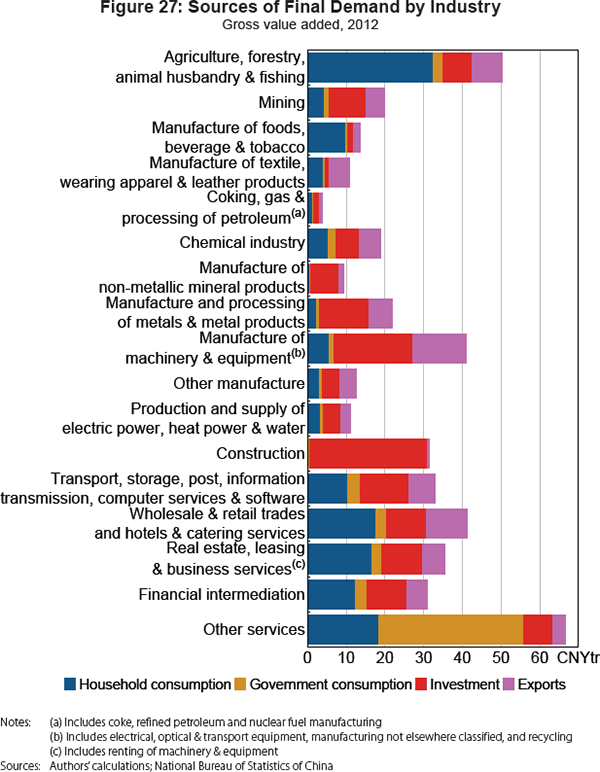
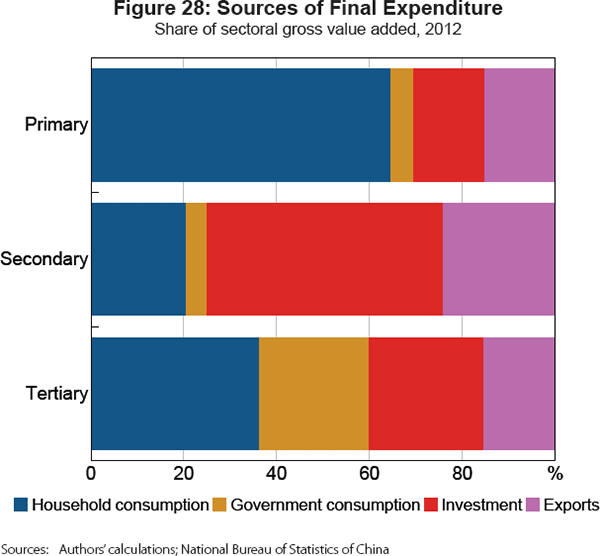
The drivers of demand vary widely for China's various industries. For instance, investment is the primary source of demand for the construction, machinery & equipment, and metals manufacturing industries, while consumption is, unsurprisingly, a more important driver for agricultural and food production and for the majority of services industries. To simplify the picture, we aggregate the 17 industries into primary, secondary and tertiary sectors, dividing the gross value added attributable to the different expenditure components by each sector's total (Figure 28).[32] The primary sector (agriculture, forestry, animal husbandry & fishery) ultimately derives about two-thirds of its demand from household consumption, compared to around one-fifth for the secondary sector and around one-third for the tertiary sector. The secondary sector is heavily reliant on investment expenditure (ultimately accounting for about half of demand) and exports (accounting for about one-quarter of demand). The tertiary sector derives about 60 per cent of its demand from consumption, nearly half of which comes from government consumption.[33]
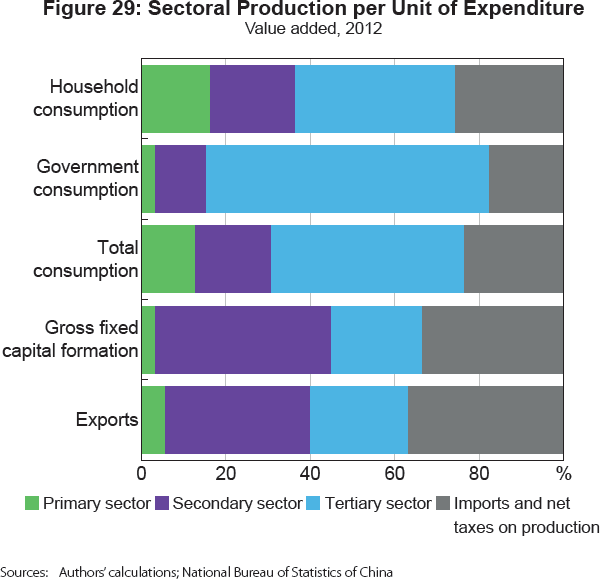
Input-output tables also allow us to illustrate how much production (both final and intermediate) by each domestic Chinese sector is required per unit of expenditure for each component of final demand (Figure 29).[34] Each unit of expenditure on investment equates to more than double the amount of value added for secondary sector industries than does each unit of consumption. Conversely, each unit of expenditure on consumption equates to about four times the amount of value added for the primary sector, and more than twice the amount of value added for the tertiary sector, relative to each unit of expenditure on investment. If the broad structure of production and expenditure relationships remain stable, these demand intensities imply that the rebalancing of the expenditure-side of the economy will drive structural change on the production side away from manufacturing and construction towards services, particularly if the rebalancing involves an increase in government consumption relative to household consumption.[35]
China's input-output tables also separate each industry's gross value added into payments to labour (compensation of employees) and payments to capital (gross operating surplus).[36] Labour compensation accounts for almost all of primary sector value added. Payments to labour and capital are fairly evenly divided both in the secondary and tertiary sector in aggregate; however, this obscures wide variation at the more disaggregated industry level.[37] The variation of factor intensity within industries with differing exposures to the various final demand components means that the shares of income accruing to labour and capital vary according to the source of expenditure. Figure 30 shows how each unit of expenditure from the various demand components corresponds to different amounts of income for domestic labour, domestic capital, and foreign factors of production.[38]
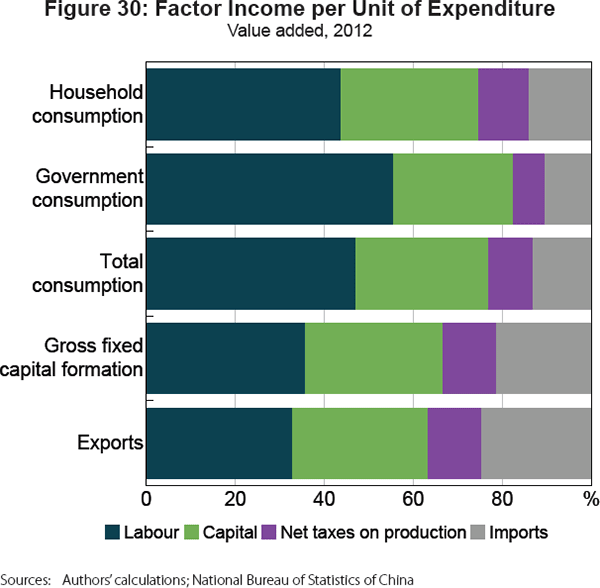
Of the domestic value added required for each unit of expenditure, Table 6 gives the percentages corresponding to the payments to labour and capital according to the source of demand. The comparison explains why investment- and export-driven growth can be expected to correspond to a lower labour share of income than consumption-driven growth. Within consumption, government consumption is ultimately significantly more ‘labour intensive’ than household consumption. An implication is that, other things being equal, rebalancing from investment towards consumption can be expected to support a higher rate of employment growth for a given rate of GDP growth, possibly cushioning the effect of the slowing economy on the Chinese labour market and on household incomes.[39] As a higher share of payments to labour than payments to capital are spent on consumption, this may support faster growth of consumption relative to overall growth, reinforcing the process and possibly contributing to the necessary resilience of consumption growth (as discussed in Section 4.2).
Input-output tables also shed light on how demand components differ in their import intensities, or requirements for foreign value added (Figure 30). Investment is more import intensive than consumption, and household consumption is more import intensive than government consumption. This point calls into the question the assumption maintained in the domestic rebalancing scenarios discussed in Section 4.2, where the net export share of GDP is unchanged while the composition of domestic expenditure changes. The next section relaxes that assumption and explores implications of domestic rebalancing for the external balance.
| Factor | Consumption | Gross fixed capital formation | Exports | ||
|---|---|---|---|---|---|
| Total | Private | Government | |||
| Labour | 61.1 | 58.6 | 67.2 | 53.7 | 51.6 |
| Capital | 38.9 | 41.4 | 32.8 | 46.2 | 48.4 |
|
Sources: Authors' calculations; National Bureau of Statistics of China |
|||||
4.4 How might the external balance respond?
While internal rebalancing appears to be at an early stage, China's external rebalancing has been clearly underway since the global financial crisis (see Section 2). Net exports peaked as a share of GDP in 2007 at 8.7 per cent. The share has since declined to below 3 per cent, as a sharp fall in the export share was accompanied by a milder reduction in the import share, reflecting a combination of a rise in China's investment rate and a fall in its saving rate (Figures 1 and 31). In the Section 4.2 scenarios, we assumed that the external balance would remain fixed as the internal balance changed, which implicitly constrained the rate of consumption growth that could accompany a given rate of GDP growth (or a given ‘efficiency’ of investment). In allowing the external balance to vary we now relax this constraint for two reasons. First, different import intensities may alter the external balance for a given one-to-one rotation between consumption and investment. Second, their rotation may not turn out to be one-to-one in practice.
As discussed in Section 4.3, the different production-side requirements of industries producing for consumption or investment means that internal rebalancing may affect the external balance by changing the composition of demand for imports. Changes to the net export share may be driven either by changes in the export share or the import share (which were 23.7 per cent and 21.0 per cent in 2014). For simplicity, we consider only changes to the import share of GDP, leaving the export share fixed (the future of external demand for Chinese exports being beyond the scope of this paper).[40] Specifically, we consider what the various internal rebalancing scenarios outlined in Section 4.2 might imply for the external balance if the ‘import intensities’ described in Section 4.3 (Table 7) remained unchanged over the period to 2030.
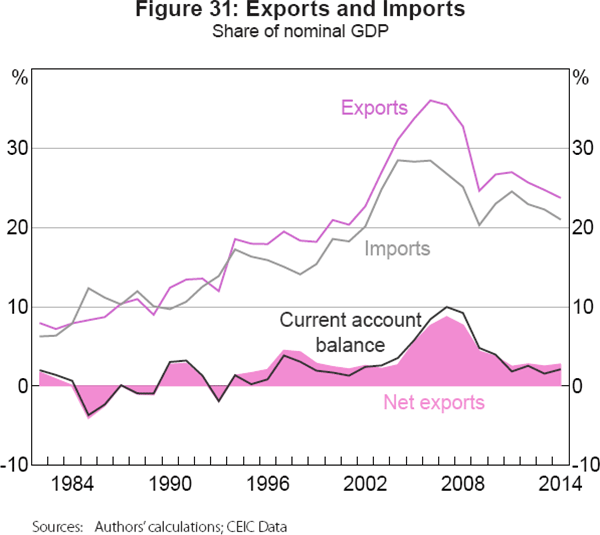
| Consumption | Gross capital formation |
Domestic absorption |
Exports | Total final demand |
||
|---|---|---|---|---|---|---|
| Total | Private | Government | ||||
| 0.13 | 0.14 | 0.10 | 0.21 | 0.17 | 0.25 | 0.19 |
|
Sources: Authors' calculations; National Bureau of Statistics of China |
||||||
Table 8 compares the implications for the Chinese import share of the slow, moderate and fast rebalancing scenarios from Section 4.2, here recast as shifts from investment to consumption in the respective shares of domestic expenditure, rather than as shares of GDP.[41] Due to the higher import intensity of investment relative to consumption, an internal rebalancing towards consumption leads to a modest decline in the import share (and a corresponding increase in the net export share), with overall GDP consequently slightly larger than if the import share had remained unchanged. This suggests that the resolution of internal imbalances can be expected to increase, rather than reduce, external imbalances (and vice versa). Although the scale of this external effect would be small relative to the internal change, it could still be significant enough in absolute terms to have a material impact on China's trading partners, given the large and increasing size of the Chinese economy.
| Rebalancing scenario | Shift from investment to consumption Share of domestic absorption |
Change in import share of GDP by 2030 Percentage points |
Net export share of GDP in 2030 Per cent |
Relative difference in nominal GDP by 2030 Per cent |
|---|---|---|---|---|
| Slow | 5.14 | −0.47 | 3.10 | 0.39 |
| Moderate | 15.42 | −1.39 | 3.85 | 1.17 |
| Fast | 25.70 | −2.31 | 4.58 | 1.94 |
A caveat to this analysis is that, conceivably, changes to import intensities within final demand components could offset the effects of shifts in expenditure shares between components. Such changes would have implications for the potential rate of Chinese consumption growth that could feasibly coincide with a given degree of internal rebalancing. If the fall in China's investment rate is exceeded by the fall in its saving rate, the external surplus would have to decline further (possibly into deficit). In particular, a falling investment share may be compatible with significantly higher rates of consumption growth than suggested by the exercises in Section 4.2 if China were to shift from trade surpluses to deficits, allowing the country to import a larger share of consumption goods and services than currently. This effectively implies a jump in the import intensity of consumption. For example, under the scenario of moderate growth and moderate internal rebalancing, a gradual increase of 5 percentage points in the import share of GDP by 2030 would, if entirely allocated to consumption, raise average annualised consumption growth from 6.8 per cent to 7.2 per cent over that period. Under a scenario of moderate growth and fast internal rebalancing, a similar 5 percentage point reduction in the external balance could shift per capita household consumption levels up to reach those of contemporary South Korea by 2030 (Figure 24).[42]
It is also worth noting that, if the decline in overall growth is positively related to the fall in the investment share, a trade deficit may present one way of ‘cushioning’ the internal rebalancing process. A deficit could allow consumption to rise faster than could otherwise be supported by the more gradual growth in the domestic capital stock (although any such benefit would need to be balanced against the implications of a persistent trade deficit for the capital account and the exchange rate). However, considering the higher import intensity of investment and the fact that investment typically adjusts faster than consumption, it is also quite likely that the current account surplus could widen (as occurred in Japan in the 1980s and in China in 2015). In other words, while the investment share of GDP would decline, the consumption share will not necessarily rise by the corresponding amount.
4.5 Implications for China's trading partners
In the same way that data on inter-industry linkages can be used to analyse the effects of expenditure-side rebalancing on China's domestic industrial sectors, we can also consider how China's various trading partners (and their own industrial sectors) would be affected.[43] To do so, we use the same approach as in Section 4.3, but rely on multi-regional input-output tables that delineate trade and production relationships across industrial sectors in different countries. Specifically, we make use of the June 2015 version of the OECD Inter-Country Input-Output (ICIO) tables, which cover 34 industries and 62 regions for the years 1995, 2000, 2005, and annually from 2008 to 2011.[44] These data allow the components of Chinese expenditure on final goods and services to be connected to the corresponding incomes (i.e. value added) earned in the industries of countries that contribute to their production, directly or indirectly.[45] An advantage of the current OECD ICIO tables over previously published multi-regional input-output tables is the distinction made between the different input requirements of equivalent Chinese industries producing for domestic use, non-processing exports or processing exports.[46]
Using these data, the value-added exports to China of its trading partners can be distinguished from their gross exports. Value-added exports measure trade in a manner consistent with GDP, which avoids double counting by including only expenditure on final goods and not intermediate goods. Value-added exports to China of a given economy: (i) exclude the value of exports to China that are used as inputs into the production of Chinese goods and services that are then exported from China to other countries; (ii) exclude the value of intermediate inputs imported from third countries that are used in the production of exports to China; and (iii) include the value of intermediate inputs produced by the economy in question that are used in the production of exports by third countries to China.[47]
The data indicate that in 2011 gross exports exceeded value-added exports for all trading partners except Saudi Arabia (Figure 32).[48] Economies strongly economically integrated with China through east Asian manufacturing supply chains – in particular South Korea, Taiwan, Malaysia and Thailand – have a high ratio of gross exports to value-added exports, reflecting the fact that a large share of these economies' exports to China are intermediate inputs used in Chinese export manufacturing. For Australia, value-added exports to China were about 80 per cent of the value of gross exports, implying that roughly four-fifths of value added in Australian exports are attributable to Chinese final demand, while about one-fifth is attributable to demand for Chinese exports (using Australian inputs) from other countries.
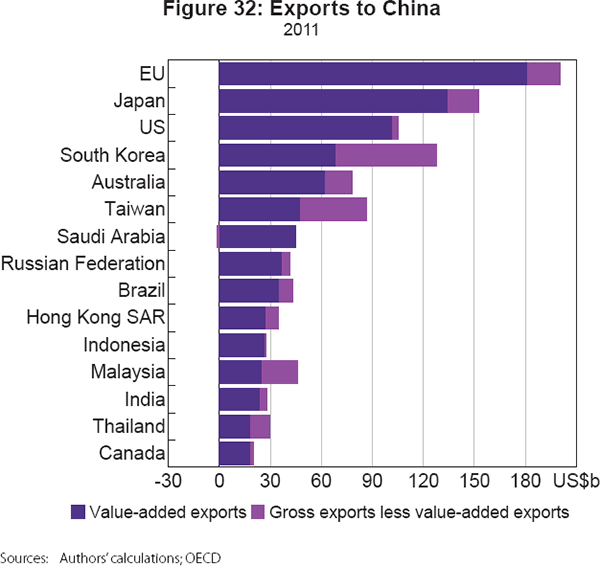
If we consider the time dimension, the data indicate that trading partner exposure to the Chinese economy has risen markedly since 1995 (Figure 33). In all cases, the share of exporting economies' gross value added that is attributable to Chinese domestic final demand has increased over time. The most highly exposed economies are China's east Asian neighbours, along with resource exporters such as Saudi Arabia, Chile, Australia and South Africa.[49] In 2011, Chinese domestic final demand (that is, final demand excluding net exports) accounted for about 4.3 per cent of Australian value added, a much higher level of exposure to the Chinese economy than that faced by other developed economies (Table 9).
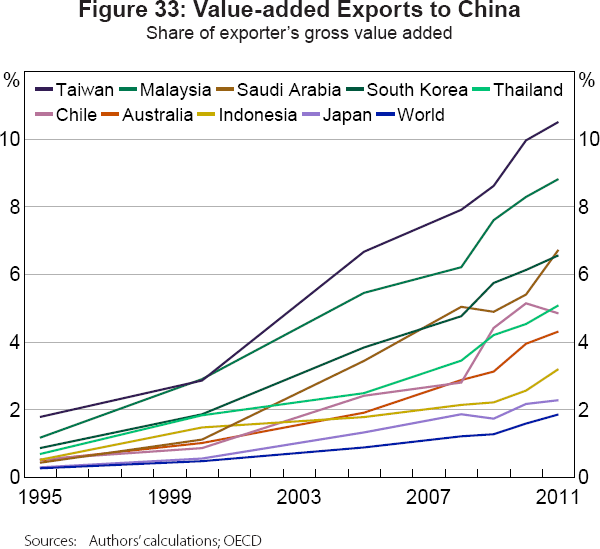
| Exporter | |||||||
|---|---|---|---|---|---|---|---|
| Australia | Japan | Brazil | EU | Canada | United States | World | |
| Gross export share | 5.4 | 2.6 | 2.0 | 1.2 | 1.2 | 0.8 | 2.3 |
| Value-added export share | 4.3 | 2.3 | 1.7 | 1.1 | 1.1 | 0.7 | 1.9 |
|
Sources: Authors' calculations; OECD |
|||||||
Just as China's internal rebalancing is likely to affect China's domestic industries to different extents on the production side, it may also have differential effects on China's trading partners depending on how exposed they are to Chinese consumption and investment demand. To illustrate this, Figure 34 compares how a rotation of 15 percentage points in Chinese domestic expenditure from gross fixed capital formation to total consumption (without changing the relative shares of household and public consumption) would have affected the value-added exports of China's trading partners in 2011. As Chinese investment is generally more import intensive than consumption, the impact on most trading partners is negative, although there are a few exceptions (notably New Zealand). Australia is more negatively affected than the world on average, but less negatively affected than two other resource exporters (Chile and Saudi Arabia) and several exporters of manufactured capital goods (Japan, South Korea and Germany).[50]
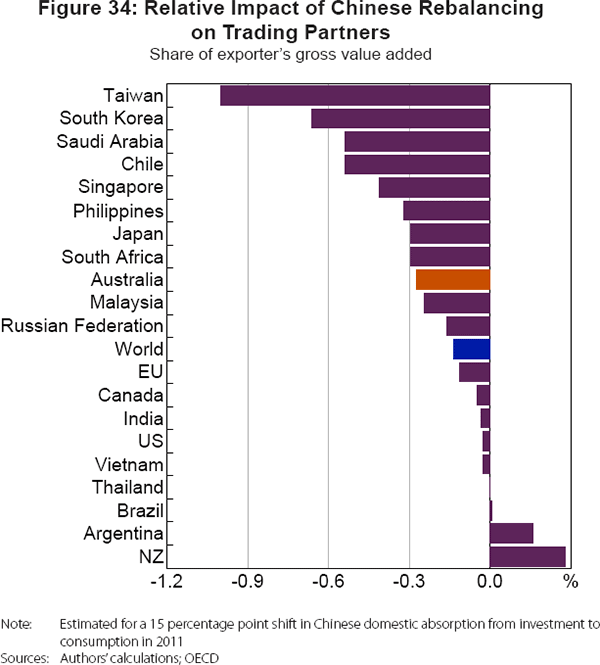
For Australia, the negative effect of Chinese rebalancing is principally due to the role of Chinese investment in driving demand for mining exports (Figure 35).[51] These exports, particularly iron ore and coking coal, provide key inputs for the Chinese metals manufacturing industry, which in turn derives much of its demand from the strongly investment-driven construction and machinery & equipment manufacturing industries. As such, the negative impact of rebalancing on Australia will largely be borne by the country's mining sector.[52] In contrast, Australia's agriculture, forestry & fishing, food & beverage manufacturing, and education and tourism services industries would benefit from rebalancing, although the size of the offset would be relatively small.[53]
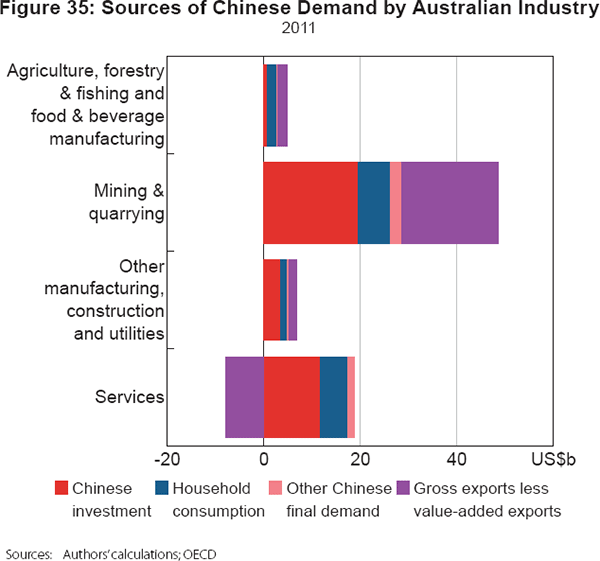
The differences between patterns of trade exhibited by economies more and less likely to benefit from Chinese rebalancing are pronounced. For instance, New Zealand's exports to China are dominated by agricultural products, food items such as dairy products and services, while a relatively small share are inputs to Chinese investment (see Figure A1). But such a pattern of trade with China is atypical. For most economies, the bulk of value-added exports to China meets investment rather than consumption demand (see Figure A2). In this respect, the Australian example is not unusual.
The difference between the relative demand intensities of Chinese consumption and investment for Australian imports will no doubt continue to evolve in the future (Figure 36). However, the demand for Australian value added per unit of Chinese consumption would need to rise sharply in order to offset the effect of a diminishing investment share. Moreover, as Chinese rebalancing is more likely to be driven by decelerating investment than accelerating consumption, a substantial reorientation of Australia's trade with China will be needed for it to benefit from the rebalancing process.
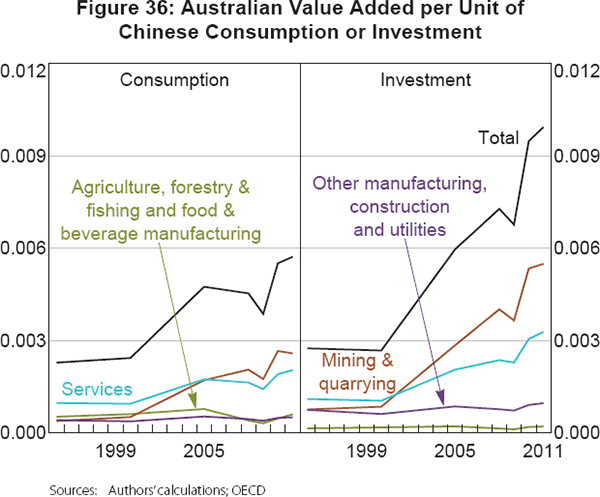
5. Conclusion
This paper makes a number of observations about rebalancing in China – that is, a shift from a pattern of growth driven by investment to one driven by consumption – and its international consequences. First, we offer a reappraisal of the causes of China's unbalanced pattern of growth in recent decades with reference to an updated analysis of the flow-of-funds accounts. We find that conventional analysis understates the role of the household sector in contributing to the high investment share of the economy. Our explanation for the imbalances emphasises the role played by housing market deregulation as one of multiple prolonged positive productivity and demand shocks to the Chinese economy that simultaneously sustained returns to capital, lifted investment and boosted both private and public saving. While recent discussions stress the need to reform financial markets to foster rebalancing, we argue that rebalancing will probably happen anyway as a natural outcome of dwindling income windfalls from fading positive productivity shocks, the unwinding of demographic shifts and maturing housing markets, all of which helped drive the imbalances in the first place.
Second, we present estimates suggesting that the return to capital in China has been falling while the domestic cost of funding has been rising. These trends suggest that China's pattern of rebalancing will most likely be one characterised by falling investment growth in the years ahead.
A third leg to the argument is that Chinese consumption growth in recent years has been extraordinary by the standards of Chinese history and in comparison to other countries. Our rebalancing and growth scenarios indicate that meaningful rebalancing would require continued rapid consumption growth (more than 8 per cent per year) and prolonged weakness in investment. For such an outcome to be achieved, the effect of much lower investment growth on household incomes and consumption would have to be very small. But historical and international comparisons suggest that it has been rare for economies experiencing rapid consumption growth prior to a rebalancing episode to sustain or to increase consumption growth in subsequent years. Such comparisons highlight the critical but uncertain role played by the resilience of consumption expenditure in China's rebalancing process.
In addition to illustrating how unprecedented and unusual a fast rebalancing in China would be, our scenarios underscore and clarify the ‘knife-edged’ nature of rebalancing and the considerable stakes involved. If rebalancing is too slow, the capital-to-output ratio rises to potentially unsustainable levels, and real household consumption per capita struggles to rise above that of a contemporary upper middle-income economy, even by 2030. If it is too fast, the implied disparity between the growth of consumption and investment, and the required increase in the efficiency of investment, suggest a pattern of growth that may be implausible in practice.
Fourth, our input-output analysis demonstrates that, for China, there is a close relationship between rebalancing on the expenditure side from investment towards consumption and a parallel rebalancing on the production side from manufacturing industry towards services. As services are more intensive in labour input than manufacturing, rebalancing from investment towards consumption could support a higher rate of employment growth for a given rate of GDP growth, possibly cushioning the effect of the slowing economy on the Chinese labour market and on household incomes. This in turn may lend some support for a rotation from investment to consumption.
However, the close relationship between the structure of Chinese expenditure and production has another more global implication. The higher import intensity of Chinese investment relative to consumption means that internal rebalancing would be expected to place downward pressure on the import share of GDP. Accordingly, while a simultaneous resolution of domestic and external rebalances is possible, our investigation of global input-output tables from 2011 shows that the more likely outcome is that internal rebalancing supports a modest worsening of external imbalances.
Finally, we consider the consequences of Chinese internal rebalancing for key trading partners. Our results must be treated with caution, due to the comparative static nature of the analysis, which assumes that the structure of global trade and relative prices remain unchanged. With this caveat in mind, similar to Ahuja and Nabar (2013) we find evidence that domestic rebalancing in China is likely to be negative for countries that export resource commodities, including Australia. The negative effect of Chinese rebalancing in our analysis reflects the role of Chinese investment in driving demand for mining exports. While it is a commonplace assumption that commodity exporters will be more disadvantaged than other countries by rebalancing in China, in fact we find that most countries ‘lose’ from rebalancing, and that Australia is neither alone nor even unusual in this respect. With few exceptions (such as New Zealand), China's trading partners generally export manufactured goods that are used more intensively in investment than in consumption. If such a pattern of trade persists, our analysis suggests that few of China's current trading partners will benefit in net terms from Chinese rebalancing and many will experience a slowing in exports to China in coming years.
It is worth noting that continued growth in household incomes and consumption over time could see increased Chinese demand for imported services and rural, food & beverage manufacturing goods. There is therefore scope for related export industries in countries such as Australia to benefit from rebalancing. Our calculations suggest that the size of these industries and the degree of penetration into the Chinese market would have to increase sharply to offset the effect of a rebalancing China on Australian exports. Nonetheless, if domestic industries can adapt themselves to the changing composition of Chinese import demand, there will be opportunities for a range of Australian exporters to compete with other economies to supply these needs in the future.
Appendix A: Sources of Chinese Demand by Industry
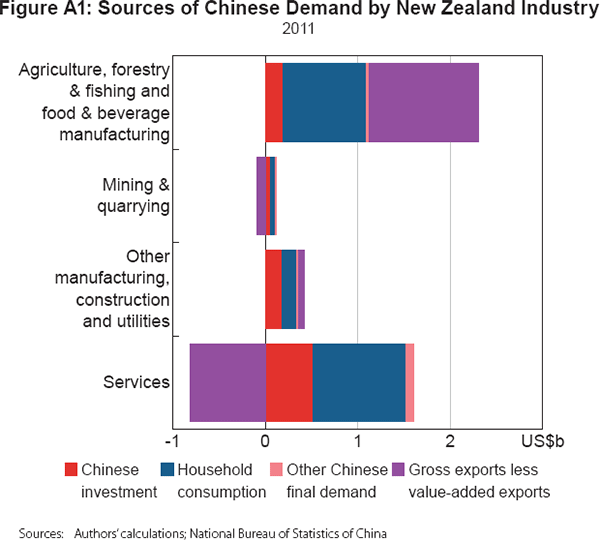
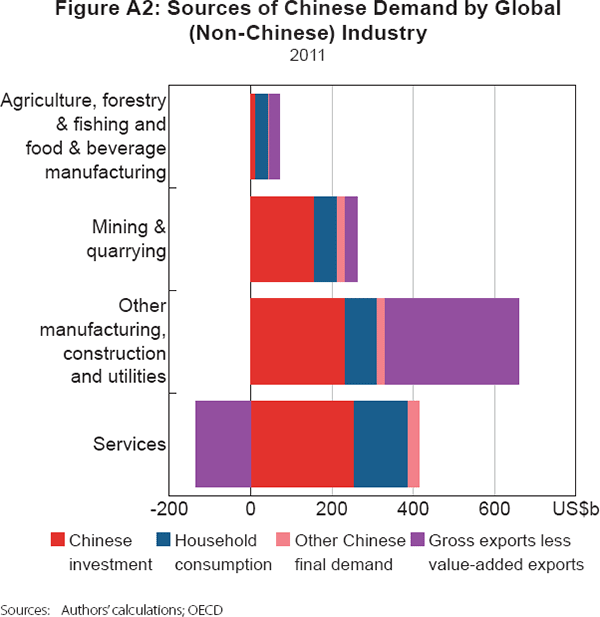
Footnotes
The majority of this collaboration was completed while Guonan Ma, a non-resident scholar of Bruegel, was visiting the Reserve Bank of Australia in 2015. [*]
Here C refers to both household and government consumption. The difference between savings and investment is equivalent to the current account balance, which in addition to the trade balance (net exports), includes the balance on primary income (earnings on investments) and the balance on secondary income (transfer payments). Net primary and secondary incomes represent a relatively small component of China's current account balance, which has closely approximated the trade balance as a share of GDP in recent decades. [1]
After 2009, the flow-of-fund accounts data started capturing net transactions of land use rights and intellectual copyright across the household, corporate and government sectors under ‘acquisition less disposal of other non-financial assets’. Since proceeds from land sales and purchases are not counted as gross capital formation, they do not contribute to value added. Thus, these transactions sum to zero but do alter the income and saving flows among the three sectors. We adjust for such transactions in this paper. In addition, the current flow-of-funds data have not been updated to match the 2015 revision of the expenditure-based GDP data, so minor discrepancies exist between the two sets of data. The release of 2013 flow-of-funds data included revisions to the previous year's data for household and government sector income (based on the third national economic census), but as revisions to all other flow-of-funds series are not expected to become publicly available until late 2016, we continue to use the pre-revised household and government income data for 1992–2012 to maintain consistency. [2]
This represents the continuation (and acceleration) of a trend first noticed by Kuijs (2005). [3]
Household consumption as a share of GDP can be decomposed as: CH/Y = (1 − SH/YH) · YH/Y, where C H, SH and YH refer to household consumption, saving and disposable income. Using this equation, we can estimate the contributions of household disposable income and the average propensity to save SH/Y H to the observed household consumption share of GDP. If we consider the 2000–13 period, the contributions are 24 per cent and 76 per cent, respectively. [4]
The decline in net interest income from 4.4 per cent of GDP in 1992 to 1.8 per cent in 2013 is the combined outcome of a decline of gross interest income from 4.4 per cent to 3.1 per cent and a rise of gross interest payment from zero to 1.2 per cent. The increased gross interest payment mostly relates to expanding mortgage loans, credit card use and personal loans. [5]
The data come from the Penn World Tables 8.1, which gives ‘real’ expenditure component shares of GDP after adjustments using separate purchasing power parity factors for each component (based at 2005 US GDP). We reverse these adjustments so that the shares are in nominal terms. [6]
We use the estimates of nominal residential gross fixed capital formation due to Koen et al (2013), projected forward using data on real estate fixed asset investment. [7]
This comment was made at a press conference by former Premier Wen Jiabao in 2007 (Xinhua News Agency 2007). [8]
The 10 economies experiencing rebalancing episodes according to this criterion are Angola, Brunei Darussalam, Congo, Gabon, Iraq (which experienced two episodes), Oman, Qatar, Saudi Arabia, Uruguay and Venezuela. We exclude microstates (for example, Saint Kitts and Nevis). [9]
Japan and South Korea are characterised by a gradual rebalancing of investment and household consumption shares. Moreover, in both cases the initial magnitude of the domestic imbalance (measured by the difference between investment and household consumption shares of GDP) did not approach those observed currently in China. [10]
On this criterion, about 30 economies qualify as having rebalanced over the sample period, but of these only about half experienced any increase in household consumption growth at all during the rebalancing process, and only one had an initial high five-year annualised average growth rate exceeding 5 per cent per annum (Botswana). [11]
Not all such crises resulted in rebalancing under our definition. For example, the Chilean debt crisis (1982) resulted in a very moderate rebalancing from investment towards private consumption, while Argentina, Brazil and Mexico (also early 1980s) experienced fairly modest changes in their already relatively high consumption shares of GDP. [12]
This formulation of the return to capital assumes perfect competition. As Bai et al (2006) observe, ignoring the presence of imperfect competition induces an upward bias to estimates of the marginal return to capital. As such, the absolute level of the estimated return to capital needs to be treated with caution. An adjustment could be made to account for this bias by assuming a mark-up over marginal cost. Our comparison of changes over time will still be informative providing that the bias due to imperfect competition has not changed substantially over time in China. [13]
To allow alternative estimates of the components of the return to capital to be directly comparable, we use an estimate of GDP net of inventories as the aggregate national output measure when constructing estimates based on GFCF, rather than GCF, data. [14]
FAI is a broader (and higher-frequency) measure of Chinese investment than the annual national accounts measure of gross (fixed) capital formation. FAI is defined as the value of fixed assets that are built or purchased, plus the related costs of installation and ownership transfer. The most significant difference is that FAI includes land purchases, existing buildings and structures and purchases of second-hand equipment. Another distinction is that FAI only includes investments larger than CNY5 million (prior to 2011 this lower bound was CNY500,000). [15]
Specifically, we assume that the initial capital stock is equal to the 1978 level of investment divided by the sum of the assumed steady-state growth rate of investment (which we take to be the 1978–82 average growth rate) plus the depreciation rate. Our estimates are robust to initialising the capital stock at an earlier date, for example 1952. [16]
In the original formulation of Bai et al (2006), constant depreciation rates of 8 per cent and 24 per cent are used for structures and equipment investment, respectively; the changing shares of the different types of investment give rise to a time-varying aggregate depreciation rate. Wu (2015) uses a depreciation rate of 6 per cent. Holz (2006) estimates economy-wide depreciation rates in the range of 3–6 per cent since 1978. Typical estimates used in the literature range from 5 per cent to 7 per cent (Holz 2006). [17]
Others have used long-run consistent provincial income time series in preference to splicing with the flow-of-funds estimates (Bai et al 2006; Bai and Qian 2010). But Lü (2015) argues persuasively that, in view of the variable quality and inconsistent implementation of statistical standards in the provincial level income accounts, recent vintages of the flow-of-funds data are a preferable data source. [18]
The wedge has remained positive: the reason for this is that the nominal capital-to-output ratio has actually been lower for GFCF than for GCF, due to faster growth in the GCF deflator. [19]
Even if we assume that prices of investment goods and aggregate output were the same over this period, a similar downward trend in the return to capital after 2008 is apparent. [20]
Trends in the labour share should be placed in some perspective. Assuming a constant labour share (for example, the average over the period since 1978) suggests a more moderate pace of decline in the return to capital in recent years, but the broad picture is similar. [21]
Due to data limitations that restrict the time series, prior to 2010 we splice this estimate with the regulated nominal benchmark lending rate for loans of 1–5 years' duration. The choice of a regulated lending rate for earlier years may be justified on the grounds that the abolition of restrictions on lending rates was not achieved until 2012. Moreover, trust product and bond issuance accounted for an extremely small share of corporate finance prior to 2010. [22]
We assume that the proportions of household and government consumption in total consumption are kept constant throughout the whole period. Similarly, the share of changes in inventory in GCF remains constant. Relaxing these assumptions does not materially alter our discussion, although our assumption of a fixed government share of total consumption would imply a significant pick-up in real government consumption growth from that of recent years. [23]
For our purposes, only the relative growth rates of the overall and component deflators in these scenarios are relevant, not their absolute growth rates. The assumption that all relative prices remain unchanged over the scenario period is fairly strong given their volatility in recent years, however, there does not appear to be any consistent ‘bias’ in relative price growth; average deflator growth over the past 15 years has been similar across components. In any case, relaxing this assumption would not materially change the discussion. [24]
Since the net export share of GDP is assumed to remain unchanged, net exports grow at the same rate as overall GDP in all scenarios. [25]
For simplicity, we maintain the assumption of a 7 per cent depreciation rate throughout. [26]
Given the assumptions regarding the stability of relative prices and the net export share of GDP, a particular combination of a real growth rate and a nominal rebalancing path will be consistent with a particular combination of investment and consumption growth rates and a particular path of the capital-to-output ratio. [27]
Although China already falls within the World Bank's ‘upper middle-income’ category by gross national income per capita, the low household consumption share of expenditure leaves Chinese per capita household consumption well below that of other upper middle-income countries (such as Malaysia and Thailand). The average per capita household consumption figure obviously obscures large variation in consumption levels across Chinese regions, particularly between urban and rural areas. [28]
The capital-to-output ratio K/Y is a measure of the ‘efficiency’ of past and present investment, in that its inverse Y/K represents the speed at which the capital stock produces its own value in output. The incremental capital-to-output ratio ΔK/ΔY=I/ΔY=(I/Y)/(ΔY/Y) is a measure of the ‘efficiency’ of additions to the capital stock (i.e. investment), with an inverse equivalent to the ratio of GDP growth to the investment share of GDP. [29]
The published 2012 tables are at the 17-industry level. 2010 tables are available at a more disaggregated level, however, the additional detail would make little difference to the discussion. [30]
For S industries, input-output tables represent flows of intermediate inputs between industries in an S × S matrix, which can be used to calculate a matrix of ‘technical requirements’ representing how many units of input from one industry is required to produce one unit of output in another industry. Calculating the ‘Leontief inverse’ (the infinite geometric series of this matrix) allows any element of final demand to be related to the total gross output necessary to produce that element as well as its required intermediate inputs – and these inputs’ required intermediate inputs – through every stage of production. Mathematically, define Z as an n × 1 vector of all sectors' gross output, then Z = X + Y where vector X gives intermediate uses and vector Y gives final uses. X = AZ, where A is an n × n matrix of technical requirement coefficients between 0 and 1. Then Z = AZ + Y, or Z = (I – A)–1 Y, where (I – A)–1 is the ‘Leontief inverse’, which can be multiplied by any vector representing elements of final demand to arrive at the necessary gross output. This gross output can be multiplied by the industries' ratios of value added to gross output to relate expenditure to income. [31]
China categorises the mining industry in the secondary sector rather than the primary sector. [32]
Government consumption is the primary source of demand for the ‘other services’ industry category which includes health, education, public administration and defence (and is the largest of the 17 Chinese industries by gross value added). [33]
Here we exclude changes in inventories from the investment component. [34]
The rise in income levels is likely to reinforce this effect due to Engel's Law – namely, the observation that the proportion of income spent on basic necessities falls with a rising income, while the proportion of income spent on education, health care and recreation increases. [35]
We discuss returns to capital gross of depreciation, although the NBS tables account for depreciation and operating surplus separately. [36]
The tertiary sector is substantially more labour intensive when the real estate, leasing & business services and financial intermediation industries are excluded. Likewise, the secondary sector is substantially more capital intensive when the construction industry is excluded. [37]
The latter refers to the proportion of the expenditure that ultimately leaves China due both to imports of final goods and services and imports of intermediate inputs used in the production of domestically produced final goods and services. [38]
A higher labour share of income does not automatically correspond to more demand for labour, but this would be a reasonable inference assuming that average compensation per employee is relatively balanced across sectors. [39]
It is worth acknowledging that the assumption of a fixed export share of GDP implies that the nominal value of Chinese exports will increase at the same rate as China's nominal GDP and that, with China's GDP growth in coming years likely to outpace that of the rest of the world, this would involve Chinese exports rising relative to world GDP. [40]
The rebalancing scenarios in Section 4.2 involved rotating fixed percentage points of nominal GDP from the investment share to the consumption share. If we allow shifts from investment to consumption to affect demand for imports (which is a negative component of GDP), we affect the denominator in the GDP component shares, but not in the domestic expenditure shares. [41]
We continue to assume a fixed export share of GDP. We assume that changes in the import share follow a geometric path from its 2014 level as with the other components. Under such a scenario, in 2030, China would be running a trade deficit of 2.3 per cent of GDP. [42]
Here we are considering the effects of rebalancing on the countries that export goods and services to China. As in the previous section we do not consider changes in Chinese exports to other countries, which we assume to be unaffected by the internal rebalancing process. [43]
Kelly (2014) undertakes a similar analysis using the World Input-Output Database (WIOD), which covers 35 industries in 41 regions for every year from 1995 to 2011. Although the OECD ICIO database does not publish tables for every year between 1995 and 2008, it has a wider coverage (62 countries, including many east Asian economies not included in the WIOD). The two data sources yield results that are broadly similar but differ in some details. [44]
Unlike the NBS input-output tables for the Chinese economy, the OECD ICIO tables do not distinguish between compensation of employees and gross operating surplus in their measurements of gross value added. The value of taxes less subsidies on production is also included. Factor incomes do not account for capital account flows. [45]
Processing trade is likely to use more imported content than non-processing trade due to tariff exemptions. More imported content is used in Chinese production for exports than in Chinese production for domestic use, so the ratio of value-added exports to gross exports is likely to be lower using the OECD ICIO tables than the WIOD. [46]
For more details, see Kelly and La Cava (2014). [47]
This reflects the unusually large share of Chinese demand that reaches Saudi Arabia indirectly, due to the importance of Saudi Arabian oil as an input in the production of other countries' exports to China. [48]
We exclude Hong Kong SAR, which derived 11.2 per cent of gross value added from (mainland) China in 2011, and the small resource exporter Brunei Darussalam, which derived 6.2 per cent of gross value added from China in 2011. [49]
The major driver for the European Union's negative result is Germany, a capital goods exporter with a larger relative exposure to Chinese investment than Japan. [50]
In Figure 35, the value-added exports of the services sector exceed the sector's gross exports. This is due to the fact that service sector value added is incorporated in the gross exports of other goods that are produced using services as an intermediate input. For more details, see Kelly and La Cava (2014). [51]
The negative impact on Australia's mining & quarrying sector accounted for about 70 per cent of the total impact for Australia of Chinese rebalancing as estimated using the 2011 OECD ICIO tables. This does not include the impact on industries (such as those in the services sector) that provide inputs into the mining sector. [52]
The impact of Chinese rebalancing on Australian industries that would be positively affected is about 10 per cent of that on Australian industries that would be negatively affected, as estimated using the 2011 OECD ICIO tables. [53]
References
Ahuja A and M Nabar (2013), ‘Investment-Led Growth in China: Global Spillovers’, in A Singh, M Nabar and P N'Diaye (eds), China's Economy in Transition: From External to Internal Rebalancing, International Monetary Fund, Washington DC, pp 115–136.
Aziz J and L Cui (2007), ‘Explaining China's Low Consumption: The Neglected Role of Household Income’, IMF Working Paper No WP/07/181.
Bai C-E, C-T Hsieh and Y Qian (2006), ‘The Return to Capital in China’, Brookings Papers on Economic Activity, 2, pp 61–101.
Bai C-E and Z Qian (2010), ‘The Factor Income Distribution in China: 1978–2007’, China Economic Review, 21(4), pp 650–670.
Berkelmans L, G Kelly and D Sadeghian (2016), ‘Chinese Monetary Policy and the Banking System’, Journal of Asian Economics, 46, pp 38–55.
Berkelmans L and H Wang (2012), ‘Chinese Urban Residential Construction to 2040’, RBA Research Discussion Paper No 2012-04.
Berlemann M and J-E Wesselhöft (2014), ‘Estimating Aggregate Capital Stocks Using the Perpetual Inventory Method: A Survey of Previous Implementations and New Empirical Evidence for 103 Countries’, Review of Economics, 65(1), pp 1–34.
Bernanke BS (2007), ‘Global Imbalances: Recent Developments and Prospects’, Bundesbank Lecture, Berlin, 11 September.
Blanchard O and F Giavazzi (2006), ‘Rebalancing Growth in China: A Three-Handed Approach’, China & World Economy, 14(4), pp 1–20.
Cai F (2011), Beyond Demographic Dividends, Series on Chinese Economics Research, Vol 5, World Scientific Publishing, Singapore.
Cai F and I Roberts (2015), ‘Potential Growth and Rebalancing’, RBA Bulletin, June, pp 29–37.
Chamon MD and ES Prasad (2010), ‘Why are Saving Rates of Urban Households in China Rising?’, American Economic Journal: Macroeconomics, 2(1), pp 93–130.
Chivakul M, WR Lam, X Liu, W Maliszewski and A Schipke (2015), ‘Understanding Residential Real Estate in China’, IMF Working Paper No WP/15/84.
de la Fuente A and R Donénech (2000), ‘Human Capital in Growth Regressions: How Much Difference Does Data Quality Make?’, OECD Economics Department Working Papers No 262.
Fang H, Q Gu, W Xiong and L-A Zhou (2016), ‘Demystifying the Chinese Housing Boom’, in M Eichenbaum and J Parker (eds), NBER Macroeconomics Annual 2015, Vol 30, University of Chicago Press, Chicago, pp 105–166.
Feenstra RC, R Inklaar and MP Timmer (2015), ‘The Next Generation of the Penn World Table’, The American Economic Review, 105(10), pp 3150–3182. Available for download at <www.ggde.net/pwt>.
Fukumoto T and I Muto (2011), ‘Rebalancing China's Economic Growth: Some Insights from Japan's Experience’, Bank of Japan Working Paper No 11-E-5.
Garnaut R (2010), ‘The Turning Period in China's Economic Development: A Conceptual Framework and New Empirical Evidence’, in R Garnaut, J Golley and L Song (eds), China: The Next Twenty Years of Reform and Development, China Update, ANU E Press and Social Sciences Academic Press (China), Canberra, pp 19–37.
Goldstein M and NR Lardy (eds) (2008), Debating China's Exchange Rate Policy, Peterson Institute for International Economics, Washington DC.
Holz CA (2006), ‘New Capital Estimates for China’, China Economic Review, 17(2), pp 142–185.
Huang Y and K Tao (2011), ‘Causes of and Remedies for the People's Republic of China's External Imbalances: The Role of Factor Market Distortions’, Asian Development Bank Institute Working Paper No 279.
IMF (International Monetary Fund) (2010), ‘People's Republic of China: 2010 Article IV Consultation—Staff Report; Staff Statement; Public Information Notice on the Executive Board Discussion’, IMF Country Report No 10/238.
IMF (2015), ‘People's Republic of China: 2015 Article IV Consultation—Press Release; Staff Report; and Statement by the Executive Director for The People's Republic Of China’, IMF Country Report No 15/234.
Jorgenson D (1967), ‘The Theory of Investment Behavior’, in R Ferber (ed), Determinants of Investment Behavior, Universities–National Bureau Conference Series, National Bureau of Economic Research, New York, pp 129–155.
Karabarbounis L and B Neiman (2014), ‘The Global Decline of the Labor Share’, The Quarterly Journal of Economics, 129(1), pp 61–103.
Kelly G (2014), ‘Chinese Rebalancing and Australian Exports’, RBA Bulletin, December, pp 23–29.
Kelly G and G La Cava (2014), ‘International Trade Costs, Global Supply Chains and Value-Added Trade in Australia’, RBA Research Discussion Paper No 2014-07.
Koen V, R Herd, X Wang and T Chalaux (2013), ‘Policies for Inclusive Urbanisation in China’, OECD Economics Department Working Papers No 1090.
Kuijs L (2005), ‘Investment and Saving in China’, World Bank Policy Research Working Paper No 3633.
Lardy NR (2008), ‘Financial Repression in China’, Peterson Institute for International Economics Policy Brief No PB08-8.
Lardy NR (2014), Markets over Mao: The Rise of Private Business in China, Peterson Institute for International Economics, Washington DC.
Lü GM (2015), ‘我国劳动报酬占比测算中的几个数据质量问题’ (Several Data Quality Problems in the Measurement of the Labour Share of Income in China's GDP), ‘<<商业经济与管理>>’ (Journal of Business Economics), 5(283), pp 88–96.
Ma G, R McCauley and L Lam (2013), ‘The Roles of Saving, Investment and the Renminbi in Rebalancing the Chinese Economy’, Review of International Economics, 21(1), pp 72–84.
Ma G and W Yi (2010), ‘China's High Saving Rate: Myth and Reality’, International Economics, 122, pp 5–39.
Modigliani F and SL Cao (2004), ‘The Chinese Saving Puzzle and the Life-Cycle Hypothesis’, Journal of Economic Literature, 42(1), pp 145–170.
Mohommad A, O Unteroberdoerster and J Vichyanond (2012), ‘Implications of Asia's Regional Supply Chain for Rebalancing Growth’, Journal of Asian Business, 25(1), pp 5–26.
Nabar M (2011), ‘Targets, Interest Rates, and Household Saving in Urban China’, IMF Working Paper No WP/11/223.
NBS (National Bureau of Statistics of China) (2007), Data of Gross Domestic Product of China: 1952–2004, China Statistics Press, Beijing.
NBS (2015), ‘对2013年支出法国内生产总值数据及历史数据修订的说明’ (Expenditure Side GDP Data for 2013 and Historical Revisions), 3 June, viewed February 2016. Available at <http://www.stats.gov.cn/tjsj/zxfb/201506/t20150603_1114905.html>.
Obstfeld M and K Rogoff (2009), ‘Global Imbalances and the Financial Crisis: Products of Common Causes’, Centre for Economic Policy Research Discussion Paper Series No 7606.
Perkins DH (2015), ‘Understanding the Slowing Growth Rate of the People's Republic of China’, Asian Development Review, 32(1), pp 1–30.
Pettis M (2013), Avoiding the Fall: China's Economic Restructuring, Carnegie Endowment for International Peace, Washington DC.
Roberts I and A Zurawski (2016), ‘Changing Patterns of Corporate Leverage in China: Evidence from Listed Companies’, in L Song, R Garnaut, F Cai and L Johnston (eds), China's New Sources of Economic Growth: Reform, Resources, and Climate Change, Vol 1, China Update, ANU Press, Canberra, pp 271–312.
Singh A, M Nabar and P N’Diaye (2013), China's Economy in Transition: From External to Internal Rebalancing, International Monetary Fund, Washington DC.
Wei S-J and X Zhang (2011), ‘The Competitive Saving Motive: Evidence from Rising Sex Ratios and Savings Rates in China’, Journal of Political Economy, 119(3), pp 511–564.
World Bank and DRC (World Bank and Development Research Center of the State Council, the People's Republic of China) (2013), China 2030: Building a Modern, Harmonious, and Creative Society, World Bank, Washington DC.
World Bank and DRC (2014), Urban China: Towards Efficient, Inclusive and Sustainable Urbanization, World Bank, Washington DC.
Wu HX (2015), ‘Assessing “Returns on Capital” in the Chinese Economy’, The Conference Board China Center Special Briefing Paper No China-SBP-5-15-15.
Wu J, J Gyourko and Y Deng (2015), ‘Evaluating the Risk of Chinese Housing Markets: What We Know and What We Need to Know’, NBER Working Paper No 21346.
Xinhua News Agency (2007), ‘Premier: China Confident in Maintaining Economic Growth’, 16 March, viewed February 2016. Available at: <http://news.xinhuanet.com/english/2007-03/16/content_5856569.htm>.
Xu X, H Jia and J Li (2015), ‘房地产经济对中国国民经济增长的作用研究’ (On the Role Played by Real Estate in the Growth of China's National Economy), ‘<<中国社会科学>>’ (Social Sciences in China), 2015(1), pp 84–101.
Yu Y (2007), ‘Global Imbalances and China’, The Australian Economic Review, 40(1), pp 3–23.
Zhang W, G Han, B Ng and S Chan (2015), ‘Corporate Leverage in China: Why Has It Increased Fast in Recent Years and Where Do the Risks Lie?’, Hong Kong Institute for Monetary Research Working Paper No 10/15.

