RBA Annual Conference – 2016 Discussion
- Download 150KB
1. Leon Berkelmans
The purpose of this paper is straightforward. Jane Golley, Rod Tyers and Yixiao Zhou use a model of the world economy to assess the effects of changes to fertility and savings behaviour in China.
The model itself is a rich worldwide model, incorporating demographics, where the major endogenous influence on growth is capital accumulation.
The main message of the paper is that the Chinese authorities face some conundrums. First, while a fall in saving rates will help rebalance the economy, it will lead to less capital accumulation and a decline in GDP growth. Second, while increasing fertility results in faster economic growth and lower aged dependency, it leads to lower per capita incomes through familiar Solow-Swan-type dynamics.
While there are many interesting modelling issues to be teased out, for example how assumptions about international capital flows affect the results, I will focus my comments on some higher-level issues. I have three main comments: consumption per capita is a better measure of welfare than GDP; the aggregate effects of this are small; and the distributional effects might not be small.
Comment 1: Consumption per capita is a better measure of welfare than GDP
We write utility as a function of consumption rather than other components of GDP. If we focus on consumption per capita as an object of policy, then some of the conundrums the authors focus on fade somewhat.
Take, for example, lower savings. Figure 13 of the paper shows that consumption is higher under a low-saving scenario in the long run. Because the low-saving scenario does not reflect any changes in demographics, this is also what happens to consumption per capita.
It appears, therefore, according to this model, that Chinese savings is above the ‘Golden Rule’ level of savings that drops out of the Solow model. In which case, the policy prescription is relatively clear: the saving rate at the moment is too high.
Determining what happens to consumption per capita in the low-fertility scenario is a little more complicated given that population numbers change, but it does appear that consumption per capita increases with lower fertility.
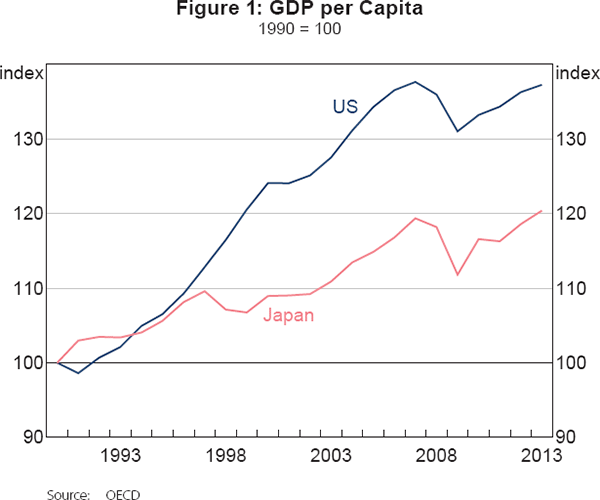
In any case, in an economy with rapidly changing demographics, GDP per capita can give an incomplete picture of welfare. Take, for example, Figure 1, which shows Japanese and US GDP per capita since 1990. Japanese per capita GDP has substantially lagged behind the evolution of US GDP per capita.

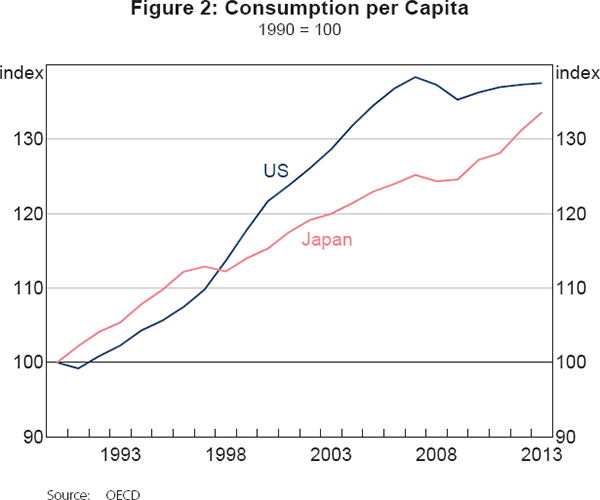
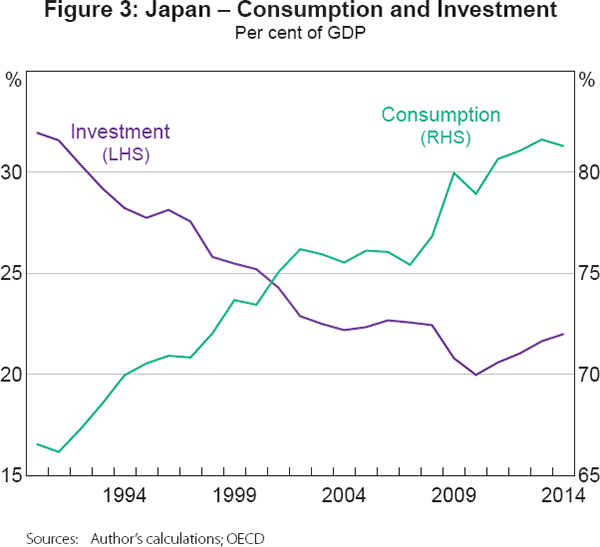
However, if we look at consumption per capita (in this case, private and government consumption), as in Figure 2, the Japanese economy's comparative performance is much better, because the share of Japanese GDP devoted to investment has fallen over the years (Figure 3). As the Japanese population has started to shrink, less capital has been needed to complement the available labour in the workforce and investment has fallen.


Therefore, in a rapidly aging society, consumption will grow faster than GDP. GDP may also miss other features. For example, fast-growing economies may see their terms of trade move against them, as the supply of their goods and services expands rapidly (Acemoglu and Ventura 2002).
While consumption per capita is a better welfare measure, it is by no means perfect. Lifting the restrictions associated with the one-child policy undoubtedly improves welfare and choice, but these improvements will not be picked up by the national accounts.
Another potential reason that consumption, as measured by the national accounts, is an imperfect measure of welfare is that in a rapidly aging economy many people are retiring from the workforce. It is well known that when people retire, measured consumption falls. However, Aguiar and Hurst (2013) pointed out this fall is concentrated in areas where home production is a good substitute, for example food preparation, or areas that are complementary to work, for example travel associated with commuting. In either case, the drop in measured consumption does not reflect a fall in welfare.
Comment 2: The aggregate effects are small
The uncertainties regarding China's economic evolution over the coming decades are large and there is widespread disagreement. Some observers suggest that China could sustain a growth rate of 8 per cent for decades (Lin 2012), while others think 3–4 per cent is an upper bound (Pettis 2013).
Figure 8 of the paper shows the range of GDP growth outcomes associated with the different assumptions about savings and fertility, which spans around 1 percentage point per year out to 2050. In the context of the overall uncertainty of Chinese GDP prospects, and even past variability, 1 percentage point looks rather small, even though, for most economies, it would be significant. This is a valuable message. There is much angst about China's demographic prospects and what that implies for the economy. This paper provides an important counter to that message. According to the model, the Chinese economy will continue to grow, even in the shadow of a shrinking working-age population. Moreover, anything that you do to change the demographic characteristics will not buy you much compared to the overall uncertainty regarding China's medium- to long-term outlook.
Comment 3: The distributional effects might not be small
Pension expenditures are substantial in many countries. It may be the case that the Chinese Government will also incur a large expense. If that is the case the transfer from the working-age population to the older members of the economy could represent a considerable redistribution of income.
This model may be well suited to run these numbers as different age groups are tracked as part of the model. At the moment, it is assumed that the government's budget is balanced, but that could be relaxed. Assumptions could be made about tax revenues and government expenditures, so as to develop a path of government debt. This would be an exercise much like Australia's Intergenerational Report, and would help highlight some of the stresses that will be placed on the budget, and whether some generations may be asked to contribute more than others.
Other
This model is quite rich, and there is much from the paper I have not covered. In particular, the effects on the rest of the world are worthy of a paper on their own.
That richness is an asset. There are many directions this model could be taken. The extension toward distributional considerations that I have suggested is just one example.
References
Acemoglu D and J Ventura (2002), ‘The World Income Distribution’, The Quarterly Journal of Economics, 117(2), pp 659–694.
Aguiar M and E Hurst (2013), ‘Deconstructing Life Cycle Expenditure’, Journal of Political Economy, 121(3), pp 437–492.
Lin JY (2012), Demystifying the Chinese Economy, Cambridge University Press, Cambridge.
Pettis M (2013), ‘Rebalancing and Long Term Growth’, China Financial Markets online blog, 3 September, viewed 7 March 2016. Available at <http://blog.mpettis.com/2013/09/rebalancing-and-long-term-growth/>.
2. General Discussion
The discussion began with comments about factors other than fertility that could affect China's saving rate. One participant suggested that increased longevity could raise the saving rate as people save more to fund the expected extra years in retirement. Another participant questioned how the results would be affected if retirement ages in China were increased, as has occurred in many developed economies. A number of participants also suggested a more balanced gender ratio in China, for example, as a result of relaxing the one-child policy, may lead to a decline in the saving rate.
One participant was interested in how technological progress is captured in the model, citing the increased use of robots in some production processes in China. Another participant also discussed the possibility of allowing technology to change over time in the model or including technology as an endogenous variable. Rod Tyers explained the aim of the current model was to show the difference between economic performance under the different fertility and saving scenarios, abstracting from technological changes. However, he agreed that there were likely to be interactions between the saving rates, the demand for technological change and expected future income and that the authors had considered using a long-run forward-looking closure to capture these interactions.
One participant questioned how changes in the quality of labour and accumulation of human capital are incorporated into the model. Jane Golley suggested the quality of labour is affected by changes in fertility policies. The one-child policy was more strictly implemented in urban areas where workers are higher-skilled on average, and has reportedly reduced the quality of labour in aggregate. She explained that while the model does not fully account for the rural–urban divide, it does distinguish between high-skill and low-skill labour. In the high-fertility scenario, there was a larger increase in the rural population, which slows wage growth for rural Chinese and drives up the wage premium for skilled labour. However, the transformation from low-skill to high-skill labour is slowed by lower per capita income as a result of a larger population.
The authors also responded to the discussant's comment that consumption is a better measure of welfare than GDP. Dr Tyers agreed that consumption as a share of GDP is important and noted that, in order for the share to stay elevated until 2050, the saving ratio would have to drop substantially. He also argued that real GNP is a good measure of real personal income as it captures the choice between consumption and saving. Dr Golley also acknowledged that there were non-economic welfare benefits from more relaxed fertility policies that are important and not captured in the model, such as freedom of choice. Also in response to the discussant and a participant's question, Dr Tyers noted that while the four scenarios only resulted in slightly different projections for GDP growth, the difference between the level of GDP in the baseline scenario and the low-fertility, low-saving scenario was about 30 per cent by 2050.
The implications of the scenarios for global interest rates were also raised by one participant. Dr Tyers stated that in the low-saving scenario interest rates would be 150 basis points higher in China and 100 basis points higher in the rest of the world by 2050, compared with the high-saving baseline scenario. He also elaborated on the effect of China's rebalancing on the global economy. He discussed that the effect of the changes in savings and demographics on international prices were substantial. Under the low-fertility, low-saving scenario, international energy and agricultural prices would fall substantially relative to manufacturing prices. Australia's terms of trade would also be lower under the low-fertility, low-saving scenario compared with the baseline scenario. Large declines in Australia's energy export prices would be partly offset by relatively stable mineral export prices (as China continues to export metals) and lower manufactured import prices (as India and south Asia take over as major low-cost manufacturers). Dr Golley highlighted that the extent to which India would benefit from China's rebalancing would rely on how well it is able to leverage its own demographic dividend, with the dependency ratio in India projected to fall until around 2040.