RDP 2020-08: Start Spreading the News: News Sentiment and Economic Activity in Australia 7. Robustness Tests and Extensions
December 2020
- Download the Paper 1.48MB
7.1 Responses of Economic Activity to News Sentiment Shock Using VAR
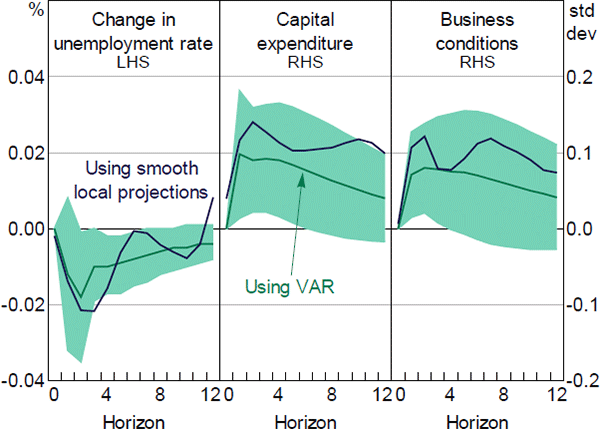
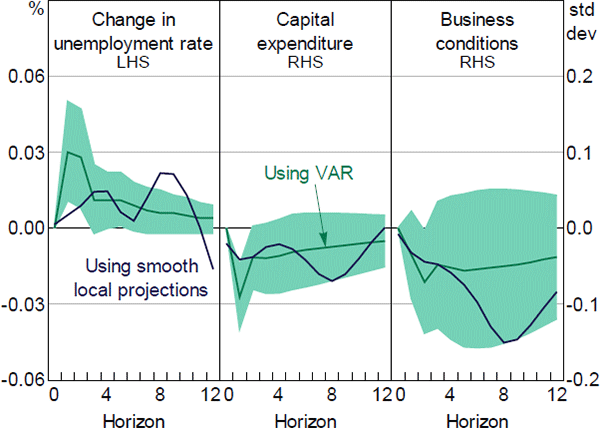
We test for the robustness of estimated impulse responses in Section 5.2 using a multivariate VAR model which includes the current and lags of change in unemployment rate, NAB capital expenditure, NAB business condition index, and the NSI[12]. A lag length of two months is chosen by a combination of information selection criteria. To identify the impulse responses of economic activity to news sentiment shocks we use a Cholesky decomposition with the NSI ordered last. This assumption imposes the restriction that shocks to economic activity affect the news sentiment contemporaneously, but news sentiment only affects economic activity with a lag. We see this as a conservative assumption that makes it more difficult to find a ‘causal’ effect of the news sentiment on the other variables. In Appendix B we present estimates that have the NSI ordered first. Similarly, we run a VAR model to estimate the impulse responses to a news uncertainty shock. Impulse responses of economic measures to a one standard deviation shock in news sentiment and news uncertainty using VAR and LP are both qualitatively and quantitatively comparable (Figures 13 and 14).

Note: Shaded areas are the 90 per cent confidence intervals for the responses using VAR
Sources: Authors' calculations; Dow Jones Factiva; NAB

Note: Shaded areas are the 90 per cent confidence intervals for the responses using VAR
Sources: Authors' calculations; Dow Jones Factiva; NAB
7.2 Alternative Measures of News Sentiment
7.2.1 Using different lexicons
We first check the robustness of our empirical findings by using two other lexicons to construct the NSI: the Harvard General Inquirer (GI) Dictionary (Heston and Sinha 2015) and the Hu and Liu (2004) lexicon (HL). Since the Loughran and McDonald (LM) lexicon is developed specifically for the economics and finance domain, it is generally less covered in news corpus compared with the other lexicons, thus potentially resulting in fewer matched words. We find that the preferred index using the LM lexicon has a stronger correlation with the NAB business conditions index (coefficient of 0.5) than either of the NSIs using GI and HL (coefficients of 0.2 and 0.4 respectively). This suggests that context matters and that it is important to rely on lexicons designed for an economics context.
7.2.2 Using newspaper fixed effects
We follow Shapiro et al (2017) to construct an alternative measure of the NSI by estimating the time effects from the following regression over articles (indexed by a):
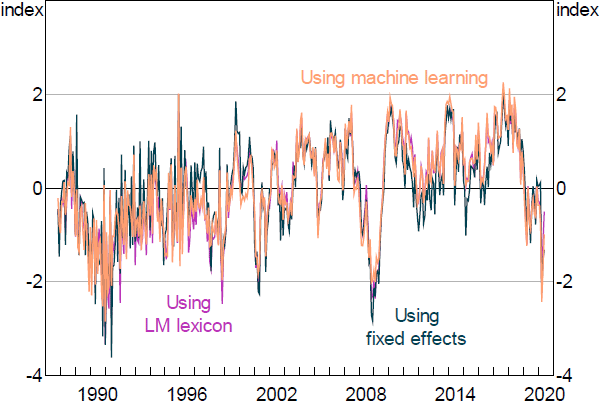
where sa is the net positivity score for article a and ft(a) is a sample month (t) fixed effect. We also control for the article newspaper j and the article type p (online or printed). Thus, fp(a), j(a) is the newspaper and type fixed effect. Since the tone of articles can differ between online and printed versions within the same newspaper, it's important to make sure that the NSI is independent of the trend over time in the composition of the sample across newspapers and types of articles. The monthly NSI is then the estimated monthly fixed effects from Regression (4). Figure 15 suggests that the NSI constructed using this approach is virtually the same as the original one.
7.2.3 Using machine learning
Another approach is to use the machine learning algorithm ‘word2vec’ developed by Mikolov et al (2013), which counts not only exact matches but also words that are semantically similar to the pre-defined list of words in the sentiment dictionaries. For example, if ‘downturn’ were not in the negative dictionary, its semantic similarity to ‘recession’, which is in the dictionary, ensures that it gets picked up by this method. As such, this method has the advantage of potentially capturing the context of sentiment beyond a pre-defined list of words. The algorithm uses a pre-labelled training dataset to construct the linguistic context of words. It takes as input a large corpus of words and produces a vector space in which words that share common contexts in the corpus are located close to each other. For example, the terms ‘recession’ and ‘crisis’ would be placed in close proximity. We test this method using the pre-trained dataset and find the resulting NSI to be very similar to the NSI constructed using the LM lexicon (Figure 15).

Sources: Authors' calculations; Dow Jones Factiva
Footnote
In Appendix C, we present the Granger-causality results of the equations with key macroeconomic measures as dependent variables and NSI or NUI as explanatory variables. The marginal significance levels are reported for the hypothesis that all lags of the given right-hand side variable can be excluded. In other words, the excluded variable does not Granger-cause the equation variable. At the 5 per cent level of statistical significance, all null hypotheses are rejected, suggesting that the NSI and the NUI Granger-cause the key macroeconomic measures.[12]