RDP 2020-08: Start Spreading the News: News Sentiment and Economic Activity in Australia Appendix A: LP and SLP Estimates Using Control Variables
December 2020
- Download the Paper 1.48MB
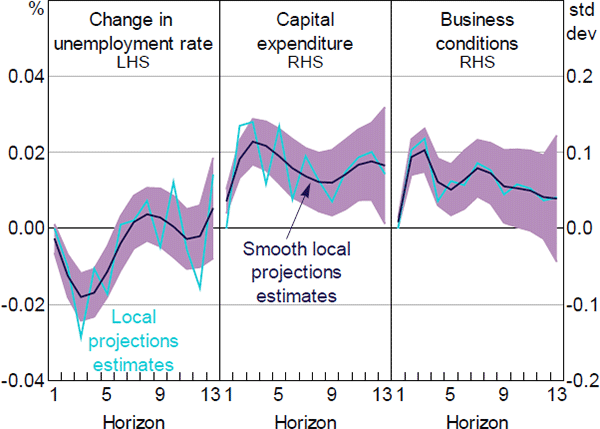
Note: Shaded areas are the 90 per cent confidence intervals for the smooth local projections estimates
Sources: Authors' calculations; Dow Jones Factiva; NAB
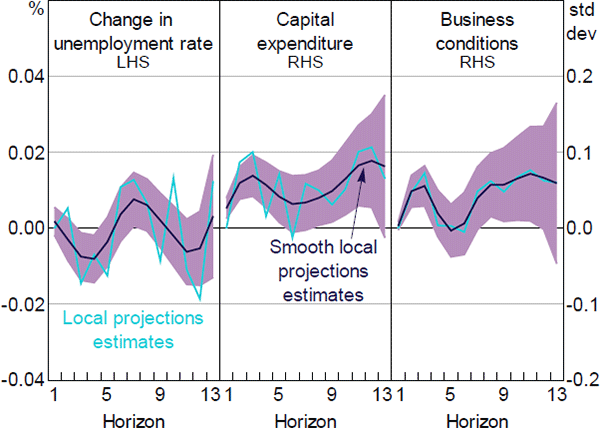
Note: Shaded areas are the 90 per cent confidence intervals for the smooth local projections estimates
Sources: Authors' calculations; Dow Jones Factiva; NAB
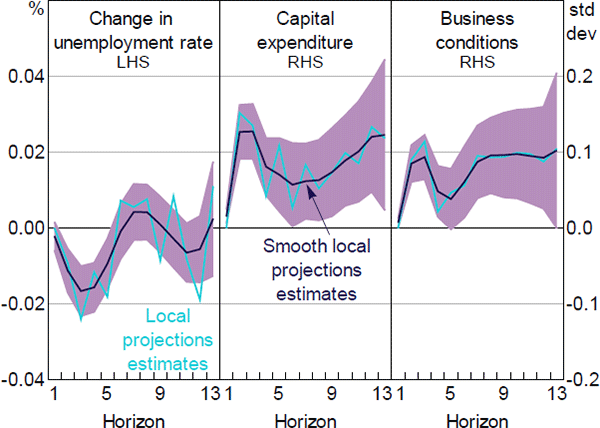
Note: Shaded areas are the 90 per cent confidence intervals for the smooth local projections estimates
Sources: Authors' calculations; Dow Jones Factiva; NAB
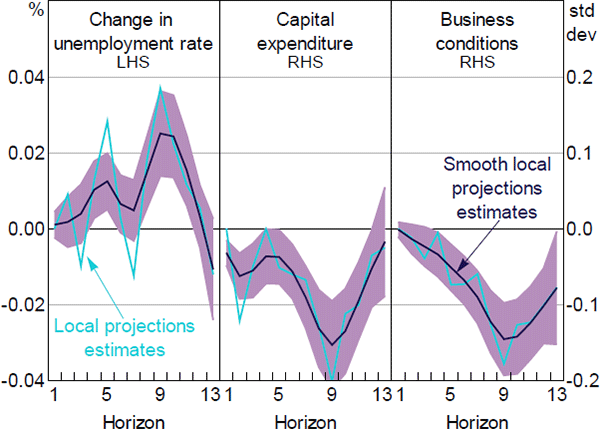
Note: Shaded areas are the 90 per cent confidence intervals for the smooth local projections estimates
Sources: Authors' calculations; Dow Jones Factiva; NAB
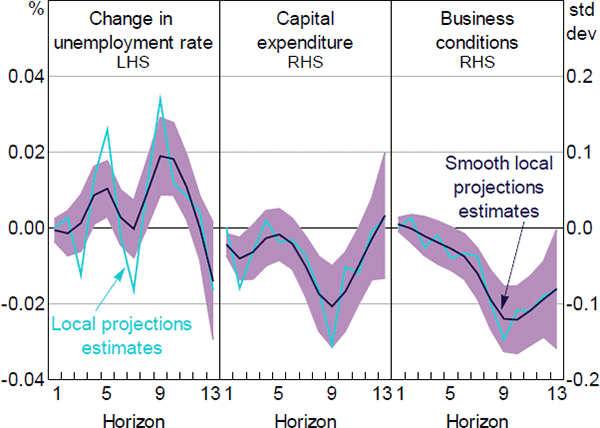
Note: Shaded areas are the 90 per cent confidence intervals for the smooth local projections estimates
Sources: Authors' calculations; Dow Jones Factiva; NAB
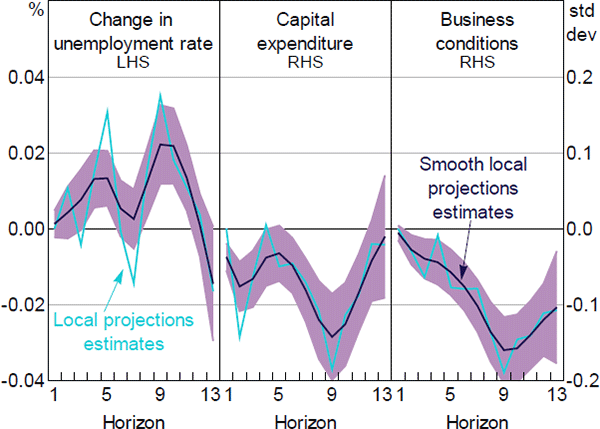
Note: Shaded areas are the 90 per cent confidence intervals for the smooth local projections estimates
Sources: Authors' calculations; Dow Jones Factiva; NAB