RDP 2020-07: How Many Jobs Did JobKeeper Keep? Appendix E: Alternative Identification Strategy
November 2020
- Download the Paper 1.79MB
As a sense check on our baseline results, we also estimated the effects of JobKeeper on employment using a different component of the worker-eligibility test – the residency requirement. With the exception of New Zealand citizens, temporary residents were not eligible for JobKeeper.[58] This residency requirement provides us another way of estimating the causal effect of JobKeeper on employment.
E.1 Treatment and Control Groups
In this alternative approach, we focus entirely on differences in worker eligibility arising from the residency requirement, rather than the job tenure threshold used for our baseline results. As with the baseline approach, we begin by identifying two groups of workers that are similar aside from the fact that one of the groups does not meet the residency requirement and therefore cannot receive JobKeeper (the control group) and the other group does satisfy the residency test (treatment group). By comparing the average employment rates across these two groups before and after JobKeeper we can derive an estimate of the causal effect of JobKeeper on employment. As before, to do this we use person-level data from the LLFS and a difference-in-differences approach.
Specifically, we define the treatment group as workers who held a Subclass 444 (Special Category) Visa, notably citizens of New Zealand. Unlike other temporary visa holders, people on 444 visas are eligible for JobKeeper. The control group is recent arrivals on all other types of temporary visas, who are not eligible for JobKeeper.[59] Note that unlike our baseline approach, the treatment and control groups using the alternative identification strategy include a mix of casual and non-casual employees and self-employed.[60]
As the descriptive statistics in Table E1 show, recent arrivals from New Zealand are similar to recent arrivals from other countries in a number of ways, such as in the types of industries they tend to work in (in most cases). The main difference is that a smaller share of recent migrants from New Zealand were studying in Australia compared to those from other countries (and, as such, migrants from New Zealand also tend to be slightly older than other migrants, on average). We account for the differences in study patterns and age by controlling for these factors (and other factors) in our model directly.
| Control group (non-Oceanic born) | Treatment group (born in New Zealand or other Oceania) |
Difference | p-value of difference | |
|---|---|---|---|---|
| Industry (%) | ||||
| Agriculture, forestry & fishing | 2.6 | 0.0 | 2.6 | 0.2932 |
| Mining | 0.8 | 7.3 | −6.5 | 0.0003 |
| Manufacturing | 7.4 | 2.4 | 5.0 | 0.2306 |
| Electricity, gas, water & waste | 1.0 | 2.4 | −1.5 | 0.3853 |
| Construction | 6.1 | 4.9 | 1.2 | 0.7515 |
| Wholesale trade | 3.3 | 9.8 | −6.5 | 0.0340 |
| Retail trade | 12.9 | 7.3 | 5.5 | 0.3006 |
| Accomm & food services | 12.9 | 14.6 | −1.8 | 0.7425 |
| Transport, postal & ware | 7.4 | 12.2 | −4.8 | 0.2675 |
| Info media & telecom | 1.3 | 0.0 | 1.3 | 0.4603 |
| Finance & insurance | 1.8 | 4.9 | −3.1 | 0.1759 |
| Rental, hiring & real estate | 1.3 | 0.0 | 1.3 | 0.4603 |
| Prof, scientific & tech services | 12.5 | 2.4 | 10.1 | 0.0536 |
| Admin & support services | 5.8 | 9.8 | −4.0 | 0.2992 |
| Public admin & safety | 0.0 | 0.0 | 0.0 | na |
| Education & training | 4.1 | 4.9 | −0.8 | 0.8142 |
| Health care & social assistance | 13.5 | 7.3 | 6.2 | 0.2564 |
| Arts & recreation | 1.3 | 2.4 | −1.1 | 0.5535 |
| Other services | 4.0 | 7.3 | −3.4 | 0.2977 |
| Employment type (%) | ||||
| Casual | 33.4 | 36.6 | −3.1 | 0.6808 |
| Permanent | 55.4 | 63.4 | −8.1 | 0.3152 |
| Other | 11.2 | 0.0 | 11.2 | 0.0235 |
| Job tenure (years) | 1.8 | 1.9 | −0.1 | 0.7446 |
| Occupational skill level | 3.1 | 2.9 | 0.2 | 0.4928 |
| (1 = highest, 5 = lowest) | ||||
| Hours worked | 31.3 | 33.7 | −2.4 | 0.3080 |
| One job only (%) | 93.4 | 97.6 | −4.2 | 0.2914 |
| Student (%) | 24.5 | 12.2 | 12.4 | 0.0723 |
| Age (years) | 32.7 | 35.7 | −3.0 | 0.0216 |
| Female (%) | 42.7 | 53.7 | −11.0 | 0.1699 |
| Observations | 607 | 41 | ||
|
Note: Characteristics in February for sample remaining in June 2020; employees and self-employed who arrived in the past 1–6 years Sources: ABS; Authors' calculations |
||||
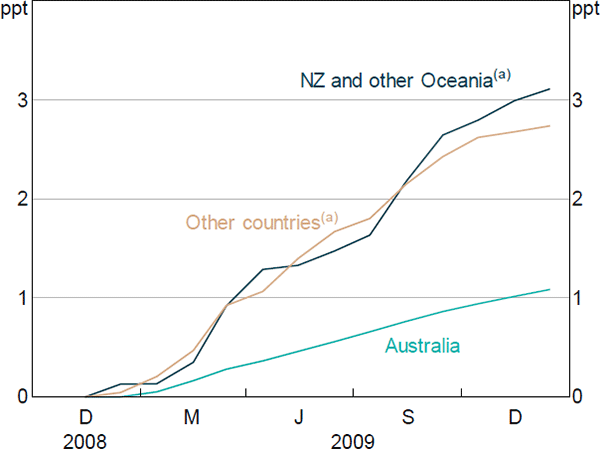
During the GFC, the rate of unemployment experienced by recent arrivals from New Zealand and the unemployment rate experienced by recent arrivals from other countries increased by a similar amount, suggesting these groups have similar sensitivity to changing economic conditions (Figure E1). This gives further confidence that labour market outcomes of these two groups would also have tracked quite closely during the COVID-19 period in the absence of JobKeeper. In contrast, Australian-born workers' outcomes are less sensitive to economic conditions, so using Australian-born as the treatment group would likely lead us to overstate the effects of JobKeeper on employment.

Notes:
Monthly data are smoothed using a 12-month trailing average
(a) Arrived in Australia within the past 1–6 years
Sources: ABS; Authors' calculations
E.2 Inferring Visa Status and Type
The LFS does not ask people whether they hold a visa or the type of visa they hold. But it does collect enough information to infer the likelihood a person holds a particular type of visa, if at all.[61] This includes:
-
Years since arrival
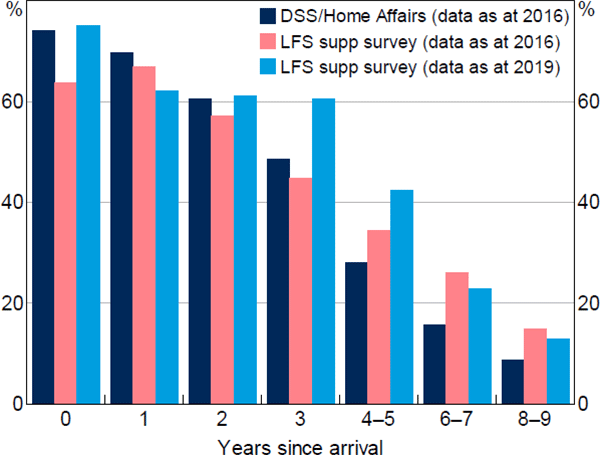
Survey and administrative data sources suggest that the longer a person lives in Australia, the more likely they are to be a citizen or permanent resident rather than a temporary resident (Figure E2).[62] This reflects the progression of temporary residents to permanent residency over time, and that those who do not attain permanent residency are more likely to leave the country.
Figure E2: Temporary Visa HoldersShare of foreign-born population, by years since arrival
Note: Excludes New Zealand citizens
Sources: ABS – Australian Census and Migrants Integrated Dataset, Australian Census and Temporary Entrants Integrated Dataset, and Characteristics of Recent Migrants Survey; Authors' calculations
We limit our estimation sample to migrants who arrived within the past 1–6 years (measured as of February 2020). The administrative data suggest that roughly half of all people who migrated to Australia within the past six years (and continue to live in Australia) are on a temporary visa, while the other half have attained permanent residency or citizenship (Figure E2). This means that our regression estimates – which pool over all people who arrived within the past 1–6 years regardless of their residency status – will underestimate the effect of JobKeeper by about one-half, all else being equal. We adjust for this bias by applying a scaling factor to our regression estimates (see Section E.4 below).
Our decision to focus on people who arrived in the past 1–6 years is designed to balance the trade-off between ensuring a large enough sample to estimate our regression coefficients precisely and diluting the share of the sample that actually hold a temporary visa.[63] We exclude those who arrived in the past 12 months because labour market outcomes of this group are volatile and unrepresentative.
-
Country of birth
To infer the type of visa a person holds, we use their country of birth as a proxy. Administrative data indicate that virtually all temporary residents born in New Zealand hold a 444 visa (ABS 2019a). The same is true for those born in other Oceanic countries, such as Samoa, the Cook Islands and Fiji, where 85 per cent of all temporary residents in Australia are on 444 visas (meaning they had New Zealand citizenship before migrating). In comparison, less than 10 per cent of temporary residents born outside the Oceanic region hold a 444 visa.[64]
We allocate migrants who arrived in the past 1–6 years to the treatment group if they were born in New Zealand or other Oceanic country, and to the control group if they were born elsewhere. Our estimation sample is restricted to those employed in February 2020, which means we implicitly focus on those with work rights.[65] We apply a (additional) scaling factor to our difference-in-differences estimates to account for the imperfect overlap between country of birth and whether a person holds a 444 visa or not (see Section E.4 below).
E.3 Estimation Equation
To estimate the effects of JobKeeper residency eligibility on employment we estimate a model similar to Equation (2), but replacing Eligi with a dummy variable that equals one if the worker was born in New Zealand or other Oceanic country, and zero if they were born elsewhere. We also include all the variables listed in Table E1 as controls (all of which are measured as of February 2020). We estimate this equation month-by-month using a linear probability model with robust standard errors.
E.4 Results
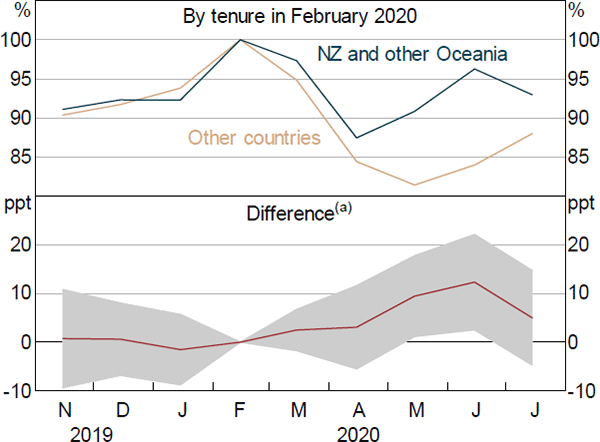
The top panel of Figure E3 shows the share of the treatment (dark line) and control group (light line) that were employed in each month between November 2019 and July 2020, conditional on being employed in February. Around 90¾ per cent of recently-arrived New Zealanders who were employed in February 2020 were still employed three months later, compared to 81½ per cent of those recent arrivals born in other countries. The difference in these employment rates in May – 9½ percentage points – is our difference-in-differences estimate for that month. These estimates are presented in the bottom panel of Figure E3, along with 95 per cent confidence intervals.
As discussed above, we need to apply a scaling factor to these regression estimates to account for the differences between the variables we observe in the data – country of birth and years since arrival – and what we would ideally observe – visa status and visa type. Applying this scaling factor (2.17) to our difference-in-differences estimates suggests that being worker-eligible for JobKeeper raised a person's probability of remaining employed by around 20 percentage points in May and 27 percentage points in June.[66] This is more than twice as large as the intent-to-treat effect we estimated using our baseline approach. The estimates for July were smaller and not statistically significant.

Notes:
Employees and self-employed who arrived in the past 1–6 years and were employed in February 2020; estimates conditional on the control variables listed in Table E1
(a) Shaded area represents 95 per cent confidence intervals
Sources: ABS; Authors' calculations
The implied effect of actually receiving JobKeeper on employment is also larger than our baseline estimate. To see this, we again assume that one-third of all worker-eligible individuals received JobKeeper.[67] This suggests that receiving JobKeeper increased a person's probability of staying employed by more than 60 percentage points in May and June, relative to the counterfactual of not receiving JobKeeper. This is three times larger than our baseline estimate. One possible explanation is that the effects of JobKeeper are heterogeneous, with JobKeeper being more effective at preserving employee-employer relationships within the population of recently arrived migrants than it was at preserving those relationships amongst permanent residents and citizens. However, the confidence intervals around this estimate are large (and likely larger than indicated on Figure 3).
It is reassuring that both identification strategies lead to the same overall conclusion that JobKeeper played a key role in cushioning employment losses in its first four months. In both cases, the point estimates are economically and statistically significant, they just differ in magnitude.
Although the migration approach provides a useful sense check, our overall assessment about the quantitative effect of JobKeeper on total employment is based on our preferred approach using the tenure eligibility of casuals. We have more confidence in the results from our baseline approach, as it has fewer potential issues than the migration approach (discussed below). If we had placed more weight on the migration approach, our headline estimate of the employment effect of JobKeeper would be larger.
E.5 Limitations
Relative to our baseline approach (using the 12-month tenure rule for casual workers), the alternative identification strategy has several shortcomings that explain why we give it less emphasis:
- Sample size: there are only 53 individuals in the treatment group (801 in the control group) for estimating the employment effect in May.[68] There is a risk that our IV-style estimator suffers from a small sample bias.
- Adjustments for incomplete data: imperfect measures of visa status and visa type mean we need to make adjustments to our regression estimates that can introduce error. Also, the standard errors do not account for these adjustments, so the precision of our estimates is likely overstated.
- Parallel trends: the treatment and control groups are far less balanced on observable dimensions than in the baseline approach (Table E1). Although we control for these variables in our model, this lack of balance on observables suggests a greater risk that the treatment and control groups will also differ in terms of unobservable factors associated with employment loss. Indeed, there is some evidence of an ‘effect’ of JobKeeper before the program was announced (Figure E3, albeit not statistically significant), which may signal a violation of the parallel trends assumption.
- External validity: recent migrants are likely less representative of the broader population of JobKeeper recipients than the casual sample used for the baseline results. For example, most recent migrants do not have access its other forms of income support, such as the JobSeeker payment, which could influence their responses.
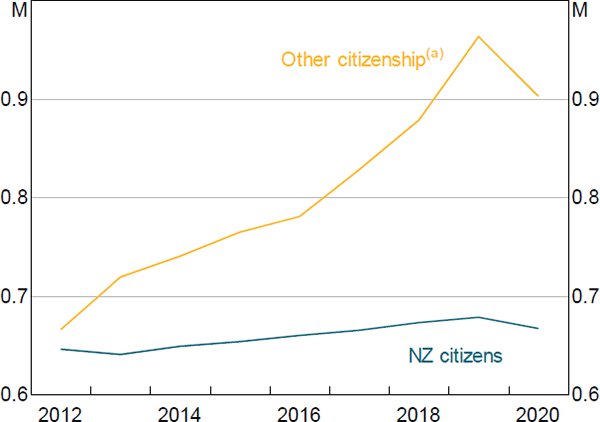
- Selection bias: our estimates may be biased if temporary visa holders departed Australia (and thus drop out of our sample) if their work prospects were adversely affected by COVID-19.[69] The number of visa holders from New Zealand remained fairly steady during the COVID-19 crisis, while those from all other countries have fallen sharply (Figure E4).

Note: (a) Temporary skilled, student, temporary graduate and working holiday maker visa
Sources: Authors' calculations; Department of Home Affairs
E.6 Differential Treatment Effects by Employment Type
Although our main approach is restricted to casual employees, the migration approach captures the effects of JobKeeper on both casual and permanent staff, and also the self-employed. The estimates in Figure E3 restrict the effects of JobKeeper worker eligibility to be constant across these different categories of employment. Relaxing this assumption allows us to test whether the effects of JobKeeper worker eligibility differs for casuals and permanent employees.[70]
To investigate this further we augment our model with an interaction between the treatment variable and a dummy variable that equals one if the worker is a permanent employee, and zero otherwise.[71] A test for differential effects for employees on different work arrangements is a test of whether the coefficient on this interaction is statistically significant. The coefficient is close to zero and not significant (p-value = 0.66, 0.64 and 0.31 in May, June and July). That is, we cannot reject the hypothesis that the effects of JobKeeper on casuals and permanent employment are equal. We discussed this finding in Section 8.3. An issue with this test is that it is based on a very small sample (particularly at the subgroup level), so has low power.
Footnotes
To be eligible for JobKeeper, a person must have been an Australian citizen or have held a permanent visa or Special Category (Subclass 444) Visa (and were a resident for Australian tax purposes) as at 1 March 2020 (Treasury 2020a). [58]
As at 30 March, there were 965,000 temporary visa holders with a right to work in Australia (excluding New Zealand citizens), of which 59 per cent were students. The remainder of those with work rights held a working holiday maker, temporary skilled, or temporary graduate visa. These data are from the Department of Home Affairs (2018). Not all visa holders with a work right will exercise that right, especially partners and children of a primary visa holder. These figures include secondary visa holders (i.e. family members), who typically also have work rights. Temporary visa holders with a work right are entitled to the same basic rights and protections as Australian citizens and permanent residents under Australian workplace laws (Migrant Workers' Taskforce 2019). Student visa holders are limited to working a maximum of 40 hours per fortnight during teaching periods, and unlimited hours during vacation periods. [59]
We exclude from the sample any worker employed in the public sector or for a major bank. [60]
The LFS only collects data on usual residents of Australia, which means the survey excludes overseas visitors. The official ABS definition of a usual resident is a person who has been (or expects to be) residing in Australia for 12 months or more in a 16-month period. However, the LFS uses a less precise approach; a screening question simply asks if the respondent is a short-term resident and, if so, they are excluded from the survey (ABS 2017). This criterion is based on a person's duration of stay within Australia. [61]
There are differences in the scope of these collections. The Census excludes those who indicated they would be usually resident in Australia for less than one year (‘overseas visitors’). [62]
Unlike other temporary migrants, New Zealand citizens who have lived in Australia for at least 10 years without interruption are eligible for JobSeeker for up to 6 months. Excluding people who have resided in Australia for more than 10 years means we will not accidentally attribute the effects of some other policy (e.g. JobSeeker) to JobKeeper. [63]
The share of temporary residents on 444 visas is relatively high for those born in the United Kingdom (28 per cent) and South Africa (54 per cent). [64]
Clearly some people in Australia without work rights may still seek work in the underground economy. However, after accounting for the screening questions in the LFS, it is unlikely that migrants working illegally represent a material share of our estimation sample. [65]
This scaling factor is calibrated using data from external administrative and survey sources. It accounts for the share of recent arrivals that are temporary, rather than permanent (around 52 per cent) and also a small adjustment for the fact that a small share of the control group also hold a 444 visa (around 6 per cent). This implies that 46 per cent of our control group is likely to be definitely ineligible for JobKeeper based on their residency status. In turn, this means we need to scale our resulting difference-in-differences estimate by 2.17 (= 1 ÷ 0.46) in order to get an intent-to-treat effect that is consistent with the intent-to-treat effect estimated using the baseline approach. This scaling factor is different to the scaling factor needed to translate our estimates of the effect of worker eligibility to estimates of the effect of JobKeeper. [66]
The take-up rate is close to ⅓ when we stratify the take-up rate calculation by the industry composition of the recent migrant sample. [67]
In June there are 41 and 607 individuals in the treatment and control groups, respectively, and 31 and 423 in July. [68]
Even if our treatment and control groups had experienced similar COVID-19 shocks overall, this non-random attrition from the sample would lead us to understate the effects of JobKeeper on employment amongst those who remained in the sample. However, to the extent that this fall was driven by border closures preventing re-entry of foreigners, rather than because of increased exits due to labour market conditions, this attrition need not be a source of bias. Our sample is matched, meaning that students who did not return to Australia for study in early 2020 are not included anyway. [69]
Casual and permanent employees may also have different levels of productivity, firm-specific human capital and wages. [70]
The base category is casual employees. We also include interactions for ‘other’ employment types (self-employed and contributing family workers) and the main effects. [71]