Bulletin – September 2014 Global Economy A Century of Stock-Bond Correlations
- Download the article 450KB
Abstract
The correlation between movements in equity prices and bond yields is an important input for portfolio asset allocation decisions. Throughout much of the 20th century, the correlation between equity prices and government bond yields in the United States and other countries, including Australia, fluctuated but tended to be negative. However, stock-bond yield correlations have been largely positive since the late 1990s, rose strongly during the global financial crisis and have since remained at a high level for a prolonged period. The more recent period of positive correlation in part reflects the pronounced and persistent effect of the financial crisis on the economic outlook, though it may also owe in part to an increase in the importance of uncertainty about real economic activity in driving both government bond yields and stock prices. Changes in US monetary policy look to have exerted an opposing force on the correlation at times, driving it lower.
Introduction
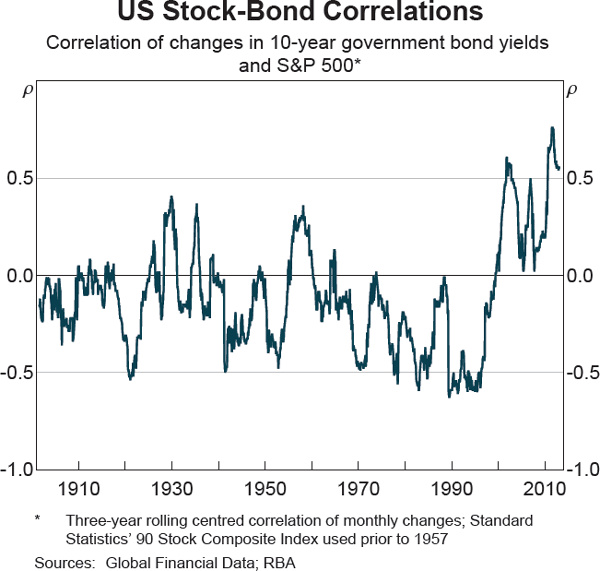
Imperfect correlation of asset returns is a fundamental assumption used in portfolio theory and is the basis for construction of diversified investment portfolios (Markowitz 1952; Sharpe 1964). However, correlations of returns on various risky and risk-free assets do change over time and have at times switched signs. For instance, the correlation between US equities and long-term US Treasury yields was negative over much of the 20th century but has been strongly positive in the 2000s to date (Graph 1).[1] The recent period of positive correlations has been commonly ascribed to the emergence of a ‘risk-on, risk-off’ paradigm, whereby US Treasuries and equities have served as proxies for ‘safe-haven’ and ‘risk’ assets, respectively, and broad shifts in risk sentiment have had an unusually large role in determining asset price movements. However, it is notable that the stock-bond yield correlation had already been positive for most of the decade before the global financial crisis. Similarly positive stock-bond correlations have also been apparent in other developed countries, including Australia, over this time. This article considers how the fundamental drivers of asset prices have affected the correlation between equity prices and bond yields over the past 100 years.
Fundamental Drivers of Stock Prices and Bond Yields
Yields on longer-term government bonds are determined by the expected path of the risk-free rate (over the life of the bond), plus a term premium that compensates investors for uncertainty about potential future changes in the value of the bond stemming from changes in real interest rates and/or inflation. A firm's stock price is determined by the present value of expected future dividend payments, with future payments discounted by the expected path of the risk-free rate and an equity risk premium (the additional return over the risk-free rate that investors require in order to hold riskier stocks).
At a more fundamental level, these variables reflect expectations for, and uncertainty about, growth and inflation. In particular, changes in investors' central expectations for growth and inflation determine their forecasts for dividends and interest rates; stronger economic growth and higher inflation increase interest rates (via actual or expected future policy tightening) while also raising dividends via increased corporate profits. The extent to which there is uncertainty about these variables influences stock prices and bond yields via the equity risk and term premia. An increase in uncertainty about growth raises the equity risk premium while plausibly lowering the term premium, whereas increased inflation uncertainty raises both premia.[2]
Whether these shocks cause equity prices and bond yields to move in the same, or the opposite, direction is theoretically ambiguous. While positive growth or inflation shocks raise bond yields, they have an uncertain impact on stock prices given that expected dividends and the discount rate should both rise. As a result, the expected sign of the correlation following a growth or inflation shock largely depends on the extent to which expected dividends change by more or less than the discount rate, with:
- growth shocks arguably raising the correlation, since stronger economic growth will have a direct positive effect on expected dividends but only an indirect effect on interest rates, hence possibly boosting stock prices
- inflation shocks plausibly lowering the correlation, since higher inflation directly raises interest rates while the positive effect on expected dividends could be muted to the extent that the increase is attributable to supply factors or that inflation has a negative impact on growth.
In contrast, the impact of changes in uncertainty on the correlation is, at least in theory, less ambiguous as:
- an increase in uncertainty about the outlook for growth will raise the correlation, as the equity risk premium increases, depressing stock prices, while the bond term premium declines
- an increase in uncertainty about the outlook for inflation will reduce the correlation by raising the discount factor for stocks and the term premium in bond yields.
While both stock prices and bond yields are typically influenced by multiple, coincident shocks, making identification difficult, the existing literature provides some empirical support for this framework. Shiller and Beltratti (1992) argue that negative correlations between equities and bond yields over the century to 1989 are due to changes in a common interest rate factor, while Andersson, Krylova and Vähämaa (2008) find that negative (positive) stock-bond yield correlations coincided with periods of high (low) inflation expectations, influencing asset prices through the interest rate component. Results from D'Arcy and Poole (2010), using a more recent sample, suggest that the relative importance of shocks to the discount factor may have diminished. They find that between 2001 and 2010, positive US employment data surprises tended to increase earnings growth expectations by slightly more than they increased the discount rate on equities. As a result, positive US employment data surprises tended to increase both stock prices and US Treasury yields. There is also an empirical literature looking at the relationship between uncertainty and stock-bond correlations; for example, Li (2002) finds that uncertainty about expected inflation and real interest rates has led to stronger negative stock-bond correlations, while d'Addona and Kind (2006) show that inflation volatility weakens correlations.
With this framework in mind, the following sections look at the factors that have contributed to the observed stock-bond yield correlation over history. Due to the size of US stock and bond markets, the analysis will focus first on US stock-bond yield correlations, before briefly examining developments in other countries, including Australia.
The Evolution of US Stock-Bond Correlations
Inflation shocks and uncertainty
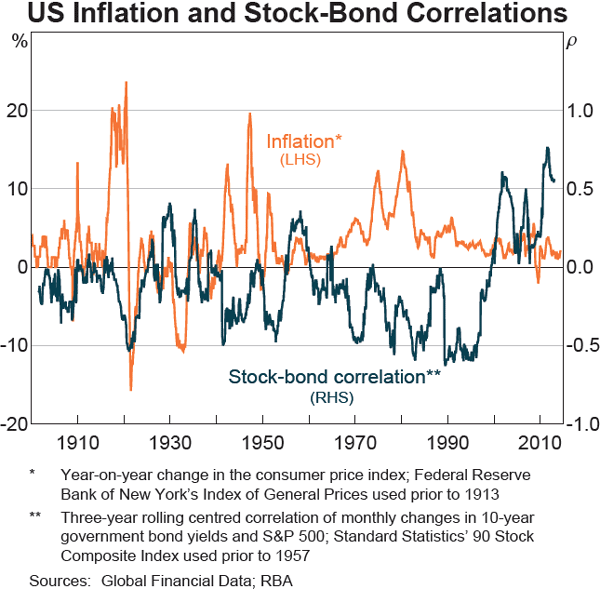
The US stock-bond correlation has fluctuated around a slightly negative average level over most of the 20th century, with periods of high and variable inflation generally coinciding with strong negative correlations (Graph 2). This was especially the case between the 1970s and late 1980s, amid persistently high inflation, in part a result of significant increases in global oil prices. These developments also underpinned increased inflation uncertainty, as seen in relatively volatile inflation expectations over most of those two decades and the years that followed. These factors, in aggregate, were likely to have contributed to negative correlations via their influence on the common interest rate factor that drives equity prices and bond yields (consistent with the findings of the literature mentioned above).[3]
Real shocks and uncertainty
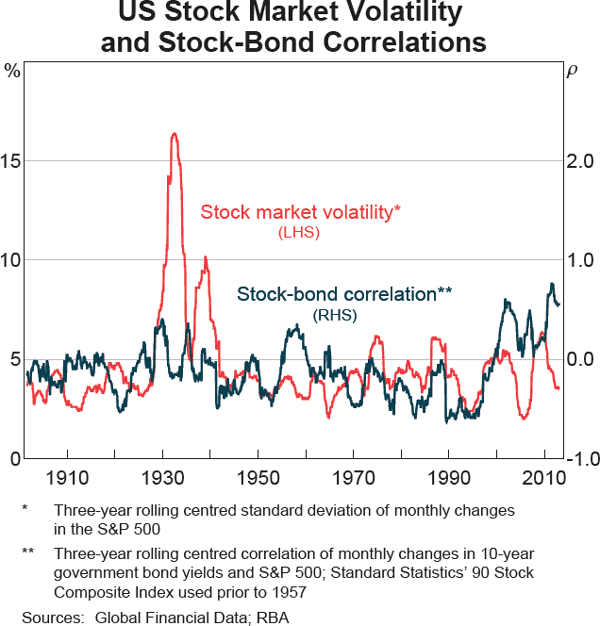
While shocks to inflation appear to have been particularly important over much of the past century, contributing to negative correlations between equity prices and bond yields, the correlation rose into positive territory on a number of occasions. For example, it rose around the time of the 1930s Depression and the 1970s recession, the 1987 stock market crash and the late 1990s Asian and Russian financial crises. The correlation also rose during the early 2000s recession, the more recent global financial crisis and the European sovereign debt crisis. Each of these periods corresponds to an episode of heightened equity market volatility and economic recession (Graph 3).[4] These correlation shifts may reflect the possibility that uncertainty in earnings expectations over some of these periods raised the equity risk premium, thereby lowering equity prices, while reducing the term premium on bonds and hence pushing correlations upwards. These observed rises in stock-bond correlations could also result from adverse growth shocks. Such shocks depress the expected path of short-term interest rates, thereby lowering US Treasury yields, and will cause stock prices to decline if expected dividends fall by more than the decline in the discount rate (as a result of lower expected short-term interest rates).
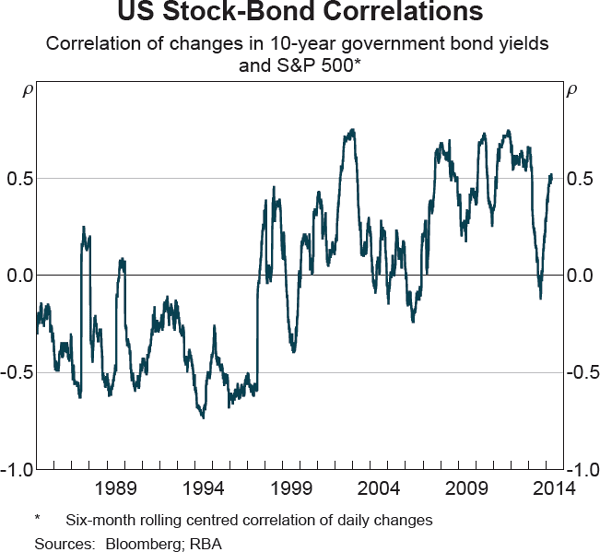
Stock prices and bond yields have been generally positively correlated since around the end of the last century, marking an unusually prolonged period of positive correlation (Graph 4). One reason for this has been the magnitude and persistence of the global financial crisis, which saw correlations become strongly positive in response to an increase in uncertainty about the economic outlook. This is consistent with the pattern that was evident in other major downturns throughout the past century, for example around the 1930s Depression. However, the positive correlation predates the onset of the crisis in 2007.
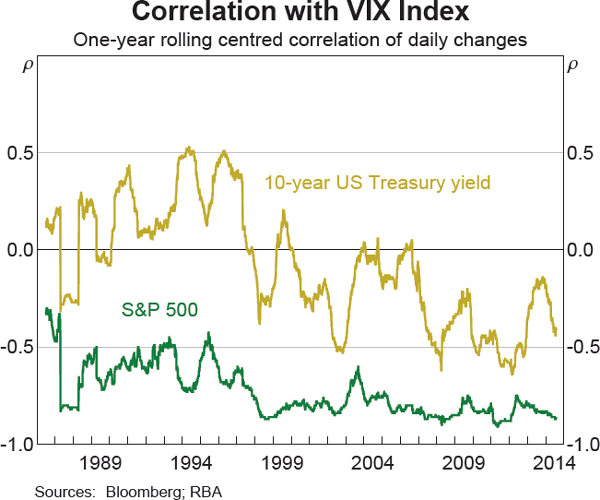
Two other developments are likely to have contributed to this unusually high level of stock-bond correlations. First, there are indications that the term premium has become increasingly sensitive to uncertainty about growth (Dick et al 2013), implying that the same degree of uncertainty about real activity led to stronger positive correlations as bond yields became more sensitive to the outlook for growth. This is consistent with US Treasuries increasingly being viewed as a ‘safe-haven’ asset for global investors, and the substantial rise in foreign holdings of Treasuries over the past 50 years. Indeed, foreign investors' purchases of US Treasuries have historically been negatively correlated with the VIX index of expected US equity market volatility, which tends to rise during periods of elevated real uncertainty. However, in recent years foreign purchases have tended to increase in response to higher equity market volatility.[5] Consistent with this, Treasury yields and the VIX index have historically been uncorrelated but have displayed a strong negative correlation more recently (Graph 5). As a result, the positive impact of heightened uncertainty about real growth on the stock-bond correlation has increased since 2000 (Table 1).
A second possible factor behind the unusually persistent positive stock-bond yield correlation relates to the rise in estimates of the equity risk premium (Duarte and Rosa 2013).[6] This has occurred alongside a decline in short-term rates and has probably led to the equity risk premium having a proportionally larger influence on the discount rate for equities. As a result, equity prices may have become more sensitive to uncertainty about real growth, and thus more positively correlated with bond yields.
| 1986 to 1999 | 2000 to 2014 | |
|---|---|---|
| Low expected equity market volatility | −0.42 | 0.13 |
| Average expected equity market volatility | −0.40 | 0.34 |
| High expected equity market volatility | −0.14 | 0.50 |
|
(a) Low, medium and high volatility refer to levels of the VIX index below the first quartile, between the first and third quartile, and above the third quartile of its historical distribution, respectively Sources: Bloomberg; RBA |
||
Monetary policy
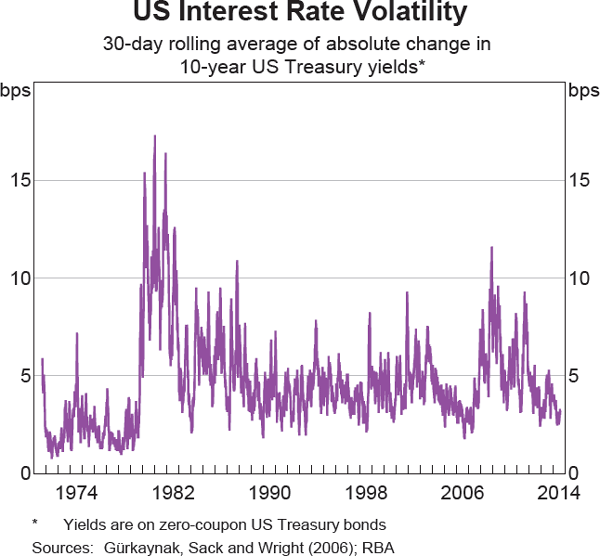
Shifts in monetary policy regimes can result in the stock-bond yield correlation declining, given that higher interest rates raise bond yields but reduce future earnings. This was likely to have been one driver of the strongly negative correlation in the early 1980s, a period in which volatility in interest rates was especially high due in part to efforts by the US Federal Reserve to lower the level of inflation (Graph 6).
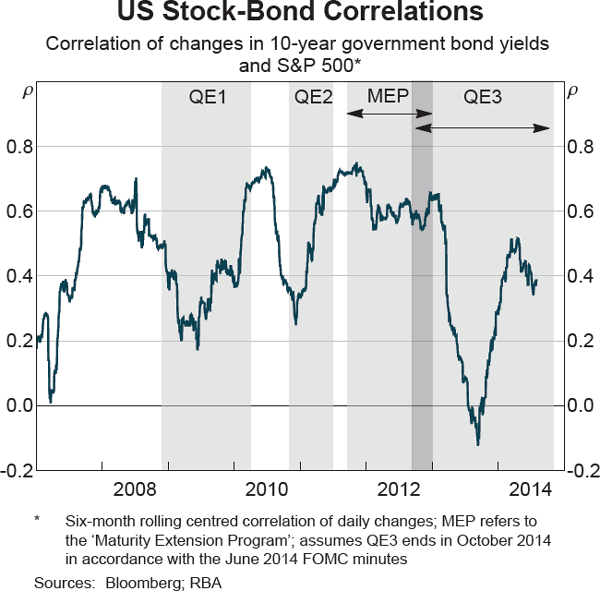
More recently, there is evidence that the US Federal Reserve's asset purchase program (or ‘quantitative easing’) depressed the level of Treasury yields (Bernanke 2013; Krishnamurthy and Vissing-Jorgensen 2013), while it was likely to have raised equity prices. As a result, stock-bond yield correlations fell towards zero briefly in 2009 and 2011 at times that roughly coincided with the Fed's first and second rounds of asset purchases (Graph 7). However, identifying the impact of monetary policy on the correlation is difficult given that these programs occurred in response to developments in growth and inflation. There was a clearer negative impact on the correlation following former Federal Reserve Chairman Bernanke's May 2013 Senate testimony, which caused investors to reassess the timing of the reduction in asset purchases (despite there being no explicit policy change at that time). Over subsequent months, positive US data surprises – in particular those related to the labour market – brought forward market expectations for the pace of ‘tapering’ and increases in interest rates. Such events tended to increase US Treasury yields sharply, but often lowered US equity prices as the positive impact on expected future earnings from strong data was offset by the impact of higher expected interest rates. As a result, the stock-bond yield correlation declined to around zero, though it has since risen again as investors'expectations for the future path of the federal funds rate stabilised.
Developments in Other Countries
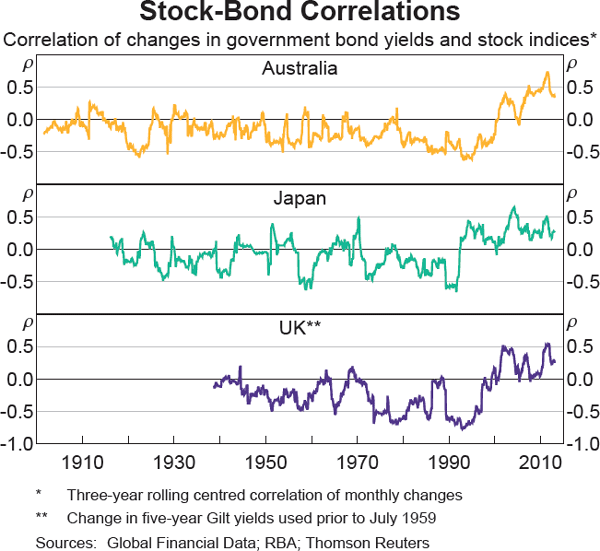
An unusually prolonged period of positive stock-bond yield correlations has also been apparent in other developed markets, with the explanations above also relevant (Graph 8). For example, the stock-bond yield correlations in Australia and the United Kingdom also tended to be negative prior to the late 1990s, and tended to increase at times of heightened uncertainty about real economic activity (though more notably so in the United Kingdom than Australia, perhaps reflecting a perception that Australian government bonds were less of a ‘safe haven’ historically than they are now). The average correlation has also risen in recent years, with the shift in both countries' stock-bond correlations largely mirroring that in the United States. In Japan, bond yields and equity prices were typically slightly negatively correlated until the mid 1990s, and have since been slightly positively correlated as heightened growth uncertainty was followed by a prolonged period of low inflation and subdued growth. Japan's early experience of low inflation is a possible reason why its stock-bond correlation turned positive prior to those in Australia, the United States and the United Kingdom.
Conclusions
The stock-bond yield correlation has been positive for an extended period over the past 15 years, in contrast to the negative correlation observed throughout much of the 20th century. An important factor underlying the recent, relatively long period of positive correlations has been the considerable and lingering uncertainty created by the global financial crisis, which saw correlations rise in a continuation of the pattern observed during other recessionary periods over the past century. The relatively long period of positive correlation is consistent with an increase in the importance of uncertainty about future economic activity in driving investor asset allocation decisions. Shifts in US monetary policy regimes have been associated with reduced stock-bond yield correlations, although it is difficult to distinguish between the impact of recent unconventional monetary policies and the economic developments that have underpinned such policies.
Footnotes
Muhummed Shah Idil is from International Department and Ewan Rankin completed this work while in International Department. [*]
We generally depict stock-bond correlations based on monthly changes over a rolling three-year window. A similar historical pattern is observed at alternative frequencies and windows. [1]
The impact of uncertainty about growth on the term premium is not well established but the literature suggests that the term premium falls as uncertainty about growth increases, consistent with the ‘flight-to-safety’ phenomenon (Dick, Schmeling and Schrimpf 2013). [2]
Existing work lends further support to this view: Ilmanen (2003) posits that changes in the common interest rate factor tend to dominate stock and bond volatility during periods of high inflation, while Li (2002) finds that high inflation and inflation volatility often results in strong negative stock-bond correlations. [3]
Similarly, Connolly, Stivers and Sun (2005) find that correlations between stock and bond returns tend to approach zero when the VIX index of expected US equity market volatility is high, while Gulko (2002) finds evidence between 1987 and 2000 that stock-bond correlations tend to swap from negative to positive following stock market crashes. Andersson et al (2008) also suggests that at times of elevated uncertainty, non-fundamental (and uncorrelated) changes in asset prices may be more likely. [4]
Since the global financial crisis, foreign investors' net purchases of US Treasuries have had a modest positive correlation with the VIX index, indicative of fluctuations in safe-haven demand. In contrast, a negative correlation was observed over much of the two decades prior. Foreign net purchases of US equities have, if anything, become more negatively correlated with the VIX index since the financial crisis. [5]
Duarte and Rosa combine information from 20 models to show that the equity risk premium has trended upwards from its 2000 trough to a 50-year high in July 2013. However, we remain cautious about these estimates due to the well-known uncertainties about the equity risk premium and its estimation, as characterised by Mehra and Prescott (1985). [6]
References
Andersson M, E Krylova and S Vähämaa (2008), ‘Why Does the Correlation between Stock and Bond Returns Vary over Time?’, Applied Financial Economics, 18(2), pp 139–151.
Bernanke B (2013), ‘Long-term Interest Rates’, Speech at the Annual Monetary/Macroeconomics Conference, ‘The Past and Future of Monetary Policy’, sponsored by Federal Reserve Bank of San Francisco, San Francisco, 1 March.
Connolly R, C Stivers and L Sun (2005), ‘Stock Market Uncertainty and the Stock-Bond Return Relation’, Journal of Financial and Quantitative Analysis, 40(1), pp 161–194.
d'Addona S and AH Kind (2006), ‘International Stock– Bond Correlations in a Simple Affine Asset Pricing Model’, Journal of Banking and Finance, 30(10), pp 2747–2765.
D'Arcy P and E Poole (2010), ‘Interpreting Market Responses to Economic Data’, RBA Bulletin, September, pp 35–42.
Dick C, M Schmeling and A Schrimpf (2013), ‘Macro-Expectations, Aggregate Uncertainty, and Expected Term Premia’, European Economic Review, 58, pp 58–80.
Duarte F and C Rosa (2013), ‘Are Stocks Cheap? A Review of the Evidence’, Liberty Street Economics blog, 8 May. Available at <http://libertystreeteconomics.newyorkfed.org/2013/05/are-stocks-cheap-a-review-of-the-evidence. html>.
Gulko L (2002), ‘Decoupling’, The Journal of Portfolio Management, 28(3), pp 59–66.
Gürkaynak RS, B Sack and JH Wright (2006), ‘The US Treasury Yield Curve: 1961 to the Present’, Board of Governors of the Federal Reserve System Finance and Economics Discussion Series, No 2006–28.
Ilmanen A (2003), ‘Stock-Bond Correlations’, The Journal of Fixed Income, 13(2), pp 55–66.
Krishnamurthy A and A Vissing-Jorgensen (2013), ‘The Ins and Outs of LSAPs’, in Global Dimensions of Unconventional Monetary Policy, A Symposium held by the Federal Reserve Bank of Kansas City, Jackson Hole, pp 57–111.
Li L (2002), ‘Macroeconomic Factors and the Correlation of Stock and Bond Returns’, Yale International Center for Finance Working Paper No 02–46.
Markowitz HM (1952), ‘Portfolio Selection’, Journal of Finance, 7(1), pp 77–91.
Mehra R and EC Prescott (1985), ‘The Equity Premium: A Puzzle’, Journal of Monetary Economics, 15(2), pp 145–161.
Sharpe WF (1964), ‘Capital Asset Prices: A Theory of Market Equilibrium under Conditions of Risk’, Journal of Finance, 19(3), pp 425–442.
Shiller RJ and AE Beltratti (1992), ‘Stock Prices and Bond Yields: Can Their Comovements be Explained in Terms of Present Value Models?’, Journal of Monetary Economics, 30(1), pp 25–46.