Bulletin – December 2009 Indicators of Business Investment[1]
- Download 201KB
Introduction
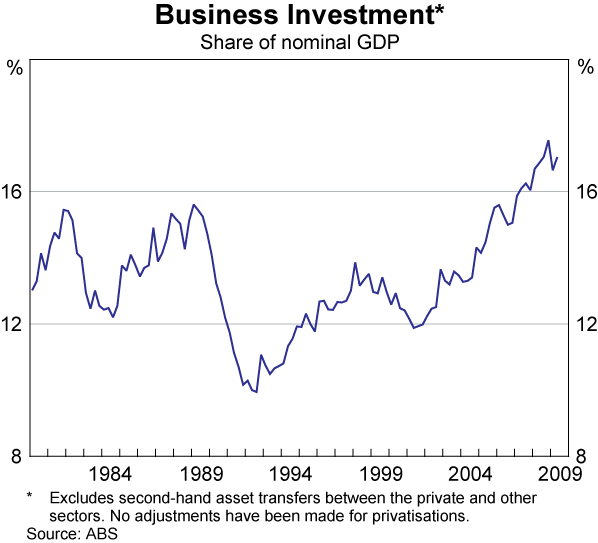
Business investment in Australia has grown rapidly over recent years, rising from 12 per cent of gross domestic product (GDP) in 2001 to 17 per cent in 2009 (Graph 1). Business investment has traditionally been a key driver of the business cycle in Australia and abroad, rising strongly during periods of firm economic growth and falling sharply during downturns. By expanding the supply capacity of the economy, investment also affects an economy's long-term growth rate. This article highlights some of the factors that affect the level of investment and discusses the various indicators that Reserve Bank (RBA) staff use in assessing near-term and medium-term investment prospects.
Indicators of the Medium-term Outlook for Investment
In the medium term, investment decisions are driven by current and expected profitability and the cost and availability of funds. These factors are highlighted in the neoclassical model of investment, which predicts that firms invest until the declining marginal product of capital equals the cost of capital, with firms more likely to invest the higher is the price at which the expected output can be sold, and the lower is the cost of funds. Expected profitability is also highlighted as a factor influencing investment decisions by Tobin's ‘q’ models, in which firms are assumed to invest in projects if shareholders value those projects at more than their cost.[2]
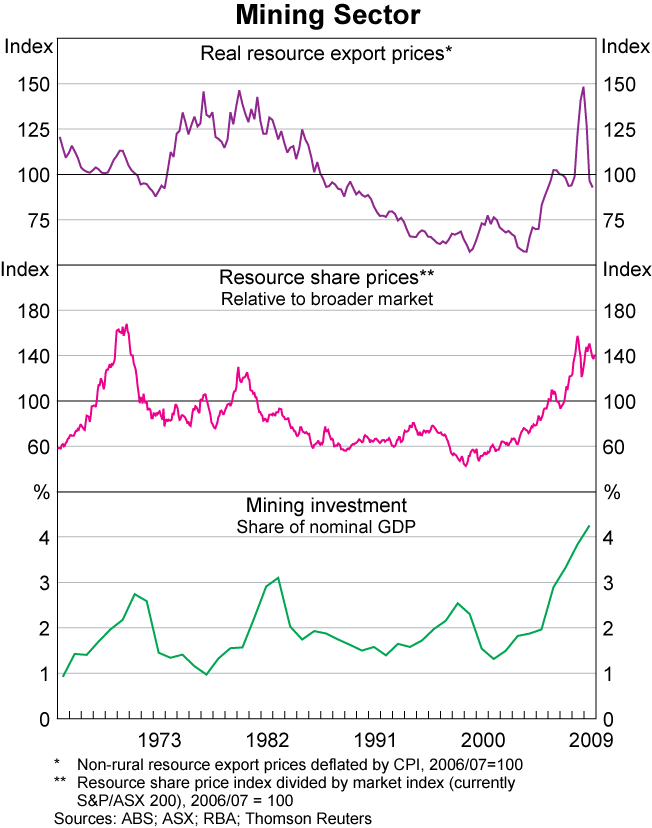
The importance of expected profitability as the main driver of investment is illustrated by recent developments in the mining sector (Graph 2). Over the past decade, real resource export prices have risen considerably and are widely expected to remain at relatively high levels in the medium term, supported by strong demand for commodities from Asia. This has significantly raised profitability in the mining sector and the expected rate of return on investment, and underpinned a large increase in the ratio of resource share prices to those of the broader market. As a result, mining investment has increased from around 1½ per cent of GDP in 2000/01 to over 4 per cent of GDP in 2008/09.
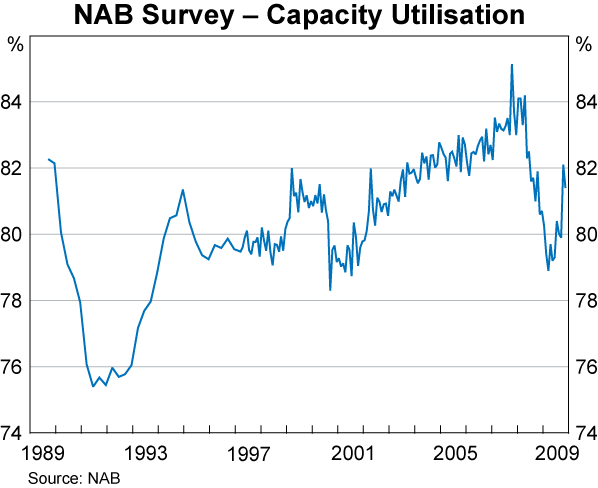
Periods with high levels of capacity utilisation also tend to be associated with strong investment, as occurred over the period from 2004 to 2008, when survey measures of capacity utilisation were at relatively high levels (Graph 3). One way that capacity utilisation can affect investment is through firms' profitability, since the strength of aggregate demand relative to supply tends to push up output prices.
The availability of funds – from retained earnings, debt or equity issuance – is also a factor influencing investment activity.[3] Strong share prices can make it more attractive for firms to issue new equity for investment, while retained earnings can also be used to directly fund investment. For example, the large increase in mining investment seen in the past few years has been largely funded out of the increased retained earnings generated from higher commodity prices.[4] More broadly, since much of business investment is funded through debt, the cost and availability of debt can also have an important influence on investment decisions. For example, a key feature of the current and some previous downturns has been the difficulty faced by commercial property developers in gaining access to finance.
Survey Measures of Investment Intentions
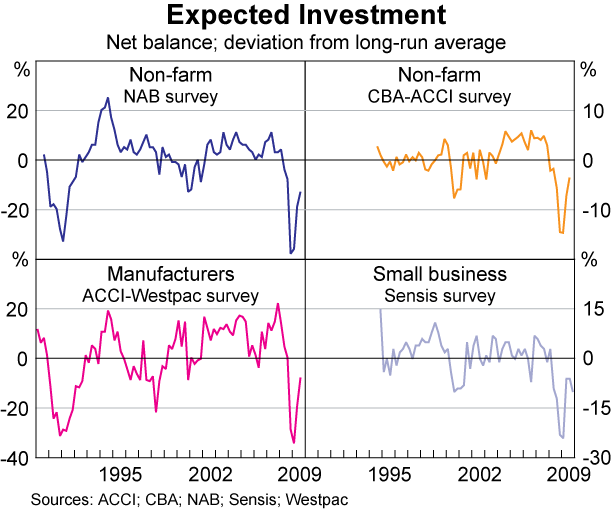
While the factors discussed above provide some indication of the macroeconomic influences on investment, several of the private-sector business surveys provide a timely source of information on whether firms are planning to increase or decrease their investment spending in the near term (Graph 4).[5] The responses in these surveys suggest that investment intentions tend to move closely with measures of business confidence and can be volatile from quarter to quarter. Unfortunately, for forecasting purposes these surveys do not give a precise sense of the timing of future investment, nor do they weight the firms in the sample by the value of their investment. As a result, large investment projects in the mining and transport sectors are likely to be underweighted.
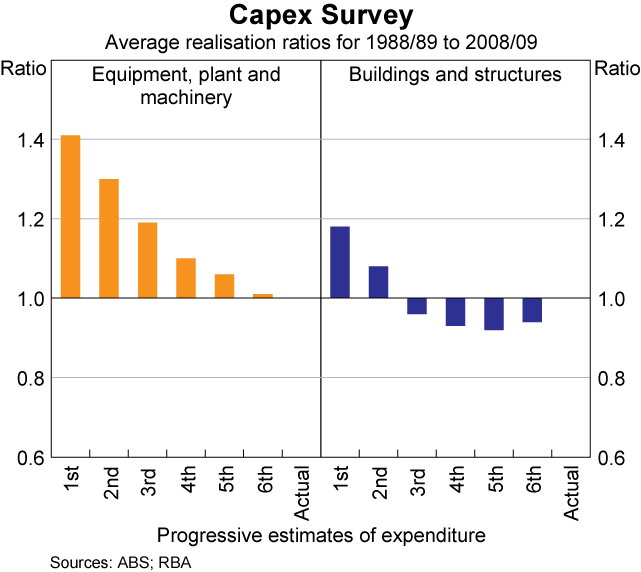
In contrast, the Australian Bureau of Statistics' (ABS) quarterly Survey of New Capital Expenditure (capex survey) provides information on the timing of investment that can be used more directly to quantify firms' investment intentions. The survey includes questions on firms' nominal capital expenditure plans over the next financial year and the remainder of the current financial year. The expectations for a particular financial year are surveyed at a quarterly frequency from around six months prior to the start of the year, providing seven progressive estimates of expenditure. However, the interpretation of these expectations data is not straightforward, as historically there have been systematic differences between these expectations and actual outcomes. One way to illustrate this is to look at realisation ratios, which are ratios of actual expenditure to expected expenditure calculated once the financial year in question has ended. On average, the realisation ratios for the first estimates of expenditure are around 1.4 for equipment, plant and machinery (i.e. actual expenditure is around 40 per cent higher than initially expected) and 1.2 for buildings and structures. This reflects the tendency for firms to understate future capital expenditure by including only projects about which they are certain in their reported expectations and not possible projects, with many small businesses in particular not reporting any expected expenditure (Graph 5) (Burnell 1994). Interestingly, on average the realisation ratios for building and structures are below 1 by the third estimate (surveyed at the beginning of the financial year), possibly reflecting systematic over-optimism about the speed of construction and the absence of delays.
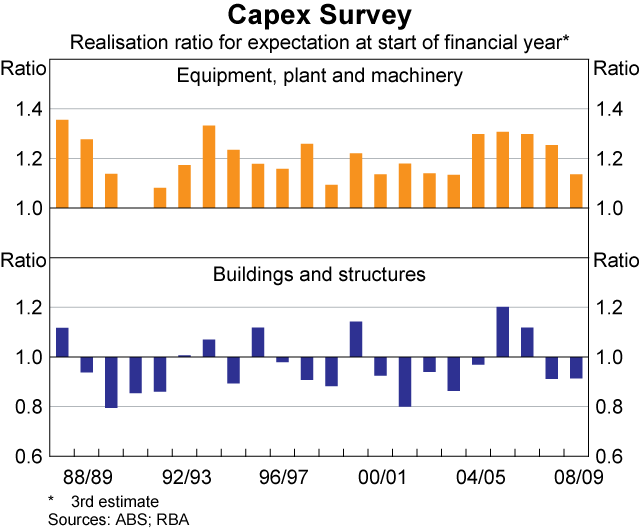
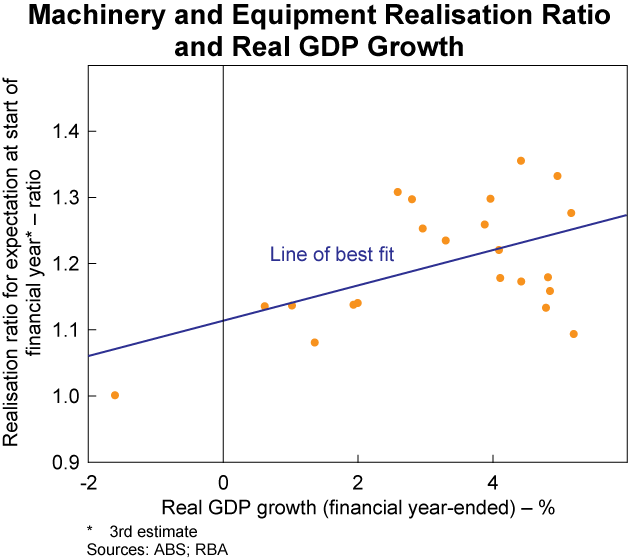
To improve the forecasting performance of the capex survey, the reported investment expectations can be adjusted using the past realisation ratios to control for the tendency for firms on average to underestimate or overestimate expenditure. However, realisation ratios vary significantly from year to year, particularly for building and structures, They also move with the economic cycle, with firms more likely to underestimate their expenditure in years when GDP growth turns out to be strong, and to overestimate expenditure when GDP growth is weak (Graphs 6 and 7). While a five-year average realisation ratio has often been used by both the ABS and market analysts to adjust these expectations, this method tends to perform poorly around turning points in the economic cycle, and the ABS does not consider this to be a reliable approach (ABS 2009). However, there is some evidence that private-sector business surveys reflect changes in firms' investment plans earlier than the responses to the capex survey, which suggests that these surveys can be combined with the capex survey expectations to produce more accurate forecasts that take the stage of the economic cycle into account. One approach along these lines is to estimate simple equations that explain realisation ratios by a measure of business conditions and previous years' realisation ratios. When such adjustments are made, capex expectations contain some useful information for forecasting investment, although unsurprisingly the expectations become less accurate as the forecast horizon lengthens.
To supplement the expectations provided in the capex survey, RBA staff also closely monitor the pipeline of investment projects compiled by entities such as Access Economics and the Australian Bureau of Agricultural and Resource Economics. These lists have been dominated by large engineering projects in recent years, particularly in the resources sector, which have long lead times. Information provided by the RBA's liaison with businesses is also useful for monitoring key projects. The RBA's liaison program covers a variety of topics (including capital expenditure) directly with firms at regular frequencies, providing an additional and timely source of regional and industry-specific information.
Indicators of Near-term Business Investment
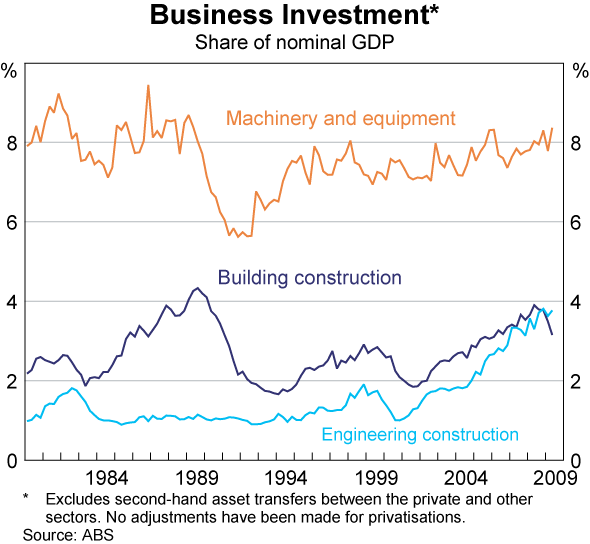
While the most comprehensive data on actual investment are published by the ABS in the quarterly national accounts, RBA staff monitor a range of indicators on an ongoing basis to gauge the current pace of business investment growth and the near-term outlook. These indicators for each of the key components of business investment – machinery and equipment, building construction and engineering construction – are discussed below (the main indicators are listed in Appendix Table A1). Although the latter two categories represent smaller shares of business investment than machinery and equipment, they are subject to particularly pronounced cycles and, as a result, have tended to drive the overall cycles in business investment. These cycles have tended to vary between the components of business investment, with building construction generally reflecting conditions in the commercial property market, while engineering construction is dominated by developments in the mining sector (Graph 8).
Machinery and equipment
Machinery and equipment is the largest component of business investment, averaging around 8 per cent of GDP over recent years. This category includes transport equipment such as motor vehicles and aircraft, along with computers, electrical equipment and industrial machinery (Table 1). Machinery and equipment investment is relatively volatile from quarter to quarter, in part reflecting the timing of expenditure on large items such as civil aircraft.
Timely indicators of current machinery and equipment spending include motor vehicle sales and capital imports. Motor vehicle sales to businesses represent around one-quarter of machinery and equipment investment and data on motor vehicle sales are available shortly after the end of each month. Imports of capital goods are an indicator of the supply of machinery and equipment, representing around one-half of the value of machinery and equipment investment by business.
| Share of GDP | Share of component(b) | |
|---|---|---|
| Machinery and equipment | 7.7 | 100 |
| – Industrial | 32 | |
| – Motor vehicles | 26 | |
| – Computers | 13 | |
| – Electrical and electronic | 10 | |
| – Other | 18 | |
| Building | 3.4 | 100 |
| – Offices | 29 | |
| – Retail and wholesale | 22 | |
| – Industrial | 19 | |
| – Health and education | 13 | |
| – Other | 18 | |
| Engineering | 3.5 | 100 |
| – Mining and heavy industry | 53 | |
| – Transport infrastructure | 18 | |
| – Utilities | 16 | |
| – Telecommunications | 8 | |
| – Other | 5 | |
| Intellectual property | 2.5 | 100 |
| – Research and development | 1.1 | 42 |
| – Computer software | 0.9 | 35 |
| – Mining exploration | 0.5 | 19 |
| – Artistic originals | 0.1 | 4 |
| Cultivated resources | 0.2 | |
| Total business investment | 17.5 | |
|
(a) Excludes second-hand asset transfers between the private and other sectors.
No adjustments have been made for privatisations. Sources: ABS, RBA |
||
Building construction
Building investment is currently around 3½ per cent of GDP and includes the construction of commercial and industrial buildings such as offices, warehouses and shopping centres, as well as educational, health and entertainment facilities (Table 1).
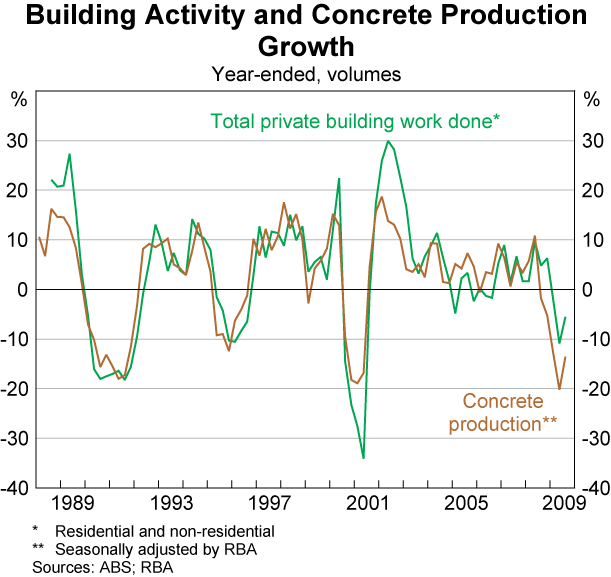
Over several decades, monthly data on pre-mixed concrete has been a good coincident indicator of the level of building investment, since concrete is an important input into building construction and must be used shortly after production (Graph 9).
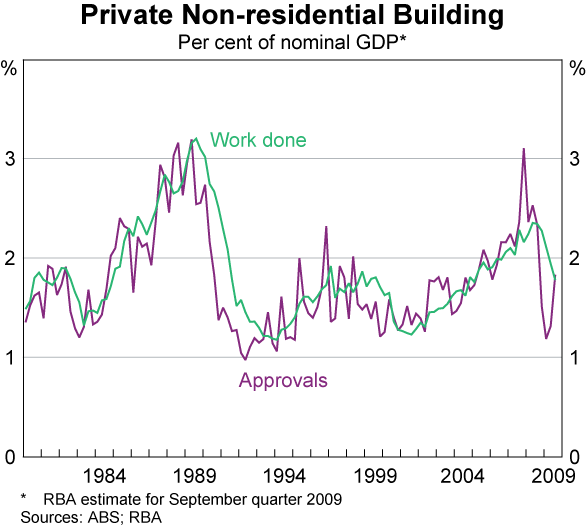
The ABS also publishes data on some leading indicators of building construction, such as the value of building approvals and commencements. However, building approvals are very volatile and subject to revision (Graph 10). Nevertheless, econometric modelling can be used to estimate the rate at which building approvals progress to construction work; a majority of building projects commence shortly after an approval is issued and around half of the work on projects is typically completed within one year of approval.
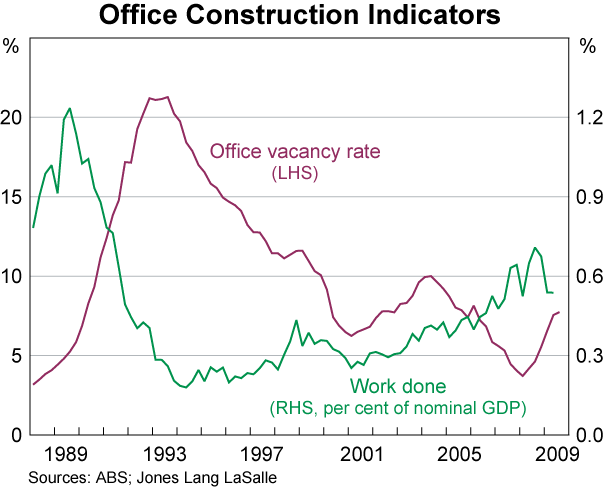
Aside from the data provided by the ABS, other organisations such as Jones Lang LaSalle, the Property Council of Australia and Savills Research provide information about conditions in Australia's commercial property sector, including vacancy rates, property prices and rents. The construction cycle has tended to be inversely related to vacancy rates, with lower vacancy rates generally associated with more construction activity; this relationship has been most pronounced in office building (Graph 11).
Engineering construction
Over 2005 to 2008, private engineering investment grew strongly, with more than half of this investment occurring in the mining sector, largely in response to the demand for commodities from Asia. There has also been an increase in investment in transport infrastructure, such as railways and harbours to service the mining sector over recent years. The remainder of engineering investment includes spending on roads, utilities and telecommunications.
There are relatively few official indicators of engineering investment and even fewer of these are provided at a high frequency. Data on commencements are available on a quarterly basis but have tended to be volatile, reflecting the inherently lumpy nature of engineering projects, and are subject to revision as information on the commencement of significant projects outside the survey sample becomes available (Graph 12).
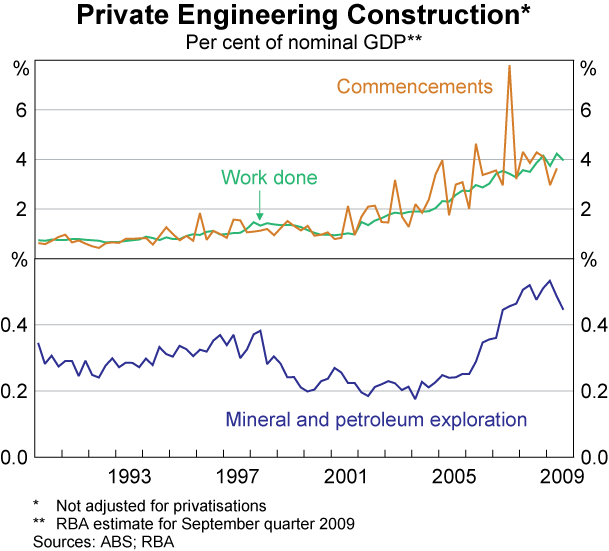
Another indicator is the level of mining exploration, which tends to help predict mining engineering investment. During previous cycles in engineering construction, significant downturns have tended to be preceded by falls in exploration expenditure. RBA liaison with mining and engineering companies also provides useful information about the scale and timing of future engineering expenditure plans.
Conclusion
The share of business investment in GDP is high in Australia compared to that in other advanced economies, and has been relatively resilient during the recent global downturn. In particular, mining investment has continued to grow strongly, supported by the ongoing demand for commodities from Asia. Given the importance of investment in driving the dynamics of business cycles and in expanding the supply side of the economy, trends in investment are monitored closely by the RBA. In doing so, RBA staff take account of macroeconomic factors that influence the medium-term outlook for investment, and examine a range of specific investment indicators, including business surveys and partial indicators of machinery and equipment expenditure and construction activity. The RBA's business liaison program provides an additional and timely source of information on firms' investment intentions.
Appendix
| Source | Frequency | Release relative to end of quarter | |
|---|---|---|---|
| Machinery and equipment | |||
| – National accounts | ABS | Quarterly | 9 weeks after |
| – Capex survey | ABS | Quarterly | 8 weeks after |
| – Capital imports | ABS | Monthly | 3 weeks after |
| – Motor vehicle sales to business | Federal Chamber of Automotive Industries | Monthly | 3 days after |
| Non-residential building | |||
| – National accounts | ABS | Quarterly | 9 weeks after |
| – Work done | ABS | Quarterly | 8 weeks after |
| – Approvals | ABS | Monthly | 4–5 weeks after |
| – Commencements | ABS | Quarterly | 3½ months after |
| – Concrete production | ABS | Monthly | 3 weeks after |
| – Commercial property vacancy rates | Jones Lang LaSalle | Quarterly | 3–4 weeks after |
| – Office property vacancy rates | Property Council of Australia | Semi-annual | 6 weeks after |
| Engineering | |||
| – National accounts | ABS | Quarterly | 9 weeks after |
| – Work done | ABS | Quarterly | 8 weeks after |
| – Commencements | ABS | Quarterly | 3 months after |
| – Mineral and petroleum exploration | ABS | Quarterly | 10 weeks after |
| Business surveys | |||
| – Expected investment | NAB Quarterly Business Survey | Quarterly | 4 weeks after |
| – Expected investment | CBA-ACCI Business Expectations Survey | Quarterly | 5 weeks after |
| – Expected investment | ACCI-Westpac Survey of Industrial Trends | Quarterly | 1–2 weeks before |
| – Expected investment | Sensis Business Index | Quarterly | 2–3 weeks before |
|
Source: RBA |
|||
Footnotes
This article was prepared by Ellis Connolly and James Glenn of Economic Analysis Department. [1]
The neoclassical model of investment was outlined in Jorgenson (1963) and Hall and Jorgenson (1967). For more detail on the ‘q’ model, see Tobin (1969) and Hayashi (1982). [2]
This relationship has been empirically examined for Australia in La Cava (2005) and Cockerell and Pennings (2007). For an analysis of recent trends in Australian corporates' sources and uses of funds, see Black, Kirkwood and Shah Idil (2009). [3]
For more details on the effect of mining profitability on investment, see Connolly and Orsmond (2009). [4]
Respondents to the NAB and ACCI-Westpac surveys are asked what they expect to happen to capital expenditure over the next 12 months, while the CBA-ACCI survey focuses more on firms' capital expenditure in the near term. The ACCI-Westpac and CBA-ACCI surveys both ask for expectations on machinery & equipment and building & structures separately, with the average of these responses used in Graph 4. [5]
References
ABS (Australian Bureau of Statistics) (2009), ‘The Application of Realisation Ratios to the Survey of New Capital Expenditure’, Private New Capital Expenditure and Expected Expenditure – Australia, ABS Cat No 5625.0, September Quarter, pp 10–14.
Black S, J Kirkwood and S Shah Idil (2009), ‘Australian Corporates' Sources and Uses of Funds’, RBA Bulletin, October, pp 1–12.
Burnell D (1994), ‘Predicting Private New Capital Expenditure Using Expectations Data’, Australian Economic Indicators, ABS Cat No 1350.0, January, pp xi–xviii.
Cockerell L and S Pennings (2007), ‘Private Business Investment in Australia’, RBA Research Discussion Paper No 2007-09.
Connolly E and D Orsmond (2009), ‘The Level and Distribution of Recent Mining Sector Revenue’, RBA Bulletin, January, pp 7–12.
Hall RE and DW Jorgenson (1967), ‘Tax Policy and Investment Behavior’, American Economic Review, 57(3), pp 391–414.
Hayashi F (1982), ‘Tobin's Marginal Q and Average Q: A Neoclassical Interpretation’, Econometrica, 50(1), pp 213–224.
Jorgenson DW (1963), ‘Capital Theory and Investment Behavior’, American Economic Review, 53(2), pp 247–259.
La Cava G (2005), ‘Financial Constraints, the User Cost of Capital and Corporate Investment in Australia’, RBA Research Discussion Paper No 2005-12.
Tobin J (1969), ‘A General Equilibrium Approach to Monetary Theory’, Journal of Money, Credit and Banking, 1(1), pp 15–29.