Speech Whither Securitisation?

Guy Debelle [1]
Assistant Governor (Financial Markets)
Address to the Australian Securitisation Conference 2009
Sydney –
Let me start by pointing out that there is an important ‘h’ in the title of my speech. Despite its current travails, I do not expect securitisation to wither (with only one h) and die on the vine, rather the question I am posing today is: what role will securitisation play in financial markets going forward? Hence whither (with two hs) securitisation?
My answer to the question is that the future is looking brighter for securitisation, but I would not expect a return to the heady days of earlier this decade. However, before addressing the question in more detail, it is useful to recount how we got to this point.
1. Development of the Australian securitisation market
In June 2007, just prior to the onset of the crisis, asset-backed securities (ABS) accounted for 30 per cent of the Australian bond market, with around $280 billion of securities on issue. The market had experienced rapid growth of nearly 30 per cent per annum since 2000, considerably faster than most other parts of the bond market.
Residential mortgage-backed securities (RMBS) comprised the majority of Australian ABS, accounting for over 60 per cent of the stock outstanding (Table 1). Collateralised debt obligations (CDOs, 6 per cent) and commercial mortgage-backed securities (CMBS, 4 per cent) and other ABS (mostly backed by leases, receivables and motor vehicle loans, 3 per cent) made up the remainder of longer-dated securities. The asset-backed commercial paper (ABCP) market – which has a maturity of less than a year – was around $68 billion, most of which was backed by residential mortgages and RMBS. A sizeable share of this was mortgages sitting in warehouses waiting to be packaged together and sold.
| Outstanding ($ billion) | Share (per cent) | Annual growth (per cent) | ||||||
|---|---|---|---|---|---|---|---|---|
| Jun 2007 |
Oct 2009 |
Jun 2007 |
Oct 2009 |
Jun 2000 – Jun 2007 |
Jun 2007 – Oct 2009 |
|||
| RMBS | 176 | 102 | 63 | 66 | 27 | −21 | ||
| CMBS | 12 | 7 | 4 | 4 | 78 | −23 | ||
| CDOs | 18 | 10 | 6 | 6 | 44 | −22 | ||
| ABCP Of which: Residential mortgages** |
68 | 30* | 24 | 19 | 91 | −29 | ||
| 42 | 22 | |||||||
| Other ABS*** | 9 | 8 | 3 | 5 | 17 | −3 | ||
| Total | 283 | 157 | 100 | 100 | 29 | −22 | ||
* Latest value is for August 2009, corresponding share and growth rate
are calculated using these data Sources: RBA, S&P |
||||||||
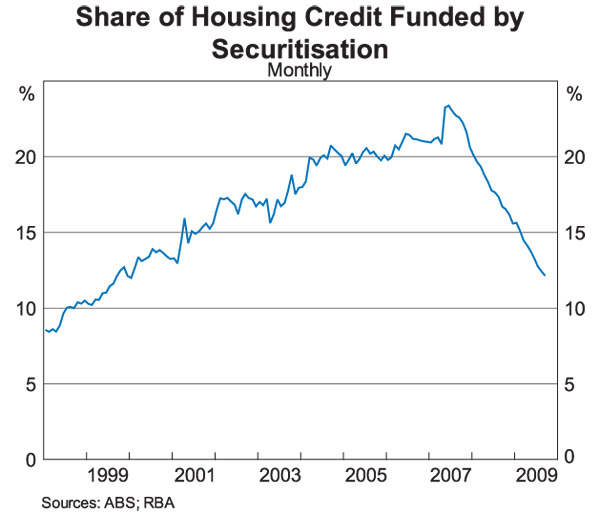
The rapid growth in securitisation reflected the strong demand for housing finance. However, this is not the full story, as the stock of securitised housing loans grew at a faster pace than aggregate housing credit. The share of housing loans funded through securitisation increased from less than 10 per cent in the late 1990s to a peak of almost 25 per cent in mid 2007 (Graph 1).
In large part, the growth of securitisation reflected the change in the composition of lenders in the mortgage market following the entry of mortgage originators, who relied predominantly on securitisation for funding. Mortgage originators came to prominence in the mid 1990s, in part because the decline in the general level of interest rates reduced the banks' competitive advantage of being able to raise low-cost retail deposits. With mortgage interest rates high relative to capital market interest rates, funding mortgage lending in the wholesale market was very profitable. Reflecting these developments, mortgage originators accounted for around 35 per cent of RMBS issuance prior to the recent turmoil in credit markets (Graph 2).
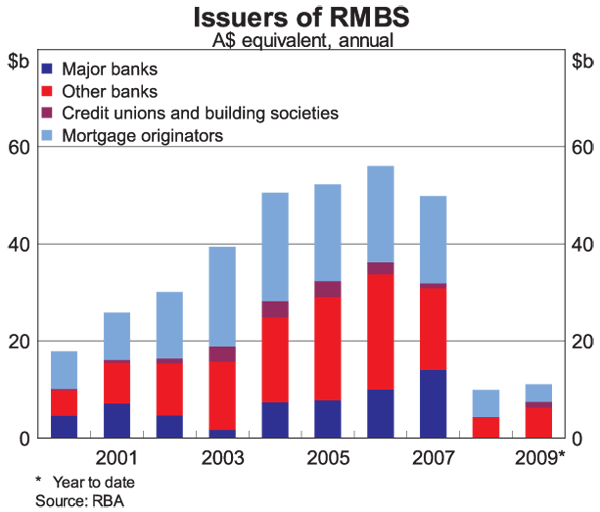
The banks themselves also used securitisation as a funding source whenever it was cost effective to do so. In the case of the smaller regional banks and some building societies and credit unions, securitisation was an important means of funding. Prior to mid 2007, regional banks securitised around one-third of their housing loans while the major banks securitised less than 10 per cent. As a result, despite their smaller size, the regional banks accounted for roughly 40 per cent of RMBS issuance whereas the major banks accounted for 20 per cent.
Demand from domestic and non-resident investors for RMBS was very strong in the years leading up to the credit market turmoil, supporting the robust growth in the market. This was evident in the steady decline in spreads to swap on AAA-rated prime RMBS at issuance from around 40 basis points in 2000 to less than 20 basis points in mid 2007.
At least one-third of the investors in Australian RMBS were offshore structured investment vehicles, the now notorious SIVs. These entities funded themselves with short-dated paper, of less than 365 days, to purchase longer-dated assets such as RMBS, in large part to arbitrage capital rules. They were, in theory at least, off-balance sheet vehicles, back-stopped by credit lines from their parent financial institutions.
2. The crisis
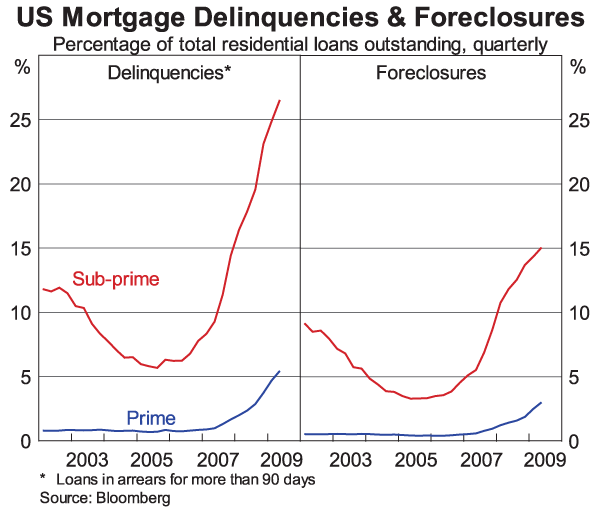
Beginning around the middle of 2007, there was a widespread reappraisal of the risks associated with investing in structured credit products. Securitisation started to suffer severe brand damage as primarily US RMBS incurred significant credit problems as delinquency rates began to rise. Initially, the problems were most evident in the sub-prime mortgage market, but as Graph 3 shows, delinquency rates have risen to historically high levels on prime mortgages too. Combined with the decline in house prices, these delinquency rates have translated into sizeable losses for investors in US RMBS.
The damage was further exacerbated by the opaqueness of many of the complicated security structures. This was particularly true in the case of CDOs of various powers (that is squared, cubed …) which sliced and diced the underlying mortgages until they were often unrecognisable.
The combination of these factors has seen enormous losses incurred by US and euro area banks from their holdings of mortgage-backed securities (Table 2). These losses have occurred despite the fact that securitisation was supposed to get the loans off bank balance sheets. They ended up back on the books, in large part because the banks had to bail out their SIVs.
| Residential mortgage |
Consumer | Commercial mortgage |
Corporate | Foreign | |
|---|---|---|---|---|---|
| US banks | 189 | 0 | 63 | 48 | 71 |
| Euro area banks | 130 | 5 | 62 | 22 | 113 |
| UK banks | 27 | 4 | 12 | 25 | 39 |
Source: IMF |
|||||
The Australian RMBS market was tarred with the same brush despite the absence of these issues of transparency and overly complex securities and their continued strong performance (see below). As Andre Agassi used to say ‘Image is everything’, and the image of securitisation was, and to a large extent still is, very much on the nose.
Issuance of RMBS in Australia dried up as it did around the world, as demand fell away. Investors felt they were already too full of structured products and had no appetite for any more. Spreads in the secondary market widened considerably. Indeed, at times, there was no secondary market, with plenty of sellers but no buyers at any price.
This oversupply in the secondary market was exacerbated by the forced liquidation of the portfolios of the offshore SIVs. Australian RMBS were sold, not because of any intrinsic problem with them, but because the SIVs were no longer able to fund themselves. Australian RMBS thus suffered collateral damage (so to speak) on a number of fronts, even though the collateral on which they were based remained perfectly sound.
There were some new issues during the first year of the financial crisis, but the market came to a complete halt late last year. Reflecting these developments, the Government announced a support program for the industry whereby it would purchase $8 billion of new issues through the Australian Office of Financial Management (AOFM). That program has all but been completed.
3. Australian RMBS are high quality
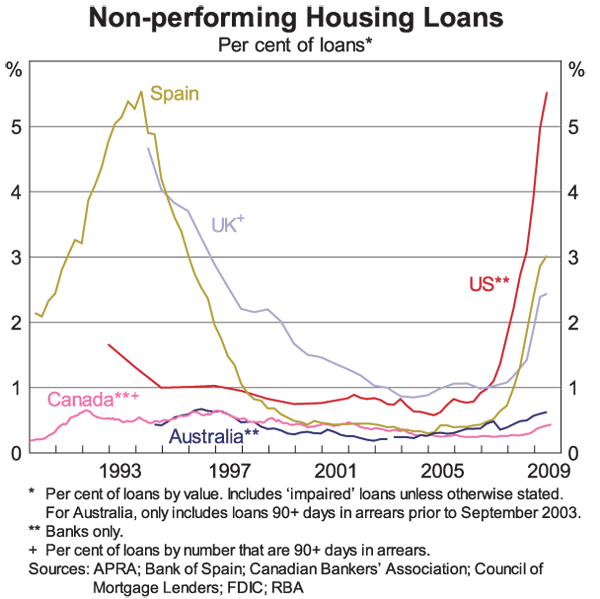
The lack of new issuance and elevated spreads in the secondary market did not reflect concerns about the credit quality of Australian RMBS. Unlike in the US, the credit quality of Australian RMBS has remained at the highest level throughout the financial crisis. An international comparison of non-performing housing loans, using on-balance sheet exposures, highlights the non-performing share in Australia, at less than 1 per cent, is extremely low (Graph 4). And over this year, the arrears rate for Australian RMBS has actually been declining slightly (Graph 5).
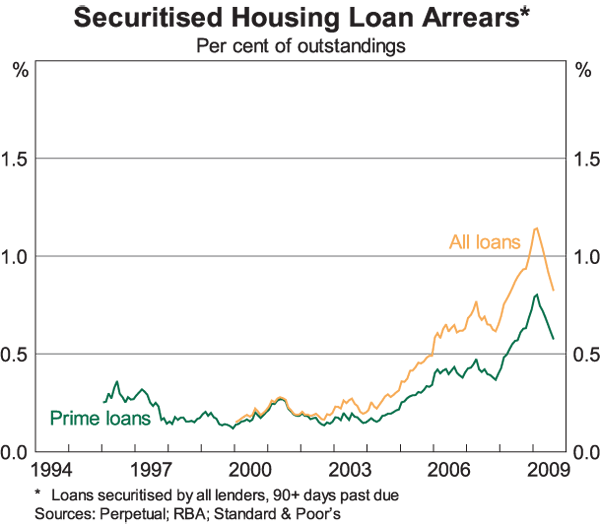
The continued strong performance of Australian RMBS reflects both the quality and the composition of the types of loans securitised, which has been underpinned by the strength of the Australian economy, particularly the relatively low unemployment rate, robust household income growth, as well as low interest rates. The underlying sound condition of household balance sheets in Australia has helped limit the incidence of household financial difficulties during the economic downturn.
The bulk of Australian RMBS are backed by prime loans – loans made to borrowers that satisfy financial institutions' standard lending criteria – making up 97 per cent of the market (Graph 6). Nearly all loans made by banks, building societies and credit unions, as well as most loans made by mortgage originators, fall into this category. In addition, almost all prime RMBS are covered by lenders' mortgage insurance (LMI). This provides investors in RMBS with protection against losses by making good any shortfall if a property sale raises insufficient funds to cover the loan in default.
Within the prime loan category, most are full-doc, with low-doc loans (for which a more relaxed standard of proof of borrowers' debt-servicing ability applies) accounting for around 10 per cent of prime loans. Arrears on prime full-doc loans remain very low at around ½ per cent of outstanding loans. While arrears on prime low-doc loans are elevated compared to history, they have trended down over 2009 to be less than 2 per cent. Despite the higher arrears rate, historically losses on low-doc loans are contained by the fact that these loans have lower loan-to-valuation ratios, meaning that the borrower has a greater incentive to avoid foreclosure and in the case it does eventuate, the losses to the lender are smaller.
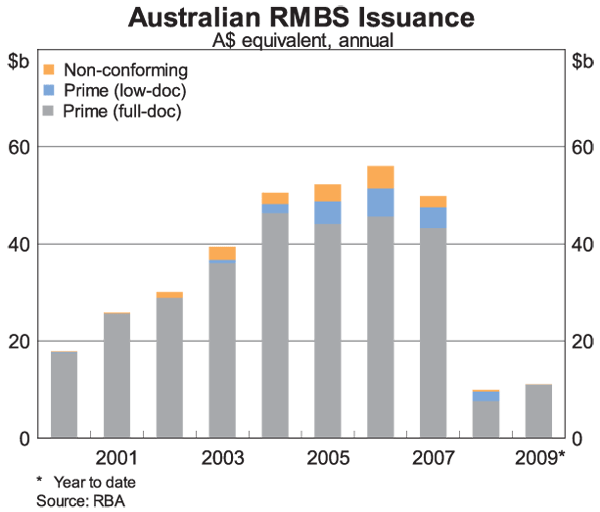
Non-conforming loans are the closest equivalent to the sub-prime loans in the US, being provided to borrowers who do not satisfy the standard lending criteria of mainstream lenders such as those with impaired or incomplete credit histories. The loans are provided by a few specialist non-deposit-taking lenders. This is in contrast to the US where sub-prime loans were provided by a wide range of financial institutions. Non-conforming loans make up only 3 per cent of Australian RMBS outstanding, compared to around 10 per cent of US mortgages outstanding. The arrears rate on Australian non-conforming loans is higher than for prime loans, at around 6 per cent (though the margin charged on these loans is also higher, reflecting the higher risk nature of these loans), though it too has eased so far this year and is significantly below the arrears rate on sub-prime loans in the US (at over 25 per cent). Moreover, the spread charged on non-conforming loans is more than enough to compensate for the higher loss rate.
As well as the difference in current economic conditions, the lower arrears rate on Australian non-conforming loans compared to US sub-prime loans also reflects differences in the loans' structural features prior to the financial crisis. As I've pointed out in an earlier speech:
- Australian non-conforming loans had a less risky structure than US sub-prime loans, evident in lower loan-to-valuation ratios.
- Australian non-conforming loans did not usually feature low introductory interest rate periods (teaser rates) or high-risk repayment options (such as negative amortisation periods).
- Australian lenders typically retained (and continue to retain) the lowest-rated tranches of their RMBS or placed them with closely associated entities. I'll come back to this ‘skin in the game’ later.
- The Australian legal system gives a lender recourse to all of the borrower's assets in addition to the house in the event of default, which provides the borrower with a stronger incentive to repay their loan.
While losses (after the sale of property) on Australian RMBS have risen over the past year, they remain low as a share of loans outstanding, at less than 10 basis points per annum for prime loans and 125 basis points for non-conforming loans. The increase in losses has been confined to RMBS issued by mortgage originators, and even there, it is concentrated among a few issuers. Moreover, the losses continue to be mostly covered by credit enhancements including LMI and excess spread. Investors in rated tranches of Australian RMBS have never borne a loss of principal. In comparison, worldwide bank losses on securities' holdings are forecast by the IMF to amount to almost $US 1 trillion, or around 6 per cent of holdings.
Reflecting continued strong performance of Australian RMBS, very few structures have had downgrades to their AAA-rated tranches. Consequently the bulk of the Australian securitisation market continues to be very highly rated. While the subordinated tranches of many prime RMBS have been downgraded by a notch or two, this reflected downgrades of LMI providers whose ratings were lowered because of the large losses incurred by their US parents.[2] These downgrades did not result from any deterioration in the performance of securitised prime loans.
4. The current state of play
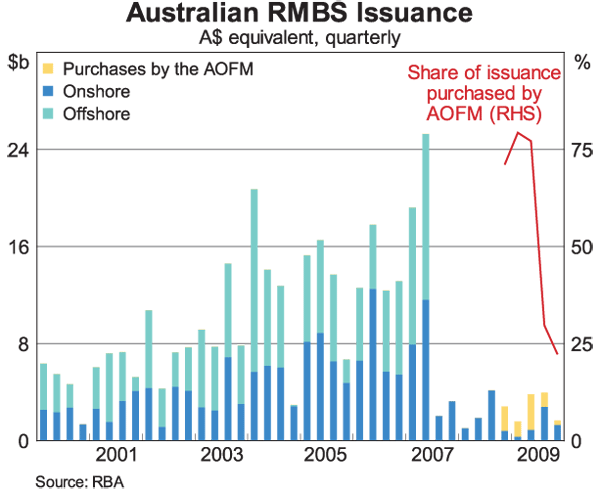
In recent months, conditions in Australian securitisation markets have improved markedly (Graph 7). For the first time in over a year, there were successful issues of RMBS without the support of the AOFM as well as several non-RMBS securitisations. Around $2.3 billion were issued through the three RMBS deals that were not sponsored by the AOFM, with a further $2 billion of securitisations of agricultural and construction equipment leases, auto loans and commercial property.
The increase in private investor demand is also noticeable in investor participation in AOFM-sponsored deals. As a cornerstone investor, the AOFM initially accounted for around 80 per cent of the investor base in those RMBS it supported. However, the AOFM's participation has decreased to around 40 per cent in recent issues, with private investors making up the remainder. In fact, of all RMBS issued in recent months (including those in which the AOFM did not participate), the AOFM has only purchased around 25 per cent. In a further sign of broadening investor demand, there was private investment in tranches other than the senior AAA tranche in recent AOFM-sponsored issues, an outcome that was not common with earlier issues. Many recent deals have also been oversubscribed and upsized from the initial guidance.
Pricing on RMBS also suggests conditions have improved. In primary markets, the AAA rated tranches of the prime RMBS issued over recent months that have involved the AOFM as a cornerstone investor have priced at 120–130 basis points above BBSW (bank bill swap reference rate), with deals that did not involve AOFM support pricing a little higher, at around 140–170 basis points. These latter spreads appear to be close to break-even levels. In Graph 8 below, I've included an estimate of the break-even spread based on a simple stylised scenario.
As many of you know, in a typical RMBS, a special purpose vehicle (SPV) receives income from the mortgage payments it receives; in this example here, I've used an estimate of the average mortgage rate on new loans, which is currently around 5½ per cent. The mortgage income is used to cover the SPV's funding costs (bank bill rate plus a spread) and other costs such as loan servicing (here assumed to be 50 basis points per annum). The higher the spread that the SPV needs to pay, the more likely it is that there will be a shortfall between the income it receives and the required payments. In the example here, the break-even spread is around 140 basis points, which is in the ballpark suggested by our market liaison, although different lenders are likely to have different cost structures. Note that the weighted-average interest rate on a mortgage pool varies quite a lot with the characteristics of the loans in the pool, with a low-doc loan having a higher lending rate and hence securitisation is economic at a higher spread.
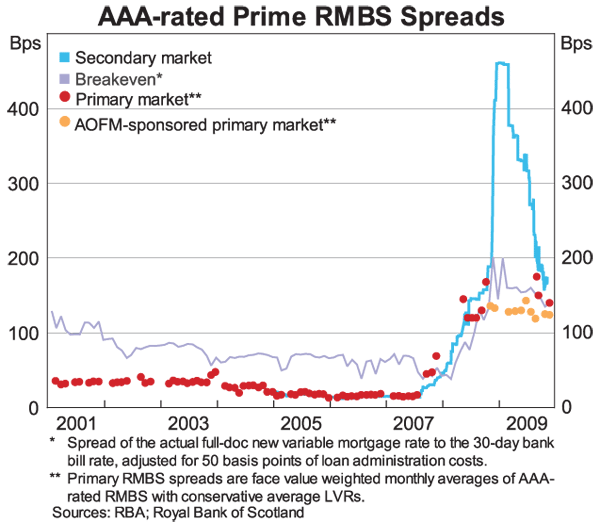
The increase in investor demand for RMBS in recent months has also been evident in a decline in secondary market spreads, which have fallen to be only a little above primary market spreads. The narrowing suggests that the market has worked through much of the overhang of supply in the secondary market created by the deleveraging of SIVs. The narrower margin between primary and secondary markets, as well as the ongoing amortisation of the existing stock of RMBS, suggests that a more broadly based pick-up in securitised issuance may not be too far off.
There have also been some encouraging signs in offshore markets. In the UK, there are some early indications of a market-led recovery, with two large deals issued recently. In the US, however, nearly all the RMBS that have been issued have been purchased by the Fed.
Reflecting the ongoing amortisation of principal (i.e. mortgage repayments), as well as a relatively low volume of issuance, the value of Australian RMBS outstanding has continued to fall, to around $100 billion, more than 40 per cent below its peak in June 2007 (Graph 9). RMBS outstanding offshore have declined by more (nearly 60 per cent) because there has been no offshore issuance, while paper outstanding onshore has fallen around 20 per cent. The AOFM's holdings amount to around 7 per cent of all Australian RMBS outstanding, and 13 per cent of the domestic market.
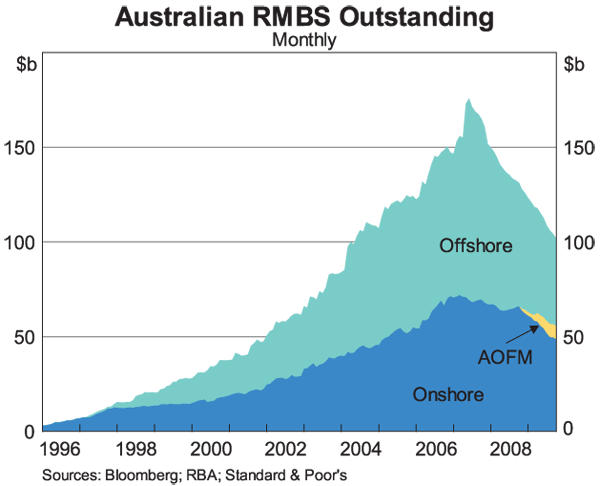
This decline in the stock of RMBS outstanding should be starting to create some holes in investors' portfolios, an issue to which I will return below.
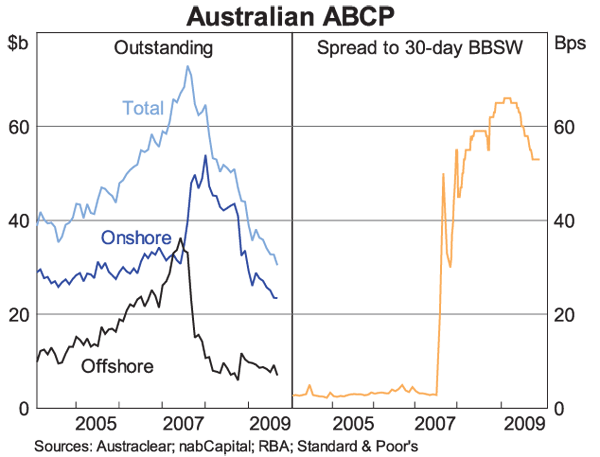
Conditions in short-term securitisation markets have also improved. While ABCP outstanding has roughly halved since its peak in mid 2007 (Graph 10), the pace of decline has eased in recent months. Some market participants report that they now have little difficulty rolling over paper, including at longer maturities. The improving conditions in the ABCP market have been reflected in declining spreads. Since their peak, spreads have fallen by around 15 basis points, to around 50 basis points above BBSW, and are now around the same level as in February 2008.
5. RBA holdings of RMBS
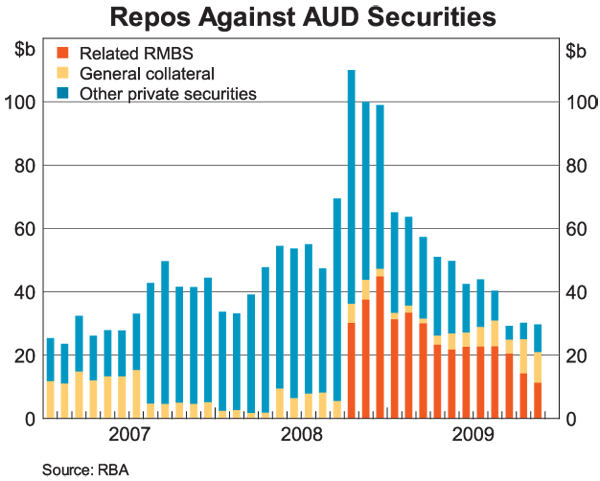
In October 2007, shortly after the onset of the financial market turmoil, the Reserve Bank expanded the range of securities it was willing to hold under repurchase agreements to include both RMBS and ABCP. As with other private securities (such as bank bills and certificates of deposit), the Bank was initially only willing to accept these securities from ‘unrelated’ parties. However, around the peak of the financial crisis in October 2008, the Bank relaxed the restriction on relatedness for both RMBS and ABCP as it sought to expand the range of funding options for financial institutions. In the subsequent months, the Bank purchased significant volumes of ‘internal’ securitisations under repo, with holdings peaking at around $45 billion around year-end.
Twelve months after the peak of the crisis, most financial institutions in Australia have better access to term funding in domestic and overseas markets. Consequently, the need for institutions to fund themselves using internal securitisations of mortgages has largely passed.
The Bank intends to maintain the broader range of securities that it accepts in its market operations, that is, internal RMBS will remain eligible collateral. To repeat, we are not going to wind back the pool of eligible collateral. However, with the improvement in funding conditions, we generally no longer expect or wish to see internal securitisations offered as collateral in our market operations on a regular basis. Given that many of these repos backed by RMBS were initiated over a year ago now, the Bank's holdings of related RMBS have shrunk considerably in recent months as these repos have matured (Graph 11).
6. Policy issues
As you'd be aware, policy-makers globally are considering initiatives that are intended to address issues that became more evident during the financial crisis, such as transparency and oversight of unregulated markets. The recommendations of the IOSCO Task Force on Unregulated Financial Markets and Products are some of the more relevant initiatives for securitisation. My colleague from ASIC, Greg Medcraft, will probably talk on these issues further, so I will just make some brief comments.
There has been much discussion about requiring originators/sponsors to retain a long-term exposure to assets they securitise – so-called skin in the game requirements. As I highlighted earlier, even before the financial crisis there was a tendency for many Australian securitisers, or related parties, to hold skin in the game. In the US, and some other markets, where the originate-to-distribute model was prevalent, there were some problems of incentives between originators and investors not being aligned, though this was not really the case with Australian RMBS. Nonetheless, to maintain an overseas investor base going forward, the Australian market may need to consider global standards.
Transparency and quality of information provided to investors are also issues that are high on policy-makers' radars. Clearly, disclosure of information to investors, such as the initial and ongoing performance of the asset pool and the creditworthiness of the borrowers of the underlying loans, is important. The Australian market should look to continue to provide good quality information such as this, and I note the Australian Securitisation Forum (ASF) has been doing some work in this area.
7. Whither Securitisation?
So, now having described where we are at the moment and how we got there, I will finally address the question of where the market might be going.
In general, I think securitisation will be an important part of the financial landscape in the future. Prior to the crisis, many commentators sang the praises of securitisation as a useful means of dispersing risk around the financial system, and in principle I think they were right. There were, however, some major shortcomings in the implementation of securitisation.
While I expect securitisation to make a solid return, I do not expect it to be as large a part of the market as it was in 2007 anytime soon. This is in part because demand for RMBS had been artificially boosted by the use of SIVs.
I have said before that there are a lot of similarities between securitisation and junk bonds, despite being very different in credit quality. Both were important financial innovations that were well-founded. Both grew too rapidly and expanded into areas they shouldn't have and were bought by investors who shouldn't have bought them. Both played important roles in generating financial dislocation. Just as junk bonds are now a regular (but smaller) part of the financial landscape, I believe securitisation will be similar in the future.
However, as with junk bonds, much needs to be done to restore the brand name of securitisation. Some of this will only come with the passage of time. However, there are steps that can be taken to hasten the process:
Firstly, the message that Australian RMBS have been, and continue to be, a strongly performing asset needs to be continually reinforced. The differentiation between Australian RMBS and US RMBS needs to be highlighted. This message probably doesn't need to be delivered to the portfolio managers. It needs to be delivered to the superannuation trustees whose views may be affected by continual media exposure to the US experience that securitised assets are excessively risky. The Australian industry needs to differentiate its product from the US brand.
Secondly, securitised products should not be made out to be what they are not. I do not believe they should have ever been part of ‘enhanced cash’ portfolios. These products are a long way from cash and not where I believe such products should be located in an investor's portfolio.
Nor should the liquidity characteristics of RMBS be oversold. By their very nature, RMBS are most suited to buy-and-hold investors. These investors should be relatively unconcerned about the need to liquefy their investment, nor be overly worried about a temporary widening in spreads/fall in price, so long as the underlying asset continues to perform.
By and large, there is only so much that can be done to standardise the product, although what can be done is certainly worth doing. Yes, there are a minimum set of characteristics that it makes sense for RMBS to possess, but there will remain differences depending on the originator, the exact composition of the mortgage portfolio that backs the security etc, that will mean that one RMBS is not easily interchangeable with another. Hence it is difficult to say there is one secondary market price for an RMBS, the way one can do for a government security.
As I mentioned earlier, given the speed of amortisation of RMBS, the stock outstanding has declined by over 40 per cent from its peak in mid 2007. By now this should be creating holes in investors' portfolios, notwithstanding the permanent absence of some of the earlier buyers of RMBS. With spreads continuing to narrow, some investors may also be getting concerned that they have missed the boat.
Hence, I think there are good reasons to believe that the signs of life that we have seen in the market in recent months presage more activity to come in the near future.
Endnotes
I thank Sue Black, Mark Hack and Josh Kirkwood for their help. [1]
There are two main LMI providers in the Australian market, Genworth Australia and QBE LMI (formerly PMI Australia). Both were originally subsidiaries of US parents and are well capitalised in Australia, which prevented their ratings falling as much as their parents'. [2]