Bulletin – December 2009 Recent Developments in Margin Lending in Australia[1]
- Download 149KB
Margin loans enable households to borrow to invest directly in shares or managed funds, thereby gaining leveraged exposure to the equities market. In Australia, margin debt grew rapidly between 2000 and 2007, reflecting households' greater willingness to borrow to invest in equities during a period of strong share market returns, and the associated expansion of the range of margin loan products offered by lenders. However, over 2008, the value of outstanding margin debt halved, amid volatile and falling equity markets.
This article discusses the main characteristics of margin loans in Australia, using data from the Reserve Bank of Australia's quarterly margin lending survey.[2] In September 2009, the survey indicated that there were about 217,000 margin loan accounts, with an average loan size of around $85,000. The average loan-to-valuation ratio (LVR) was around 50 per cent on accounts with non-zero balances. Australian equities (particularly the major banks and large, well-known mining and industrial companies) accounted for around 70 per cent of the collateral backing the margin loans, and most borrowers did not have overly concentrated investment portfolios.
Background
Margin loans are the most common way that households borrow to invest in equities. They involve the borrower lodging cash, shares or managed funds with the lender (typically a bank or stockbroker), which then provides a line of credit to supplement the borrower's own capital. This line of credit – the margin loan – is used to purchase additional shares and managed funds, which then also become security for the loan.
There are two main types of margin loans offered in Australia: standard margin loans and protected finance margin loans. Standard margin loans normally have a maximum allowable LVR of 40–80 per cent, depending on the type of stock or managed fund that is provided as collateral for the margin loan. These loans are subject to margin calls if a decline in the value of the underlying collateral raises the LVR above the pre-specified maximum. They have generally accounted for over 85 per cent of total margin debt outstanding in Australia. In comparison, protected margin loans have a maximum allowable LVR of 100 per cent and the lender guarantees that the value of the borrower's underlying collateral will not be less than the outstanding loan at the end of the predetermined investment horizon. Borrowers with protected margin loans do not receive margin calls, but are charged a significantly higher rate of interest than for standard margin loans. Protected margin loans in effect combine a standard margin loan with a put option on the shares and managed funds purchased.
Margin loans allow households to have a leveraged exposure to share markets. This magnifies the potential gains when equity prices increase and, in the case of standard loans, also magnifies the potential losses that can result from falls in equity prices.[3] Households can also obtain a leveraged exposure to equities by taking out other types of loans (such as home equity loans) to purchase equities, or by investing in internally geared managed funds or other structured investment products, or by trading contracts-for-difference.[4]
The margin lending industry in Australia has become more concentrated over the past decade, with the four largest lenders accounting for about 70 per cent of total outstanding debt as at September 2009, up from about 55 per cent in December 1999. This largely reflects the large lenders acquiring smaller lenders in the market, with these acquisitions occurring steadily over the period.
Recent Trends in Margin Lending
Margin lending in Australia grew rapidly between September 2000 and December 2007, with debt outstanding rising from about $7 billion to a peak of $38 billion (Graph 1). The increase was larger for standard margin loans than for protected loans. The share of households' direct holdings of equity financed by margin lending increased from about 3 per cent to 9 per cent over this period. Margin debt also grew as a share of total household debt, but nonetheless remained relatively low at less than 4 per cent. At its peak, margin debt in Australia was equivalent to around 3 per cent of total equity market capitalisation and about 2 per cent of banks' total financial assets.
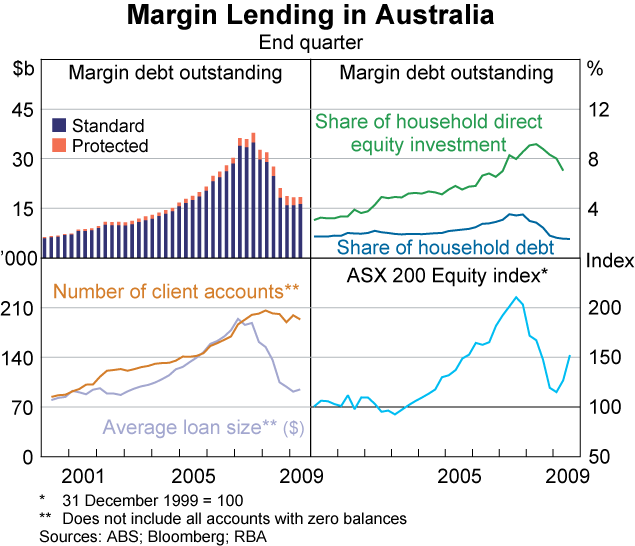
The growth in outstanding margin lending reflected both an increase in the average loan size from around $80,000 in September 2000 to $190,000 in December 2007, and a rise in the number of loans from 84,000 to 200,000. The increase in the average loan size partly reflected strong growth in large margin loans (those greater than $10 million); these accounted for around 18 per cent of total margin debt outstanding in mid 2007, up from 5 per cent in mid 2002 (when these data were first collected).
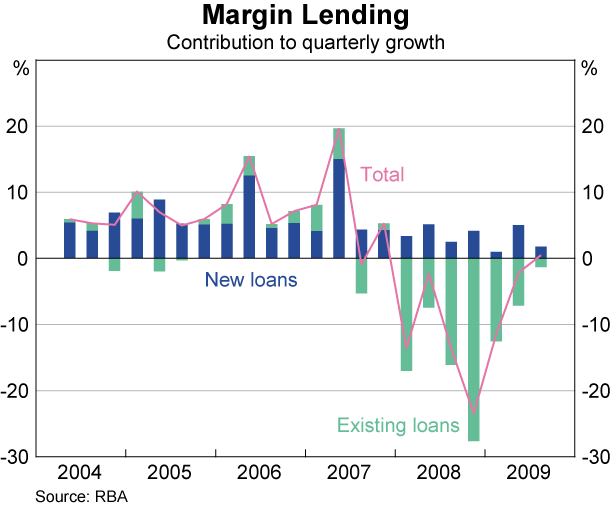
During 2008, a significant amount of the growth in outstanding margin loans was unwound, as volatile and generally falling share prices reduced the demand for new margin loans and caused a sharp repayment of existing margin debt (Graph 2). As at September 2009, the value of total margin debt outstanding had roughly halved from its peak to be around $18 billion, at levels last seen in mid 2005. The total number of accounts was little changed, but the average loan size declined substantially as many borrowers repaid their loans partially or fully. The fall in outstanding debt was less pronounced for protected margin loans (down 30 per cent from its peak in mid 2008), as borrowers with these loans did not receive margin calls and were guaranteed the portfolio's initial capital value.
The value of outstanding large margin loans had fallen by 70 per cent from its peak in mid 2007, with decreases in the number and average size of these loans. This appears to have in part reflected the repayment of margin loans held by senior management of listed companies during the downturn in the Australian equity market.[5] Large loans now account for about 10 per cent of total margin debt outstanding.
As at September 2009, about two-thirds of outstanding margin debt was at variable rates. The remaining debt was at fixed rates, with most of this in the form of loans on which interest has been prepaid (usually up to 12 months in advance) to bring forward the tax deduction on the interest expense. The average variable interest rate on margin loans was around 8 per cent as at end September; this rate has fallen by about 260 basis points since mid 2008, compared with the 370 basis point reduction in the average rate on home equity loans.
Margin Calls and Leverage
Margin calls occur when falls in the value of a borrower's collateral cause the current LVR to exceed the borrower's maximum LVR plus the ‘buffer’. The ‘buffer’ is typically about 5–10 per cent, and allows borrowers to utilise the maximum LVR on their collateral without continually receiving margin calls due to usual fluctuations in share prices. In the event of a margin call, the borrower is contacted and is required to reduce the LVR on their loan by contributing additional approved collateral, paying down the loan by selling part of the existing portfolio, or depositing additional cash.
Over 2008, the Australian equity market experienced large price falls and extreme volatility. The volatility was most severe in the December quarter, when the S&P/ASX equity index recorded a peak-to-trough decline of 30 per cent, the largest within-quarter fall since 1987 (Graph 3). The erosion of the value of the underlying assets backing margin loans saw the average LVR rise to 50 per cent, from less than 40 per cent six months earlier. The volatile market and higher LVRs caused the frequency of margin calls to increase to 10 per day per 1,000 clients in the December quarter 2008, its highest level over the 2000–2008 period. Over 2008 as a whole, the frequency of margin calls averaged 5 calls per day per 1,000 clients; this was higher than during the previous equity market downturn in 2001–2002.
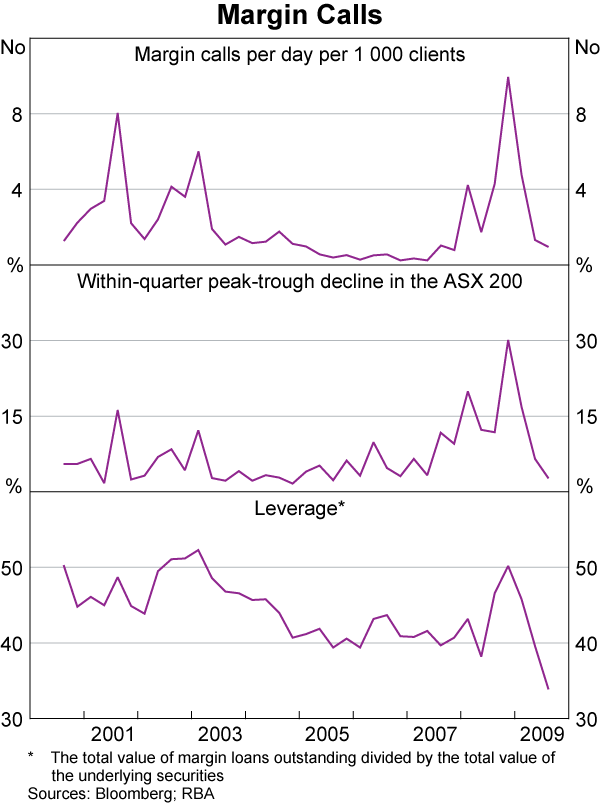
In response to the margin calls received in 2008 and to provide a buffer against potential future margin calls, investors substantially reduced the leverage on their loans over 2009. Lower margin debt levels, combined with gains in the value of the underlying assets (as equity markets began to recover) saw borrowers' average gearing levels decline by about 15 percentage points, to 35 per cent. Consistent with this, margin calls declined to around one call per day per 1,000 clients in the September quarter 2009. Deleveraging by investors occurred more quickly during 2009 than following the 2001–2002 equity market downturn, when most borrowers topped up their margin account with additional collateral rather than paid down the loan.
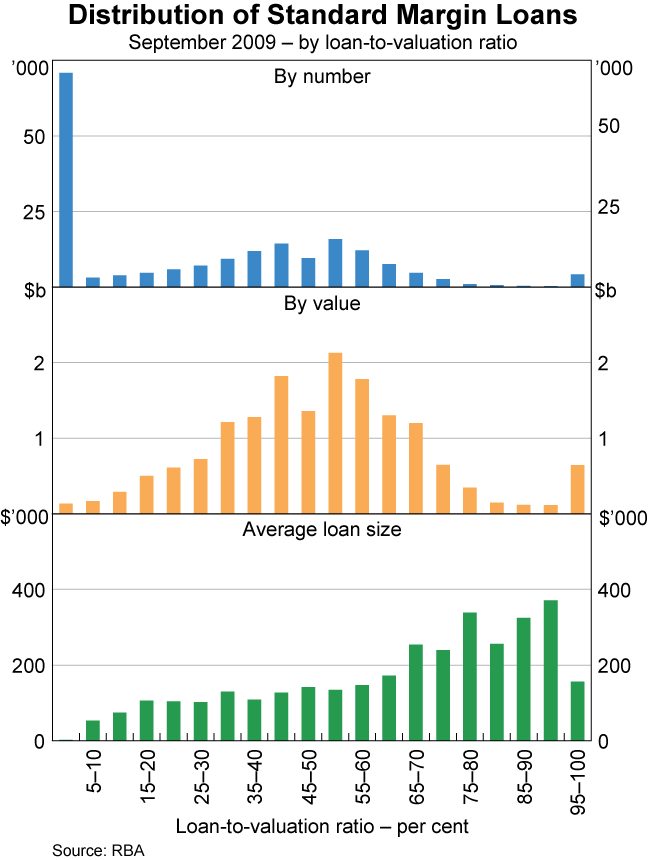
The reduction in LVRs during 2009 has been broad-based across borrowers, with the distribution of borrowers' LVRs having shifted noticeably lower since December 2008. As at September 2009, about two-fifths of the number of accounts had a LVR of between 35 and 75 per cent (Graph 4). This is consistent with most stocks and managed funds having a maximum LVR of between 40–80 per cent. Around one-third of margin accounts had negligible gearing (LVRs of less than 5 per cent) and a small average loan size; most of these loans had recently been paid down or were inactive. Over 2009, the average size of loans with high LVRs (greater than 90 per cent) decreased from around $383,000 to $171,000. As at September 2009, margin loans with high LVRs accounted for around 2 per cent of the number of loans outstanding, and about 5 per cent of the value of loans outstanding. Most of these accounts had been exposed to substantial declines in the value of their collateral and the borrowers were in the process of settling their margin calls.
Margin Loan Collateral and Credit Limits
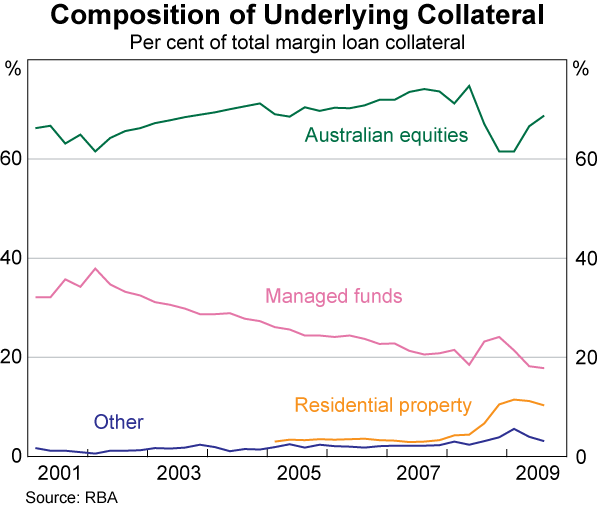
Most of the collateral backing margin loans is Australian equities and investments in managed funds, with these assets accounting for about 70 and 20 per cent of total collateral respectively (Graph 5). However, over 2008 there was a significant increase in the use of residential property as collateral, with its share rising from 3 to 11 per cent. This reflected a deliberate increase in the use of residential property as collateral by borrowers, with some financial planners encouraging clients to use their house as collateral to avoid or to recover margin calls, and also the fact that property prices fell by less than share prices during 2008.
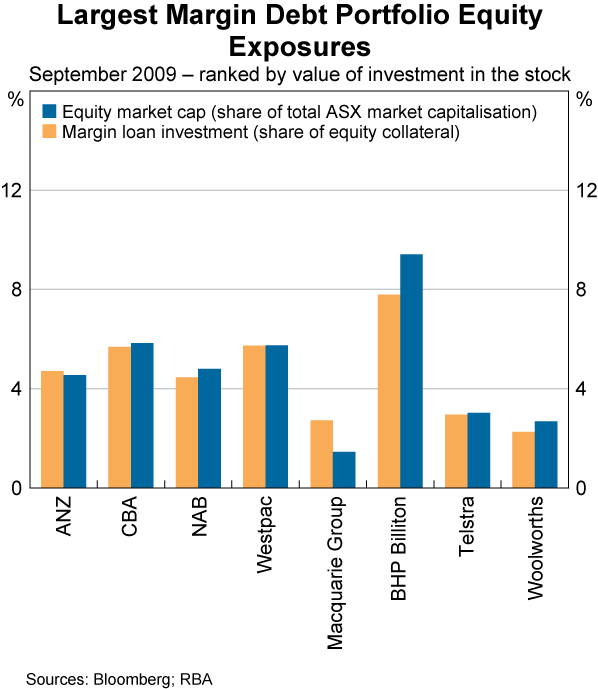
As at September 2009, most borrowers did not have concentrated equity portfolios, with almost 40 per cent of individual borrowers having more than 20 stocks in their portfolio and a further 15 per cent having 10–20 stocks (although the concentration of borrowers' portfolios did differ across lenders). Borrowers' portfolios tend to be mainly invested in large liquid stocks, with most lenders reporting that their borrowers' largest equity exposures were to the major domestic banks and large well-known mining and industrial companies. Each of these stocks accounted for between 2 and 8 per cent of borrowers' total equity portfolio (Graph 6). These companies are among the largest in terms of equity market capitalisation in Australia and are highly liquid. None of these companies appear to be particularly susceptible to share price falls as a result of forced selling by margin loan borrowers, as their share of borrowers' portfolios was generally in line with or less than the stocks' weights in the total Australian equity market. However, there were some smaller companies where investments made by borrowers with margin loans accounted for 10–20 per cent of the stock's market capitalisation. For these stocks, a rapid unwinding of investments by margin loan borrowers may exacerbate declines in their share prices.
To limit the potential credit risk on their margin loans, lenders typically designate the range of securities that they are prepared to accept as collateral and the maximum credit limit on the loan. The number of approved stocks and funds for investment generally increased up until late 2007. However, in response to the unsettled market conditions over the past year, a number of large margin lenders scaled back their eligible collateral list as well as the maximum allowable LVR on particular stocks. In addition, a few lenders lowered the maximum allowable LVR and stock list depending on the concentration of borrowers' investment portfolios, to encourage more diversified portfolios. At present, lenders allow an average of about 500 stocks and over 800 managed funds to be used as collateral for margin loans.
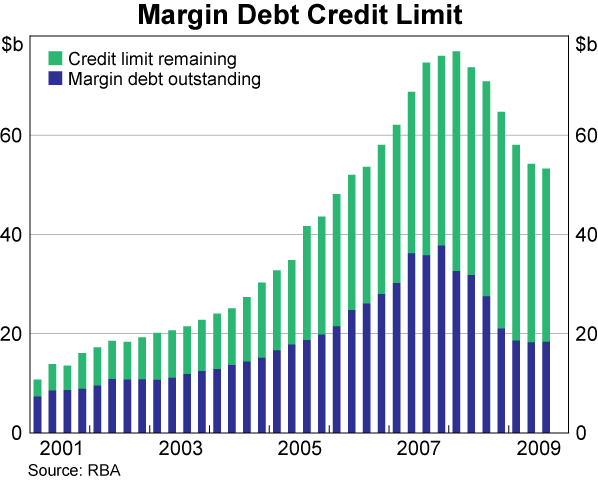
The maximum credit limit for margin loans is generally set at approval based on the value of the borrower's underlying collateral and the lenders' eligible stock list and maximum allowable LVRs. These credit limits are not typically adjusted automatically following movements in the stock market or changes in the lenders' eligible stock list; rather, borrowers have to apply formally for a change in the limit. As at September 2009, the maximum margin loan credit limit in aggregate was $53 billion, 30 per cent below its peak in March 2008 (Graph 7). The decline in the maximum credit limit mainly reflected some borrowers closing their accounts, and lower approved credit limits for the remaining borrowers following declines in the share market. The share of this credit limit actually used by borrowers remained low at about 35 per cent, suggesting that the credit limits were not a binding constraint on most borrowers.
Regulation of Margin Lending
Margin loans in Australia have historically not been regulated under the Consumer Credit Code, since they are for investment purposes; similarly, investor housing loans are also not covered by the Code. However, most financial institutions that offer margin loans in Australia are regulated by the Australian Prudential Regulation Authority and the Australian Securities and Investments Commission (ASIC) and their lending is therefore subject to various consumer protection measures and disclosure requirements. Following the sharp falls in the Australian share market over 2008, which saw severe difficulties in some non-traditional margin lenders in Australia and sizeable financial losses from margin loans by some households, the Council of Australian Governments agreed that the Commonwealth Government should become responsible for the national regulation of consumer credit, including margin lending facilities.
Legislation aimed at increasing consumer protection was approved by the Commonwealth Parliament in October 2009. Under the new legislation, which will be effective from mid 2010, all margin loans will be covered under the Corporations Act 2001. This means that margin lenders and advisors would be regulated by ASIC, need to hold an Australian Financial Services Licence, and be obligated to provide borrowers with access to timely, independent and cost-effective dispute resolution services to resolve complaints. Margin lenders will also be subject to new responsible lending obligations, such as taking reasonable steps to assess and verify the financial capacity of the borrower when first providing a margin loan or increasing the loan limit. Lenders will also be explicitly required to notify borrowers promptly of margin calls, provide periodic statements, and disclose fee structures upfront.
The Australian Government has also recently released draft legislation on the disclosure framework for margin lending and an example Product Disclosure Statement (PDS) for public comment. The proposed PDS will require lenders to explicitly outline: how the margin loan operates; the triggers for margin calls; the benefits and risks of the loan; and the associated costs (interest, fees and commissions). The PDS requirements are intended to reduce the costs and complexity of disclosure for lenders, while ensuring better protection for investors through the provision of clear and easy to understand product information.
Footnotes
This article was prepared by Arlene Wong of Domestic Markets Department. [1]
The Reserve Bank of Australia's survey, which was started in 1999 and expanded in 2000 and again in 2009, provides the most comprehensive data on margin lending in Australia. [2]
See ‘Box C: Margin Lending’ in the May 2000 Statement on Monetary Policy (pp 29–30) for an illustration of the impact of market movements on the leverage and return of margin loans. [3]
The amount of equity investment financed by debt other than margin loans is not easily measurable, but appears to be small compared with margin debt. The RBA survey does not include non-traditional margin loans, such as those offered by Tricom and Opes Prime, which involve the transfer of ownership of the stocks from the borrower to the lender. [4]
Senior management of listed companies sometimes used large margin loans to fund their purchases of shares through executive share plans. The highly leveraged and concentrated exposures of these directors became an issue in early 2008, when the market experienced significant amounts of short selling. In response, ASIC and the ASX issued a combined statement in late February 2008, requiring the public disclosure of key features of margin loans entered into by directors of listed companies for a ‘material number’ of that company's securities. [5]