Speech Skills, Technology and the Future of Work

Alexandra Heath[*]
Head of Economic Analysis Department
Career Education Association of Victoria and Victorian Commercial Teachers Association Work Futures Conference
Melbourne –
Changes brought about by new technologies are rapidly reshaping how we work and live. All these changes have a direct effect on the labour market, which is a fundamental part of how the economy works. When the Bank forecasts things like the unemployment rate and inflation, it needs to understand how these forces are shaping labour market outcomes. In particular, we need understand how the nature of work is changing, and how well the matched people looking for work are to the jobs available. The Bank is also an employer facing the challenges of finding people with the right skills to meet our changing skill needs. As career advisers, you are looking at this from a very different perspective. What do you advise your students when you know that the labour market is evolving rapidly?
Today, I'm going to provide you with a very high-level perspective that provides some context for those very individual discussions you have with your students. Forecasting how things might change is a difficult exercise at the best of times, but a good place to start is to look at the trends in employment growth and think about what is driving them. The main takeaway of this exercise is that the strongest growth has been in the jobs that require the highest skills. Then I will touch on the financial rewards of obtaining higher skills, noting that there are also costs involved. Finally, I will explore what can be done to adapt to these changes and highlight the importance of investing in skills that are well matched to the job.
The Changing Nature of the Australian Workforce
There are many ways to classify the workforce to understand how it has changed over time. Today I'm going to start by looking at changes in employment for different skill levels.[1] I'm going to use an ABS measure of skills that classifies the skill level of each occupation based on a judgement about the required level of formal education and training, previous experience in a related occupation, and on-the-job training. To make this judgement, the ABS sought advice from employers, industry training bodies, professional organisations and others.[2] The highest-skill occupations are allocated to skill group 1, while the lowest are allocated to skill group 5.
Employment for occupations requiring the highest level of skills has increased notably as a share of total employment from 15 per cent in the mid 1960s to above 30 per cent today (Graph 1).[3] The strength in high-skilled employment has mainly come from an increase in the skills required within each industry over time, rather than a shift in employment from industries that are dominated by lower-skilled occupations to industries that are dominated by higher-skilled occupations. Over the past five years, the health care & social assistance, information media and telecommunications and construction industries have experienced particularly significant upskilling.
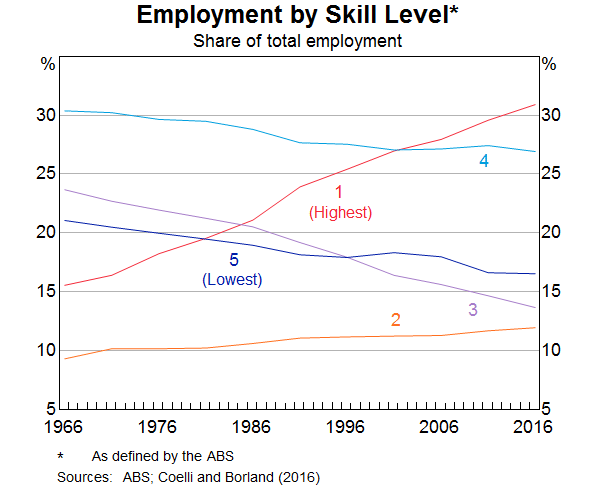
By contrast, employment shares of the lowest three skill categories have declined over time, although these skill categories still account for a significant share of the labour force overall. The decline in share has been the largest for the middle-skill group, where most production and trade occupations are located. The employment share of lower-skill occupations (those classified at skill level 4 and skill level 5) has fallen gradually since the 1960s, but over the past decade, the share has been more stable reflecting strong demand for carers and labourers.[4] So what explains the relatively weak performance of lower- and middle-skilled jobs?
One explanation is that these jobs are more prone to being automated as a part of the ongoing process of technological change.[5] It turns out that a large share of occupations in the lower skill categories are quite routine, that is they are characterised by very procedural and rule-based activities (Graph 2). They may be routine and cognitive (such as clerical jobs) or routine and manual (such as basic machinery operators). The rapid improvement in computer technology over the past few decades has enabled the automation of routine tasks that were previously undertaken by workers in lower-skill occupations. For example, self-checkout is replacing cashiers and autonomous haulage is substituting for truck drivers at mining sites.[6] The advance in technology also enables employers to offshore some of the routine services provided by occupations in the middle-skill category that can't be directly replaced by machines yet, such as call centres and back-office support services.[7] The decline in the relative importance of manufacturing has also contributed to slower growth of lower- and middle-skill jobs.
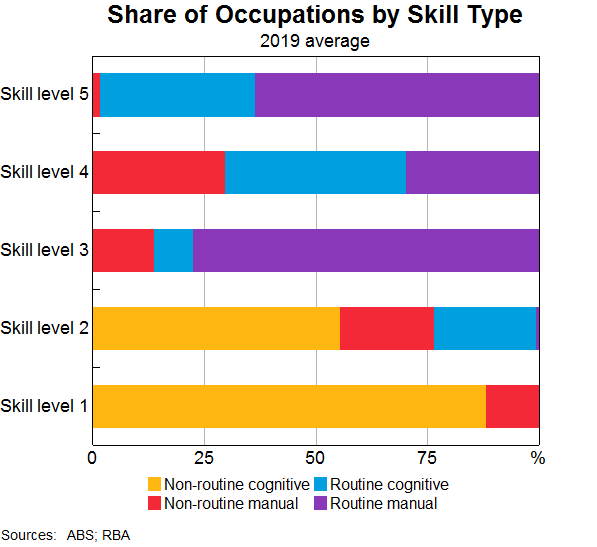
The fact that the employment shares for lower-skilled workers have been more stable over the past decade or so partly reflects the strength in demand for lower-skill non-routine manual occupations, such as carers. These occupations tend to be more difficult to automate because they intrinsically require a physical human presence.
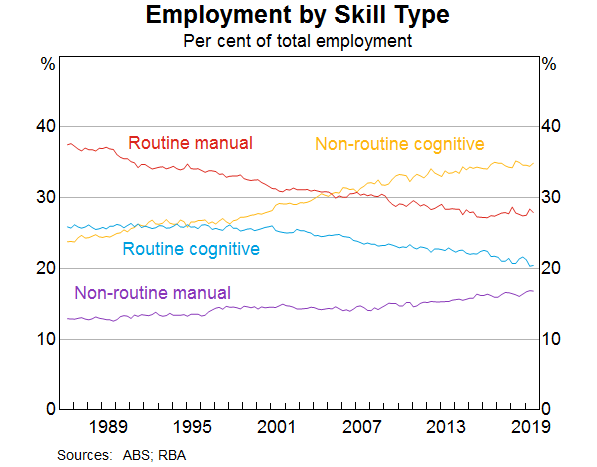
Overall, the share of non-routine manual jobs has actually risen over recent decades (Graph 3). The fact that wages are 20 to 30 per cent lower for lower-skill jobs than for middle-skill jobs is also going to change the incentives to invest in technology to automate these jobs.
Although technological change has meant that some jobs have become redundant, it doesn't necessarily lead to fewer jobs overall. New technology reduces the demand for less-skilled workers, but it generally enables high-skill workers to undertake more non-routine cognitive and interactive tasks, thus raising their productivity and in turn the demand for these workers.[8] The share of employment in non-routine cognitive occupations has risen most significantly. This trend is likely to continue, given that technological change is going to continue.
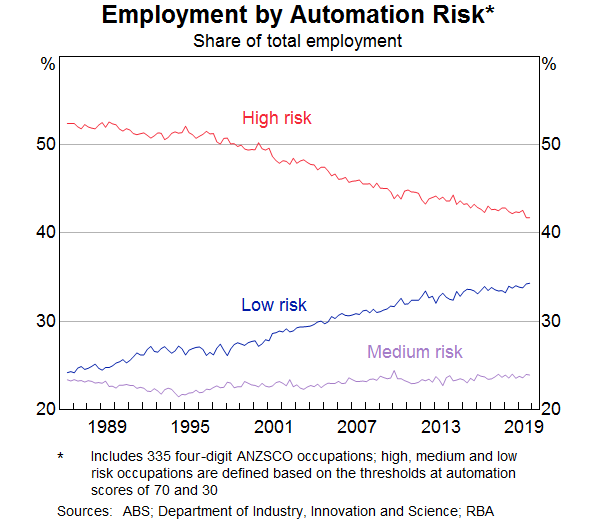
Another way of looking at the effect of technological change is to look at how the automation risk in the Australian labour force has changed over time. To do this we have applied automation risk classifications originally compiled by Frey and Osborne for US occupations to individual occupations in the Australian labour force.[9] To give you an idea of how this works, jobs in retail trade and in hospitality have a relatively high risk of automation, whereas tasks performed by dietitians, education advisers and scientists are at low risk.
The first thing to note is that the share of employment in occupations with high automation risk has declined over time (Graph 4).[10] One reason for this is that jobs themselves are changing: automation has replaced some of the more routine tasks, allowing more time for the important tasks that are harder to automate. Another reason is that the composition of employment has shifted towards occupations that are less susceptible to automation, which is consistent with the evidence I've already discussed. It is also clear from this graph that there isn't any indication that the trend is levelling out.
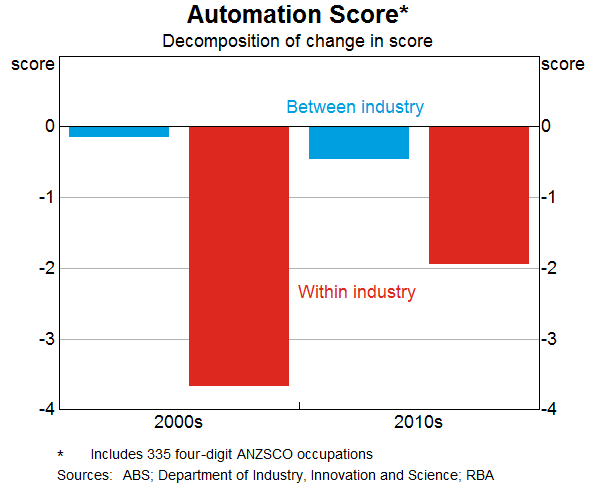
Most of the decline in the share of jobs at risk from automation is not coming from shifts in employment between industries (Graph 5).[11] In particular, the decline in manufacturing relative to services over time has changed the composition of the jobs on offer, but it hasn't reduced the overall risk of automation. Most of the reduction has actually come from shifts within industries, rather than shifts of employment between industries. These within-industry compositional changes are apparent in many industries, and isn't being driven by one or two industries.
The Characteristics of a High-skilled Occupation
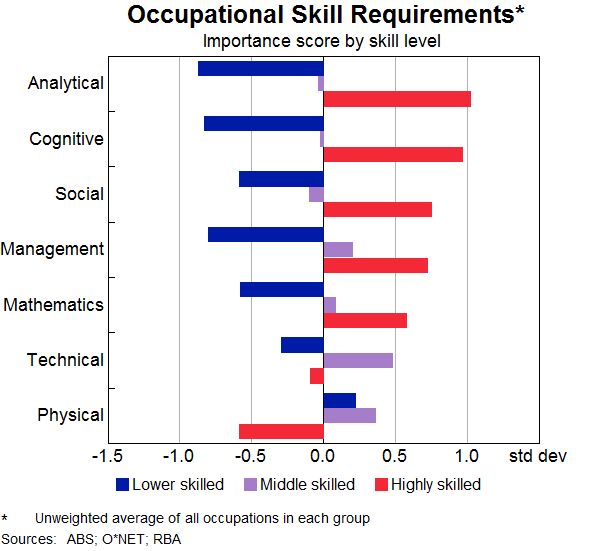
Having focused on the effects of technological change on lower-skilled workers, I'm now going to turn to the positive effects on more skilled workers. The previous graphs have illustrated that highly skilled jobs are mainly in cognitive-intensive occupations performing mainly non-routine tasks, but the ABS classification of skills does not provide us with information about the specific skills that are generally associated with high-skilled occupations. To explore this, we compare the skills used in occupations that are highly skilled (defined as ABS skill level 1), middle-skilled (defined as ABS skill level 2 and 3), and relatively low-skilled (defined as ABS skill level 4 and 5).[12] The graph shows that analytical, cognitive, social, management and maths skills are most utilised by those in highly skilled occupations (Graph 6). In contrast, the level of physical ability required by skill level 1 jobs is below the average level of all occupations, but is important for lower- and middle-skilled occupations. Middle-skilled jobs also require a well above average level of technical skills, which makes sense because most technicians and trade jobs are in the middle-skilled group.
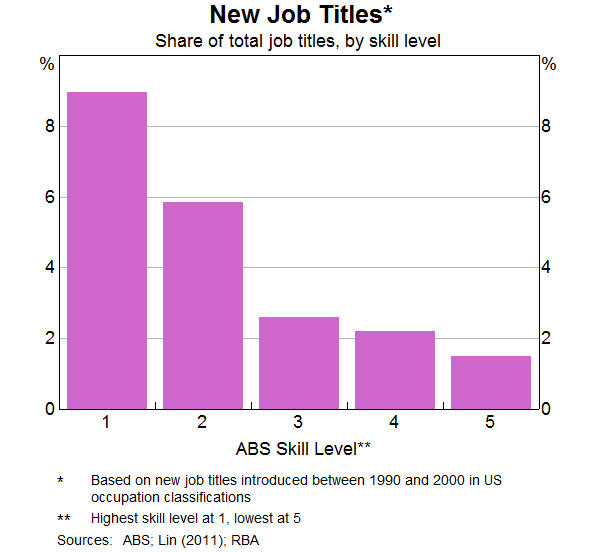
The previous evidence I presented also hinted at the idea that technological change is likely to increase the demand for more highly skilled workers because their core competencies are more likely to complement the new technology. This is supported by evidence that most of the new job titles that have been created are disproportionately found within higher-skilled occupations, while the least new job titles have been created within lower-skilled occupations (Graph 7).[13]
Other research for the United States shows that occupations with the highest share of new job titles have experienced the fastest employment growth.[14] Based on the new job titles identified from this US study, the job categories that have a relatively high share of new job titles and relatively strong growth in Australia include computer software programmers, ICT security specialists, computer network professionals, and education advisers and reviewers. The relative strength of employment growth in occupations with a high share of new job titles accounted for over 10 per cent of the 4 million or so jobs created over the past 20 years in Australia.
Where does one get the skills to take advantage of these shifts in demand for workers? The simple answer is education and training. Attaining a formal post-school qualification has become increasingly important for obtaining the skills required for getting a job. High school completion rates have continued to rise and almost 50 per cent of the working-age population now have a degree, compared with around 25 per cent at the beginning of the 1980s. Around 70 per cent of people working in highly skilled jobs have a bachelor degree qualification or higher. Alternatively, people can get skills on-the-job through training. This allows people who are already working to develop new skills and adapt to changes in the labour market. However, completion rates for apprentices and trainees have decreased in recent years, particularly for trade occupations.[15] The main reasons for not completing an apprenticeship or traineeship tend to be employment related, such as losing jobs, changing career or not getting along with people at work. The pressure from factors such as cuts to funding for the vocational training sector as well as a perception that tertiary education will lead to better lifetime outcomes has also contributed to the declining trend.
What are the Rewards of Obtaining Higher Skills?
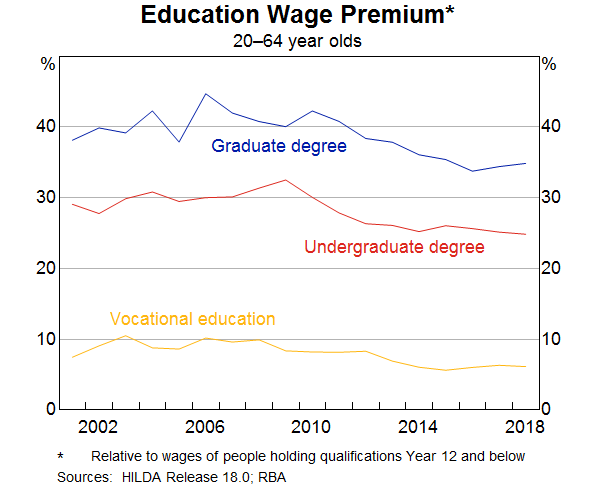
There is plenty of evidence to support the perception that tertiary education will lead to better outcomes. For a start, tertiary-educated people are less likely to be unemployed. Higher-skilled jobs are also associated with higher hourly earnings on average. Holding age, experience and other characteristics constant, those who had a bachelor degree earned around 25 per cent more in 2018 than those who had only completed high school (Graph 8).[16] Students graduating from the Group of Eight universities do get paid slightly higher starting salaries on average than those graduating from other Australian universities, but much of this small difference disappears once selection by ability (as measured by the ATAR of accepted students) is accounted for.[17] Vocational training also has a wage premium relative to only completing high school, which looks more attractive when the relative costs of obtaining a vocational qualification are taken into account, as I will discuss below. These developments all suggest that the labour market continues to demand and reward post-school qualifications of all kinds.
Being more skilled tends to lead to higher wages, but is attending university worth it given the financial cost and uncertain job market that awaits new graduates? The cost of full-time tuition for someone who successfully applies for a Commonwealth supported place is around $6,500–$11,000 per year depending on the course of study. The remainder of the costs are paid by the government, as is the case in many other countries. Students are also eligible for the student loan scheme (HECS-HELP), which removes some up-front cost barriers to higher education. In addition to the tuition cost, people forego income that would have been achieved from working. The decision to attend university should involve a careful calculation of the costs and benefits. However, for most students that do attend university, the returns have exceeded the costs. An OECD study estimates that a bachelor's degree holder in Australia, on average, earns nearly $350,000 more over the course of their lifetime than someone who holds only a high school qualification (after taking into account the costs of study).[18] This suggests a university-educated person will gain about $9,000 more per year in net benefits over a career of 40 years compared with a person with only secondary education.
Higher education not only pays off for individuals financially but investment in education generates higher public returns. For government, much of the costs associated with student grants and public subsidies for higher education are eventually offset by receiving additional tax revenue and social contributions from higher-paid workers. Investment in human capital is critically important to the country's future success.
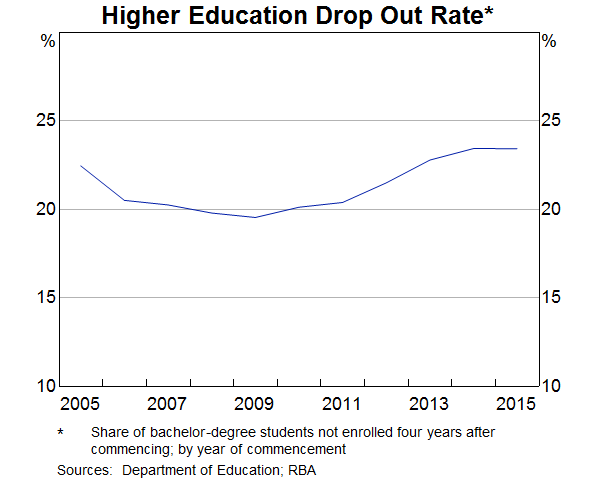
Despite the private and public benefits of higher education, it is important to consider other factors that may affect the returns to education. The risks of higher education not working out have risen over the past few years. Almost one-quarter of students who started a bachelor degree in 2014 or 2015 left university without a qualification (Graph 9). This attrition rate was almost 5 percentage points higher than it was for students who commenced their degree in 2009.
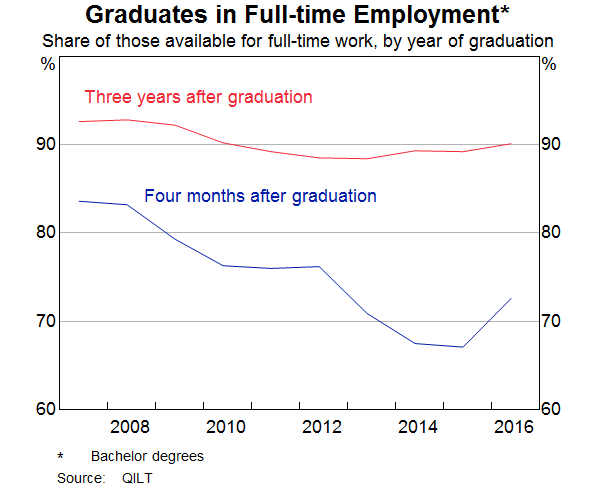
On top of this, the probability of finding a full-time job shortly after graduating from university has fallen by more than 10 percentage points since 2008. This probability is similar to what was observed during the early 1990s recession.[19] More positively, even though there has been a decline in the share of graduates getting full-time jobs within four months of graduating, the probability that they get a full-time job eventually hasn't changed much (Graph 10).
There is other evidence that university education may not be the right path for all students. For example, university completion rates are much lower for students with a lower ATAR.[20] Analysis by the Grattan Institute shows that for some students, vocational alternatives can lead to higher earnings than university courses.[21] For example, men with low ATARs earn less, on average, if they have bachelor degree in the humanities than if they have a trade qualification in construction, engineering or commerce. By contrast, female university graduates with low ATARs tend to be better off financially than those holding vocational qualifications in most fields.
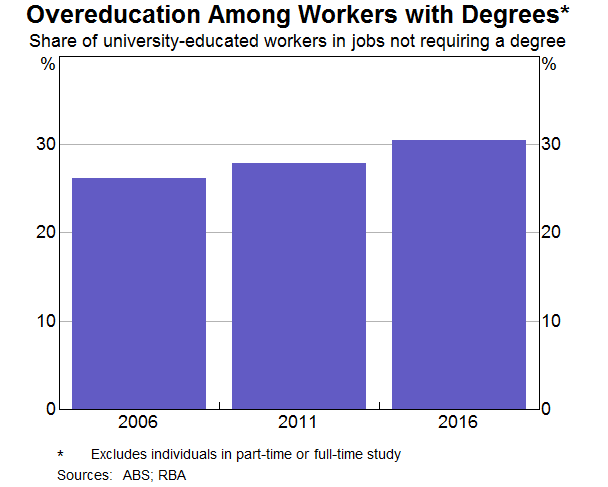
Another risk that has become apparent as the number of university-educated people increases is the possibility that that some people might not be able to find a job that fully utilises their skills or education. Data from the Census suggest that around 30 per cent of university-educated individuals are working in jobs that do not require a degree (skill levels 2–5) (Graph 11). The data also show that this share has been increasing over the past 15 years or so This over-education rate is within a range of estimates for other OECD countries and for Australia from other sources. Graduates in arts, social and natural sciences are more likely to be underutilising their education than graduates in other fields.[22]
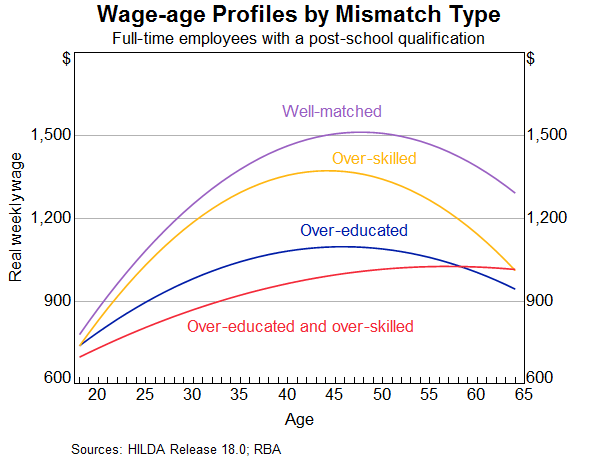
One consequence of skill mismatch is lower wages. Using data from the HILDA survey, which tracks individuals over time, it is possible to look at whether there is a difference in the wages of people who report that their education and skills are well matched to their jobs and the wages of people for whom this is not true. The graph shows people who work in jobs that do not make full use of their education and training earn lower wages than those in jobs that provide a good match to the education and training (Graph 12). In addition, well-matched workers experience a steeper wage progression as they gain experience than mismatched employees.
Beyond wage effects, skill mismatch has an impact on job satisfaction and job mobility. Research shows that workers in jobs not well matched with their skills are often less satisfied with their work than well-matched workers with the same qualifications.[23] Over-qualified workers are also significantly more mobile than well-matched workers.[24] Lower job satisfaction and higher job mobility rates are likely to affect the productivity of mismatched workers, although the empirical evidence on this point is not very clear.
Conclusion
Bringing this all together, the evidence I've presented today suggests that there is a clear trend towards more growth in highly skilled jobs. These jobs are less likely to be automated and are actually likely to benefit from technological change. On top of that, highly skilled jobs are generally more financially rewarding. But these results are the ‘on average’ outcomes. For any given individual, however, having a university education might not make you better off. The quality of the match between the skills of the worker and the job matters. The education systems needs to respond to any mismatches between the skills being taught and the skills that businesses need. In particular, universities and vocational education need to focus on developing transferable skills while also fulfilling the traditional role of teaching technical skills.
For firms, on-the-job training can also help alleviate skill mismatch. Training in the workplace can help prevent skill obsolescence for workers who possess more skills than their job requires, as well as help under-skilled workers to acquire the competencies for the work that is available. Retraining can help employees upgrade their skills in light of new requirements driven by technological change and therefore adapt to changes in the workplace.
So far, the idea of mismatch has been couched in terms of a cost-benefit analysis, but we all know that choosing courses and careers is not just about maximising the probability of having a job and income. When thinking about what a good match might look like, it is also important to acknowledge that students are likely to be more successful when they are doing something they find engaging. The factors entering into this calculus are much broader and include things like childhood aspirations, what they observe working for people they know, and inspirational teachers.
Interestingly, a recent OECD study shows that the preferred jobs for 15-year-olds haven't changed much since 2000 across the countries surveyed, despite the technological advancements in the workplace that have led to the changes in the nature of work we have discussed today.[25] Sixteen per cent of Australian girls expect to be doctors at age 30, while nine per cent expect to be teachers. Eight per cent of Australian boys expect to be engineers, while five per cent live in hope of being a sportsperson. One in five young people in this cross-country study underestimate the levels of education required to secure professional or managerial positions, but Australian teenagers are less likely to aspire to jobs that are at significant risk of automation than teenagers in other countries.
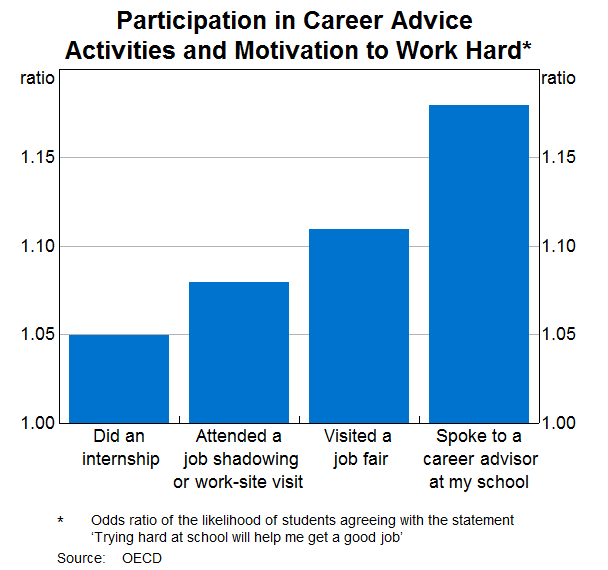
This draws attention to the challenges faced by young people to make informed decisions and the importance of having effective career development activities to help them understand what they can do to fulfil career expectations. For the audience today, the OECD report offers some assurance that you are adding value to this decision-making process (Graph 13). This graph shows that students who had spoken to a career adviser at school were much more likely to report that trying hard at school would help them get a good job. As a parent of a 16-year old, all I can add is to say ‘keep up the good work’.
Endnotes
Speech was delivered by Mark Chambers on Alexandra Heath's behalf.
I would like to thank James Bishop and Amelia Gao for their assistance in preparing these remarks. I would also like to thank Natasha Cassidy, Jacqui Dwyer, Blair Chapman and Rochelle Guttmann for helpful comments along the way. [*]
This analysis uses historical data originally put together by Michael Coelli and Jeff Borland at the University of Melbourne. [1]
In 2019, the ABS and StatsNZ made some amendments to the skill levels assigned to occupations in the Australian and New Zealand Standard Classification of Occupation (ANZSCO) in recognition of the changing nature of requirements in the labour market. The last major review of occupation classifications in ANZSCO was in 2009. The RBA supports calls for a review of ANZSCO, given the changing nature of jobs over this period. [2]
More than 40 per cent of the growth in employment over this period has been in high-skilled jobs, but there has been an absolute increase in employment at each skill level since the 1960s. [3]
Similar trends have also been documented in a range of advanced economies. In the United States there has been evidence of ‘job polarisation’ where there is an increase in the share of employment in high-skill and low-skill jobs, and a decrease in the share in middle-skill jobs (see, for example, Autor (2003)). In the Australian context, Coelli and Borland (2016) find some evidence of job polarisation in the 1980s and 1990s. [4]
Autor D, F Levy and R Murnane (2003), ‘The Skill Content of Recent Technological Change: An Empirical Exploration’, The Quarterly Journal of Economics, 118(4), pp 1279–1333. [5]
Heath A (2019), ‘Australia’s Resource Industry – A Look into the Crystal Ball', Speech at the Association of Mining and Exploration Companies, Perth, 5 June. [6]
Heath A (2016), ‘The Changing Nature of the Australian Workforce’, Speech at the Committee for Economic Development of Australia (CEDA), Brisbane, 21 September. [7]
Coelli M and J Borland (2016), ‘Job Polarisation and Earnings Inequality in Australia’, Economic Record, 92(296), pp 1–27. [8]
Edmonds D and T Bradley (2015), ‘Mechanical Boon: Will Automation Advance Australia?’, Department of Industry, Innovation and Science, Research Paper 7. The automation risk scores of Australian occupations have been estimated using data compiled by Frey and Osborne for US occupations, see Frey CB, M Osborne (2013), ‘The Future of Employment’, University of Oxford. [9]
One limitation of Frey and Osborne's approach is that they only considered the technical automation susceptibility of occupations. As they stated in the paper, ‘the actual extent and pace of computerisation will depend on other factors which were left unaccounted for’. [10]
This analysis uses the decomposition method used in Kelly and Lewis (2010), see Kelly R and P Lewis (2010), ‘The Change in Labour Skills in Australia over the Business Cycle’, Australian Bulletin of Labour, 36(3), p.260. [11]
To ease comparison, we standardise the ‘importance’ score of each skill from the O*Net database to have zero mean and unit standard deviation across all occupations. For further details, see Bishop J and R Guttmann (2018), ‘Does It Pay to Study Economics ?’, RBA Bulletin, September, viewed 12 February 2020. [12]
Lin (2011) calculated the total number of new job titles in each occupation in the United States by comparing the 2000 Census Index of Occupations to its 1990 equivalent. A job is classified as ‘new’ if workers perform a set of tasks that are different to the tasks required by any previously existing job. These data are then translated to Australia's occupational classifications and an unweighted mean is calculated for all occupations in each skill level. Lin J (2011), ‘Technological Adaptation, Cities, and New Work’, Review of Economics and Statistics, 93 (2), pp 554–74. [13]
Acemoglu D and P Restrepo (2018), ‘The Race between Man and Machine: Implications of Technology for Growth, Factor Shares, and Employment’, American Economic Review, 108(6), pp 1488–1542. [14]
National Centre for Vocational Education Research (2019), ‘Australian vocational education and training statistics: Apprentice and Trainee Experience and Destinations 2019’, NCVER, Adelaide. Available at <https://www.ncver.edu.au/__data/assets/pdf_file/0037/8379181/Apprentice_and_trainee_experience_and_destinations_2019.pdf> [15]
This document uses unit record data from the Household, Income and Labour Dynamics in Australia (HILDA) Survey. The unit record data from the HILDA Survey was obtained from the Australian Data Archive, which is hosted by The Australian National University. The HILDA Survey was initiated and is funded by the Australian Government Department of Social Services (DSS) and is managed by the Melbourne Institute of Applied Economic and Social Research (Melbourne Institute). The findings and views based on the data, however, are those of the authors and should not be attributed to the Australian Government, DSS, the Melbourne Institute, the Australian Data Archive or The Australian National University and none of those entities bear any responsibility for the analysis or interpretation of the unit record data from the HILDA Survey provided by the authors. [16]
Carroll D, C Heaton and M Tani (2019), ‘Does It Pay to Graduate from an 'Elite' University in Australia?’, Economic Record, 95(310), pp 343–357. [17]
Organisation for Economic Co-operation and Development (OECD) (2019), ‘Education at a Glance 2019: OECD Indicators’, pp 98–108. Benefits are discounted using a 2 per cent discount rate and are in equivalent AUD converted using the purchasing power parity (PPP) rate in the reference year 2015. [18]
Dhillon Z and N Cassidy (2018), ‘Labour Market Outcomes for Younger People’, RBA Bulletin, June, viewed 20 February 2020. [19]
Productivity Commission (2017), University Education, ‘Shifting the Dial: 5 year Productivity Review’, Supporting Paper No. 7, Canberra. [20]
Norton A, I Cherastidtham and W Mackey (2019), ‘Risks and Rewards: When is Vocational Education a Good Alternative to Higher Education?’, Grattan Institute No. 2019-06, August. [21]
The rise in the overeducation rate since 2006 suggests that the supply of university-educated workers has outpaced the demand for such labour. Domestic university enrolments grew strongly with the introduction of a demand-driven system that removed caps on undergraduate university places; this system was abolished in 2017. In addition to a surge in domestic enrolments, there has been a rise in the number of skilled migrants over this period who are more likely than the average Australian to hold a university degree, see Lowe P (2018), ‘Demographic Change and Recent Monetary Policy’, Address to Anika Foundation Luncheon supported by NAB and the ABE, Sydney, 8 August. [22]
Quintini G (2011), ‘Over-Qualified or Under-Skilled: A Review of Existing Literature’, OECD Social, Employment and Migration Working Papers, No. 121, OECD Publishing. [23]
Verhaest D and E Omey (2006), ‘The Impact of Overeducation and its Measurement’, Social Indicators Research, Vol. 77, pp 419–448. [24]
Mann A, V Denis and A Schleicher (2020), ‘Dream Jobs?: Teenagers' Career Aspirations and the Future of Work’. [25]