Bulletin – September 2018 Australian Economy Does It Pay to Study Economics?
- Download 407KB

Abstract
Economics graduates work in a broad range of occupations and industries, often beyond the discipline of economics itself. The earnings of economics graduates are higher than in most other fields of study, including business studies. By estimating wage premiums for various skills, we assert that the comparatively strong earnings of economics graduates comes from the development of analytical thinking and quantitative skills which are highly rewarded in the labour market.
Over the past year, the Reserve Bank has increased its efforts to advocate economics as a subject of choice for students at high school and university (Dwyer 2018, 2017; Heath 2017). Improving economic literacy should support the quality of public discourse in Australia and, in turn, promote good public policy. A natural question that students ask when considering their subject options is, ‘Does it pay to study economics at university?’ Part of the answer to this question relates to the types of jobs in which an economics degree allows them to work. Another part relates to the skills that are developed through studying economics and whether these skills are valued in the labour market. This article considers these issues.
A Profile of Economists and Economics Graduates in Australia
The 2016 Census provides a detailed snapshot of the labour market outcomes of the people who work as economists, along with those who have studied economics and have a post-school economics qualification (whether or not they work as economists). There are almost 3,000 economists in Australia, of which the majority hold a graduate or postgraduate qualification (Graph 1). Only around two-thirds of people who work as economists actually hold a qualification in economics. Other pathways to a career as an economist include degrees in management & commerce (which may involve an economics major), and to a lesser extent, STEM fields (i.e. science, technology, engineering and mathematics), law, political science and health. Men account for more than 60 per cent of all economists and economics degree holders.
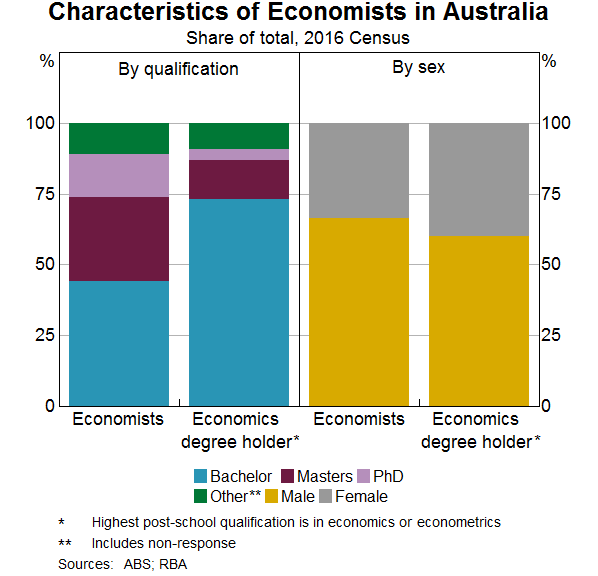
The ABS's definition of an ‘economist’ is narrow in that it excludes some people who would probably classify themselves as an economist. For example, a university economics professor would be classified as ‘University Lecturer or Tutor’. Nonetheless, the number of people with economics qualifications far outweighs the number of economist jobs in Australia. There were more than 73,000 people with qualifications in economics in 2016, and of those who were employed, only 3½ per cent worked as ‘economists’ and only 2½ per cent worked as ‘university lecturers or tutors’.[1] Indeed, people who hold an economics degree are more likely to work as an accountant than as an economist. The share of economics graduates practising in their primary field of study is low relative to other fields such as law, where more than half of all workers with a law degree are employed as a lawyer.
Economics graduates' employment and pay
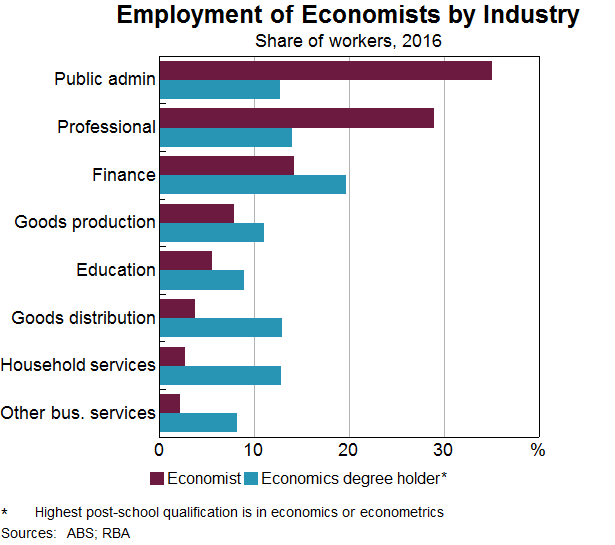
Jobs specifically in economics are concentrated in three main industries: Public Administration & Safety; Professional, Scientific & Technical Services; and Financial and Insurance Services (Graph 2). However, those with economics degrees work across a broader range of industries than most other graduates.[2] In fact, a similar number of economics graduates work in Public Administration & Safety as they do in household services or goods distribution.
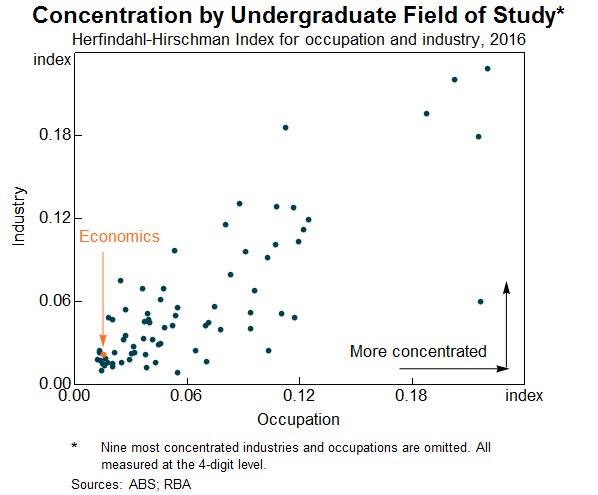
A more formal way of gauging the breadth of jobs in which economics graduates work is to use a measure of occupation concentration, such as the Herfindahl-Hirschman Index (HHI). The values of the index range from 0 to 1, where a lower number indicates greater diversity of occupations and a higher number indicates higher concentration. This index can also be used to measure the breadth of industries in which graduates work. Comparing HHIs across occupations (horizontal axis of Graph 3) and industries (vertical axis of Graph 3) for different degree fields shows that people with economics degrees work in a broader range of occupations and industries than people with degrees in most other fields. Out of 82 fields of study, economics is the 7th and 17th most diverse in terms of the range of occupations and industries in which qualification holders work. One possible interpretation is that it is relatively difficult for economics graduates to find work in their field of study. Another interpretation is that an economics degree is generalist in nature and provides a breadth of skills that allows an individual to work in a broader range of jobs compared to other fields of study. Indeed, 80 per cent of economics graduates work in high-skilled white-collar occupations.
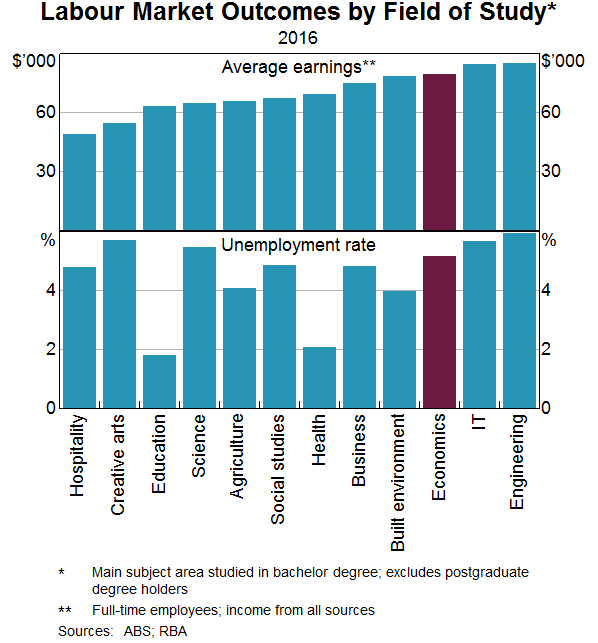
The earnings of those who work as economists are high relative to many other occupations. Using income data from the Australian Taxation Office (ATO) – described in the next section – economists have hourly earnings that put them in the top 3 per cent of earnings by occupation. Looking beyond the narrow economist occupation, Census data suggest the average income of a person who holds a bachelor's degree in economics is also relatively high. This provides tentative evidence that the skills and knowledge earned during the degree have some value to employers. Economics graduates typically have higher full-time earnings than graduates from most other fields of study, and their earnings are comparable to those with STEM degrees and higher than those with degrees in business and other social sciences (Graph 4).[3] However, despite having higher earnings on average, the unemployment rates of economics and STEM graduates tend to be higher than for people with other types of degrees. This is particularly the case around the time of graduation, suggesting some difficulty in obtaining an initial job in the field.
Skills and Earnings
Graph 4 shows that there are often large differences in average earnings between different fields of study. But what is driving these differences? In part, the differences in earnings reflect that each field of study provides certain skills, abilities and knowledge that are rewarded differently in the labour market.[4] The labour market tends to provide the greatest rewards – that is, the highest wages – to individuals with the skills, abilities and knowledge that are in shortest supply.
To explore the source of wage differences between graduates of economics and other disciplines, we examine the types of skills that economists use intensively (and so are likely to be developed via studying economics) and the wage premiums that those skills command in the labour market. A ‘skill wage premium’ is the difference in earnings between workers with a particular skill and those without it. This is also referred to as ‘returns to skill’.
Our analysis uses data on wages and skill requirements for different occupational groups. We have 384 occupation groups, of which ‘Economist’ is one. The wage data by occupation come from the ATO for the years 2010/11–2015/16. The skill data are from the US Bureau of Labour's (BLS) Occupational Information Network (O*Net) database, which provides information on the importance of different skills, abilities and knowledge for an occupation. For instance, ‘manual dexterity’ is an important ability for occupations such as surgeons and mechanics.
In the following analysis, we combine many different types of skill, ability and knowledge into 10 categories (for brevity, we refer to these as ‘skills categories’). These skill categories are: analytical; basic; economics knowledge; other cognitive; management; mathematics; physical; sensory; social; and technical. Analytical skills involve reasoning and problem solving, while basic skills include core skills, such as listening, reading and writing. Cognitive skills include creative higher-order skills, such as originality and oral and written expression. Management skills involve time, financial and resource management and so may be assumed by workers in a wide variety of roles, not just those in a leadership position. The physical abilities category includes fine- and gross-motor skills, while sensory abilities relate mostly to auditory and visual capabilities. The technical skills category mostly encompasses manual and engineering skills, such as designing, installing, operating and maintaining equipment and machines.
See Appendix A for more detail on the data used and skill categories chosen.
Skills used by economists
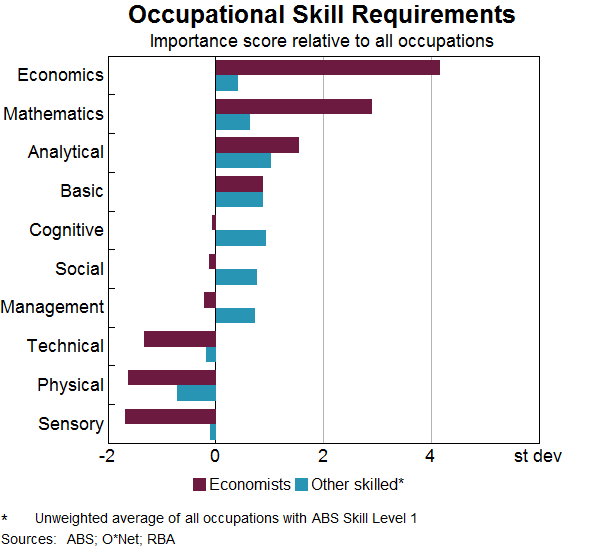
Economists require a specific skillset that is partly developed via formal study and partly via on-the-job training. To highlight which skills are most important to an economist, we compare the skills used by economists to those used in other ‘high-skilled’ occupations, defined here as jobs that require a level of skill commensurate with a university degree or five years of relevant experience. To ease comparison, we standardise the ‘importance’ score of each skill from the O*Net data to have zero mean and unit standard deviation across all occupations. We can then compare the skills that are most utilised by different occupations. For example, the level of maths ability required by economists is 2.9 standard deviations above the average level of all occupations (Graph 5). In comparison, the average maths ability required by other skilled occupations is 0.5 standard deviations above the mean of all occupations. Thus, economists require greater economics knowledge, maths and analytical skills, but less skill in physical, sensory, technical, management, social and other cognitive domains, relative to other skilled occupations.
Estimating the returns to skill
To discern the relative importance of different skills for wages, we need to estimate a regression model. This makes it possible to isolate the effect of each skill by holding constant the importance of other skills. For example, there is a strong positive relationship between maths skills and income, but this may simply be because jobs that require maths skills also require strong analytical skills, and it is actually analytical skills that are valued. The model specification is described in Appendix A.
We find that analytical skills have a high and statistically significant wage premium (Graph 6). There was a 23 per cent wage premium for occupations that require analytical skills that are one standard deviation higher than average over 2011–16. Maths and economics skills have a positive but statistically insignificant wage premium. The small premium for economics skills suggests that the high earnings for economists come from high analytical and mathematics abilities, rather than their specific knowledge of economic principles. The relatively high wages of economists also reflects their less intensive use of social, physical and technical skills, which tend to be less well rewarded in the labour market. Using a model of annual wages (rather than hourly wages) yields slightly higher wage premiums for these categories, reflecting that jobs with more maths and economics also tend to involve more hours.
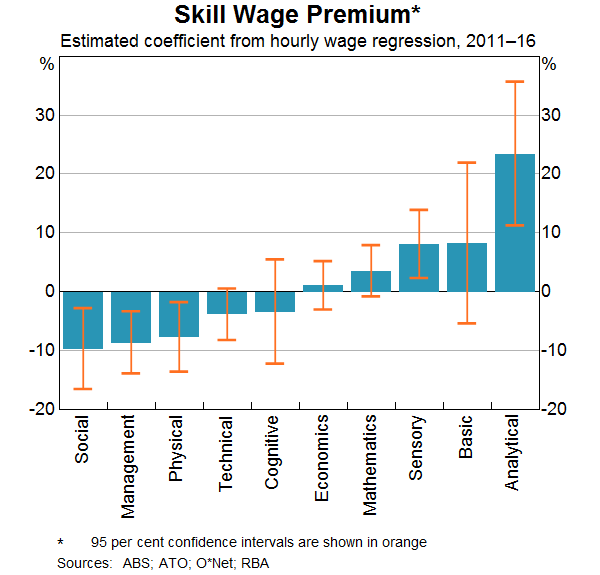
Sensory skills, which are required in defence and transport occupations, also attract a statistically significant wage premium. The wage estimates for basic skills and other cognitive abilities have wide error bands. This suggests that these skills are strongly related with other skills, so that the model has difficulty distinguishing the value of these skills. An increase in technical, social, physical or management skills is associated with a wage penalty – that is, the coefficients on those variables are negatively signed. However, it is important to keep in mind that we are not estimating causal effects and have not controlled for all relevant personal characteristics or working conditions of a job. For this reason, our estimates should be treated with caution. It is also worth noting that occupations that utilise social or technical skills, for example, can be valuable for society and individuals in other ways; our results only reflect monetary compensation for a skill. Furthermore, our estimates reflect current wage outcomes. The demand for, and supply of, skills can change over time, in which case the wage premiums for those skills is likely to change.
The ATO data suggest that the average wage for an economist over the period 2011–16 was $63 per hour, compared to the average wage of $43 in other occupations requiring tertiary-equivalent training. Our estimated model suggests this relatively high wage for economists arises because the skills required in the economics profession, such as maths and analytical thinking, are highly valued in the labour market relative to other skills. A small component of the relatively high wages earned by economists cannot be explained by our model, with the model under-predicting economists' wages by 8½ per cent. This might reflect the greater concentration of economists in public-sector employment, as employees in the public sector tend to earn more, on average, than in the private sector (Mahuteau et al 2017). However, with the available data, we cannot tell whether this holds specifically for economists.
Conclusion
The Bank has increased its efforts to encourage more students to study economics at school and university. This could improve the quality of public discourse and have benefits for society as a whole. Our analysis suggests that an economics degree also confers substantial private benefit to graduates in terms of their earnings, relative to many other degrees. This arises from the development of analytical and maths skills, which command a wage premium in the labour market. However, our analysis also reveals that the probability of finding work as an economist is low, given the small number of jobs relative to qualified graduates. Nonetheless, the wide range of disciplines in which economics graduates work suggests it is a degree that is useful beyond the narrow discipline. As Heath (2017) explained, doing an economics degree appears to give one a set of skills that are currently rewarded quite well and looks set to continue in importance in the future.
Appendix A Skills and Earnings Data Sources and Construction
Skills and the O*Net Database
The O*Net database provides information on the importance of different types of skills, abilities and knowledge for over 1,000 occupations. We focus on the ‘importance’ scores in O*NET, based on the advice in Sanchez and Autor (2010). These O*Net measures are divided into three major domains:
- Skills: developed capacities that facilitate learning or the more rapid acquisition of knowledge.
- Abilities: enduring attributes of the individual that influence performance
- Knowledge: organised sets of principles and facts applying in general domains.
We use all three domains to construct our skill variables. As such, what we refer to as ‘skills’ is actually a mixture of skills, ability and knowledge measures from the O*Net database. Although the abilities are designed to measure innate attributes of individuals, in practice there are many abilities, such as mathematical reasoning and written expression, which can be learnt or improved upon by further work and study. The database includes additional job attributes, such as interests, work styles and work activities, but we do not examine these.
We collapsed the 89 O*Net measures into 10 categories (Table A1). Many of the skill categories are related to each other, so a wage regression would suffer from severe multicollinearity if we included them all. The categories needed to have sufficient information on the skills used most intensely by economists, so we could draw conclusions about the monetary value of studying an economics degree. To do this we first examined the most important skills for economists relative to other high-skill jobs. This showed that economists require a high proficiency at maths, reasoning, problem solving and judgement, relative to other highly skilled jobs. As such, we include these as separate categories in our analysis so that we can isolate the wage premium for skills that are used intensively in economics. To construct the remaining categories we are largely guided by the existing classifications of the O*Net measures (along with a crosscheck using a statistical cluster analysis). For example, the ‘maths’ score is the average of four different O*Net measures that capture the ability, skill and knowledge in maths required to perform a job. These classifications are similar to using cluster analysis on the occupation-level O*Net data.
| Domain | |||
|---|---|---|---|
| Skills | Abilities | Knowledge(a) | |
| Analytical thinking | Complex problem solving; critical thinking; judgement and decision making; systems analysis; systems evaluation | Deductive reasoning; inductive reasoning | |
| Basic skills | Active learning; active listening; learning strategies; monitoring; reading comprehension; science; speaking; writing | ||
| Economics | Economics and accounting | ||
| Other cognitive | Category flexibility; flexibility of closure; fluency of ideas; information ordering; memorisation; oral comprehension; oral expression; originality; perceptual speed; problem sensitivity; selective attention; spatial orientation; speed of closure; time sharing; visualisation; written comprehension; written expression | ||
| Management | Management of financial resources; management of material resources; management of personnel resources; time management | ||
| Mathematics | Mathematics; programming | Mathematical reasoning; number facility | Mathematical knowledge |
| Physical abilities | Arm-hand steadiness; control precision; dynamic flexibility; dynamic strength; explosive strength; extent flexibility; finger dexterity; gross body coordination; gross body equilibrium; manual dexterity; multi-limb coordination; rate control; reaction time; response orientation; speed of limb movement; stamina; static strength; trunk strength; wrist-finger speed | ||
| Sensory abilities | Auditory attention; depth perception; far vision; glare sensitivity; hearing sensitivity; near vision; night vision; peripheral vision; sound localisation; speech clarity; speech recognition; visual colour discrimination | ||
| Social skills | Coordination; instructing; negotiation; persuasion; service orientation; social perceptiveness | ||
| Technical skills | Equipment maintenance; equipment selection; installation; operation analysis; operation and control; operation monitoring; quality control analysis; repairing; technology design; troubleshooting | ||
|
(a) All other knowledge categories are omitted. Sources: O*Net; RBA |
|||
Occupation-level Wage Data
Occupations in Australia are classified at the detailed 4-digit level. These occupations are then mapped to US occupations in the O*Net database using concordances provided by the ABS and the BLS. In the cases where the occupation codes do not line up one-to-one, the O*Net scores are aggregated using weights derived from US employment data.
We use data on average financial-year wage income by 4-digit occupation and sex from the ATO. A shortcoming of the dataset is that it does not include all wage earners. In particular, low income earners who earned below the tax-free threshold, or others who may not have lodged a tax return even if required, will not be included. The Census is an alternative source of earnings data, but it also has limitations: it measures total income from all sources, rather than just wages; and the data are only available in ranges and are perturbed by the ABS to ensure confidentiality. Nonetheless, we obtain similar regression results whether we use income data from the ATO or the Census.[5]
Wage Regression Model
We use the following regression to estimate the wage return to various skills (conditional on other skills),
where the dependent variable is the log of average hourly wages of sex in occupation in year . The key explanatory variables are the 10 skill categories , which are standardised to have a zero mean and unit standard deviation. The coefficient on this skill variable is the return to skill, or skill wage premium. As a proxy for ‘potential experience’ and seniority we control for the age composition of each group at the time of the 2011 Census .[6] We also include sex and year effects , along with a full set of interactions between sex and year, and sex and age. This specification is equivalent to estimating separate regressions for males and females, but constraining the effects of skills to be the same for males and females. While this regression is not designed to capture sex differences in wage rates, it is noteworthy that both males and females had a similar pattern of wage skill premiums.
We also consider specifications where the dependent variable is the log of the annual earnings. This yields the effect of a change in a given skill on yearly wages – both through its effects on the hourly wage and through hours worked in a year. This ‘total effect’ may be of interest if we think that some skills are more likely to lead to a greater propensity to work longer hours. The results using yearly wages are similar to those for hourly wages.
Our preferred specification pools annual ATO data across the six-year period spanning 2010/11 to 2015/16. Relative to using a single cross-section of data, this makes our estimates more robust to particular events affecting the labour market in specific years and improves the precision of our estimates. We cannot easily control for occupation-fixed effects because our skill measures do not vary over time, and so we estimate a random effects model (with standard errors clustered at the occupation level).
Using occupation-level data is a novel way to examine the skill wage premium in Australia. The existing literature tends to measure skill using individual test scores on a particular skill dimension, such as literacy or cognition (Barrett 2012; Chesters, Ryan and Sinning 2013; Hanushek et al 2017; Shomos and Forbes 2014). A limitation to that approach is that one's paid job may not rely on that skill being used or useful for that role. For instance, if an artist has high numeracy skills, and earns a low wage, we would understate the return to numeracy. We are also able to compare the wage premium for various skills (as well as knowledge and ability requirements), rather than measuring a single skill.
Footnotes
The authors are from Economic Group. [*]
Over time, the number of people studying economics has tracked sideways at around 1,200 to 1,500 graduates per year over the past four decades. Some people would have studied some economics, but not majored in it or studied it in their highest degree, and so are not included in these figures. [1]
Tetlow (2018) shows a similar phenomenon in the United Kingdom. [2]
The Census income measure includes both wage and non-wage income (such as from investments and transfers). The data shows how many people have income within a certain range. To convert this to an estimate of average earnings, we use the midpoint of each range (and assign a value of $156,000 to the top category). We ignore missing, negative or zero incomes. [3]
A formal qualification may also send employers a signal that one possesses certain abilities, aside from any knowledge or skills developed during the process of obtaining the qualification. Wage differences may also arise if higher wages compensate for a risky or unpleasant aspect of a job (such as a dangerous or remote mining job). [4]
A key difference is that the skill premium for analytical is not as outsized relative to other skills, and that basic skills have a large and significant wage premium. [5]
Age is modelled using 11 variables capturing the share of employment in each 5-year age range (from 15–19 years to 60–64 years and 65 years and over, with 15–19 years being the omitted category). [6]
References
Barrett GF (2012), ‘The Return to Cognitive Skills in the Australian Labour Market’, Economic Record, 88(280), pp 1–17.
Chesters J, C Ryan and M Sinning (2013), ‘The Returns to Literacy Skills in Australia’, National Vocational Education and Training Research Program Research Report. Available at <https://www.ncver.edu.au/publications/publications/all-publications/the-returns-to-literacy-skills-in-australia>.
Dwyer J (2017), ‘Studying Economics: The Decline in Enrolments and Why it Matters’, Address to the Business Educators Australasia Annual Council Meeting, Sydney, 29 July.
Dwyer J (2018), ‘What Happened to the Study of Economics?’, Address to the Business Educators Australasia Annual Meeting, Sydney, 26 May.
Hanushek E, G Schwerdt, S Wiederhold and L Woessmann (2017), ‘Coping with Change: International Differences in the Returns to Skills’, Economics Letters, 153, pp 15–19.
Heath A (2017), ‘Skills for the Modern Workforce’, Remarks to the Career Education Association of Victoria Conference, Melbourne, 1 December.
Mahuteau S, K Mavromaras, S Richardson and R Zhu (2017), ‘Public–Private Sector Wage Differentials in Australia’, Economic Record, 93(1), pp 105–121.
Sanchez JI and DH Autor (2010), ‘Dissent’, in NT Tippins and ML Hilton (eds), A Database for a Changing Economy: Review of the Occupational Information Network (O*NET), Panel to Review the Occupational Information Network (O*NET), The National Academies Press, Washington, pp 195–197.
Shomos A and M Forbes (2014), ‘Literacy and Numeracy Skills and Labour Market Outcomes in Australia’, Productivity Commission Staff Working Paper, May. Available at <http://www.pc.gov.au/research/supporting/literacy-numeracy-skills>.
Tetlow G (2018), ‘Where Are All the Female Economists?’, Financial Times, 12 April. Available at <https://www.ft.com/content/0e5d27ba-2b61-11e8-9b4b-bc4b9f08f381>.
