Speech Demographic Change and Recent Monetary Policy
It is a pleasure to be able to speak at the Anika Foundation lunch for a second time. As the father of three teenage children I know how important the work of the foundation is. Thank you all very much for your support.
Today, I would like to talk about a long-run topic and a short-run topic. The long-run topic is Australia's demography and the short-run topic is current monetary policy in Australia. These might seem to be unrelated topics. But at the RBA, we are very aware that our decisions about interest rates are not made in a vacuum – that they are influenced by structural developments in our economy. And one of these important structural factors is changes in our demography.
Indeed, Australia's demographic profile is more positive than those of many other countries. It is one of the factors that provides a basis for optimism about the future of our economy. Many countries are rightly concerned about their population dynamics, their ageing workforces and their rapidly rising old-age dependency ratios. We, too, need to keep an eye on these issues, but we are in a better position than many others. This, in part, reflects policy decisions, including about the level and composition of immigration, and retirement income policy. I would like to take this opportunity to talk about these issues, before turning to monetary policy.
Population Dynamics
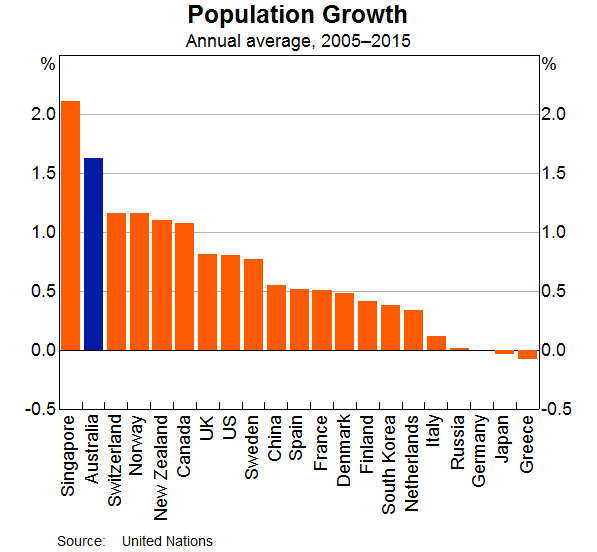
According to the latest estimates, there are now 25 million people living in Australia. Over the past decade, our population has grown at an annual rate of more than 1½ per cent. This is faster than in previous decades and it is also noticeably faster than population growth in most other advanced economies (Graph 1). Over the past decade, most countries have experienced average annual population growth of less than 1 per cent and a number of countries have experienced stagnant or declining populations. This is an important difference, with Australia's faster population growth being one of the reasons our economy has experienced higher average growth than many other advanced economies.
The increase in Australia's population growth over the past decade is largely due to increased immigration; the rate of natural increase has not changed that much (Graph 2). Over recent times, net overseas migration has, on average, added around 1 per cent to our population each year. The increase from natural sources has averaged around 0.7 per cent per year.
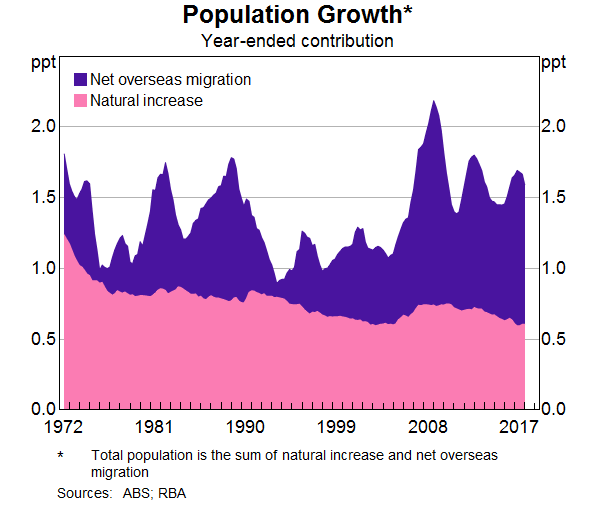
There has been a reasonable amount of year-to-year variation in net overseas migration. Migration increased sharply at the height of the resources boom when demand for skilled labour was very strong, and then subsequently declined as the mining investment boom came to an end. In this way, migration has helped our economy adjust to large swings in the demand for labour. It has also helped address some particular skills shortages.
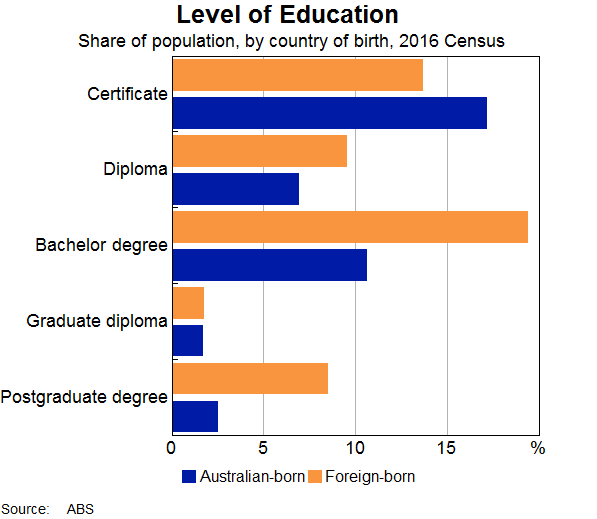
A second factor that accounts for the step-up in the level of migration and the year-to-year variation is a marked increase in the number of overseas students studying in Australia and changes in the policies around student visas. There are currently more than 500,000 overseas students studying in Australia. Over recent times, it has been common for around one-sixth of foreign students to stay and live and work in Australia after completing their studies.[1] This has boosted our population. It has also boosted the nation's human capital. People living in Australia who were born overseas are more likely than the average Australian to have a post-secondary school qualification (Graph 3). We also benefit from stronger overseas connections when foreign students return home after studying in Australia.
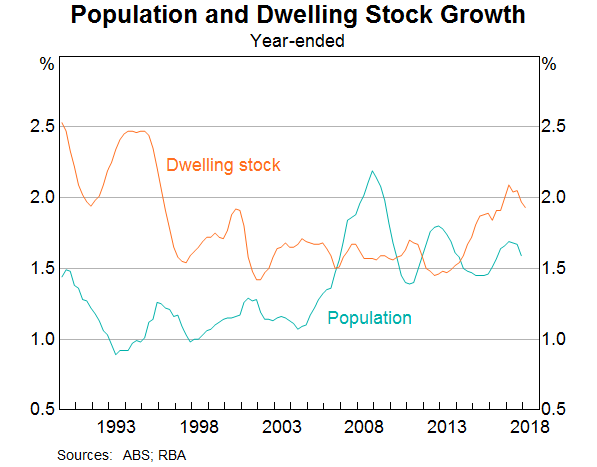
The effects of faster population growth on our economy and society are complex and they are widely debated. As a number of commentators have noted, population growth has put pressure on our infrastructure. As a country, we were slow to increase investment in infrastructure to meet the needs of our more rapidly growing population. Investment in this area has now picked up, particularly in transport, which, in time, will help alleviate some of the pressures. We were also slow to increase the rate of home building in response to the faster population growth. Indeed, it took the better part of a decade for this adjustment to take place (Graph 4). This slow adjustment is one of the factors that contributed to the large increases in housing prices in some of our cities over recent times. The adjustment, though, has now taken place, with growth in the number of dwellings exceeding growth in the population over the past four years.
I have spoken about these adjustments on previous occasions. Rather than cover this material again, I would like to focus on something that receives less attention, but is no less important – that is, how the changes in our population dynamics have affected some of Australia's key demographic indicators.
Of particular importance is the fact that, on average, new migrants to Australia are younger than the resident population. Workers coming to Australia tend to be relatively young and so too, obviously, are most students. The median age of new migrants is between 20 and 25, which is more than 10 years younger than the median age of the resident population. Over the past five years, over 80 per cent of net overseas migration has been accounted for by people under the age of 35 (Graph 5).
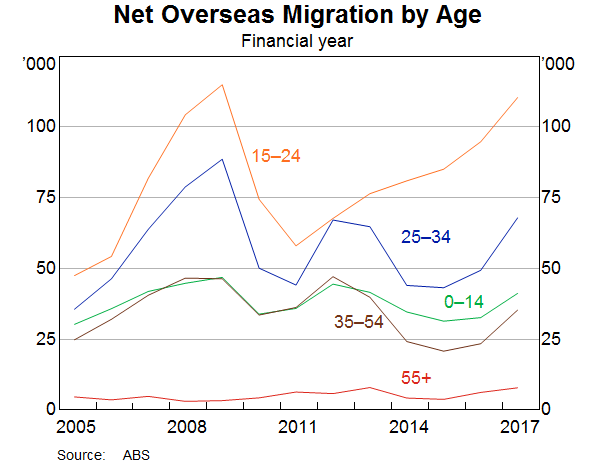
This inflow of younger people through immigration has significantly reduced the rate of population ageing in Australia.
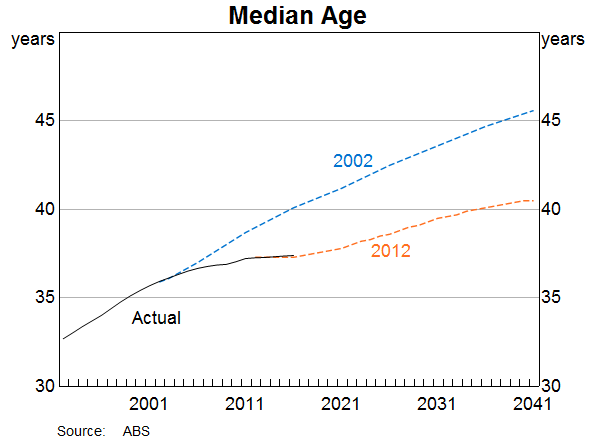
The median age of Australians is currently 37. Back in 2002, Australia was expected to age quite quickly, with the median age projected to increase significantly to over 45 by 2040 (Graph 6). But after a decade of increased immigration of younger people, the latest estimate is that the median age in 2040 will be around only 40 years. This is a big change in a relatively short period of time, and reminds us that demographic trends are not set in stone.
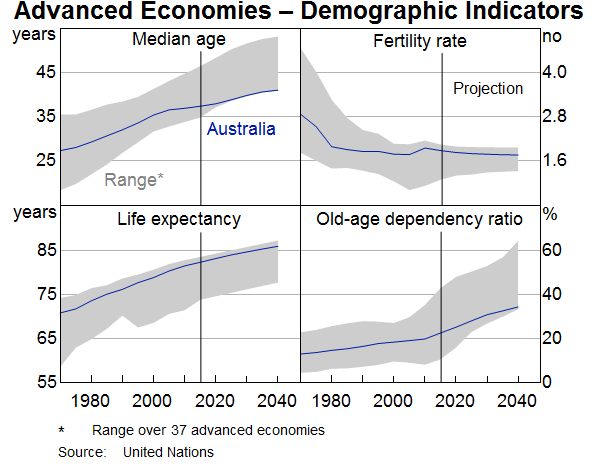
It is useful to put this change in an international context. To do this, the RBA's staff has examined demographic trends and projections over the next quarter of a century for 37 advanced economies using UN data.[2] This next graph shows four key demographic variables for Australia and the range of outcomes across these countries (Graph 7). Australia stands out in a number of dimensions:
- First, our median age of 37 makes Australia one of the youngest countries among the advanced economies. We are also ageing more slowly than most other countries, which means that we are projected to stay relatively young. This is different from the earlier projections, under which we were expected to move to the middle of the pack.
- Second, we have a higher fertility rate than most advanced economies. Australians tend to have larger families than those in many other countries.
- Third, our average life expectancy is at the higher end of the range, and is expected to continue to rise.
- Fourth, the old-age dependency ratio is rising, but less quickly than in most other countries. Our relative youth and higher fertility rates mean that the dependency ratio is expected to remain lower than elsewhere over the next generation. Beyond that, on current projections, it is then expected to increase quite significantly.
So, in summary, we are better placed than many other countries. The movement to Australia of large numbers of young people over the past decade has changed our demographic profile in a positive way. This has implications for future economic growth and the pressures on government budgets. This immigration has also boosted the nation's human capital.
Ageing and Labour Force Participation
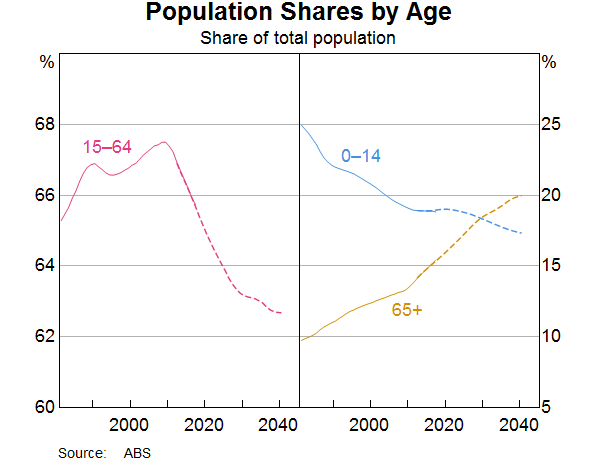
I would now like to turn to some of the implications for labour force participation of our changing demographics. While we remain a relatively young country, we are still ageing. Even with the large increase in relatively young migrants, the share of the Australian population aged 15–64 is declining, after increasing for many years (Graph 8). This decline is projected to continue for at least a generation, reflecting a combination of the ongoing transition of baby boomers into retirement ages, lower fertility rates and increased life expectancy. By 2040, around 20 per cent of the population is expected to be over 65, compared with 15 per cent currently.
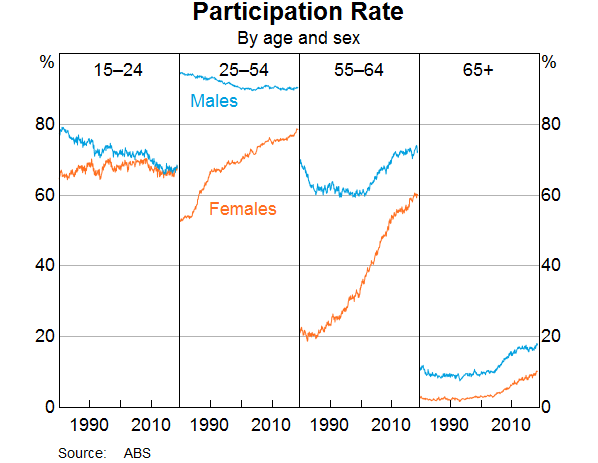
All else equal, as the population ages, the proportion of people who are working could be expected to decline. But all else is not equal. In Australia, we are seeing shifts in behaviour that have, to date, more than offset the effects of ageing on labour supply. In particular, the participation rates for men and women aged over 55 have increased significantly over the past two decades or so (Graph 9).
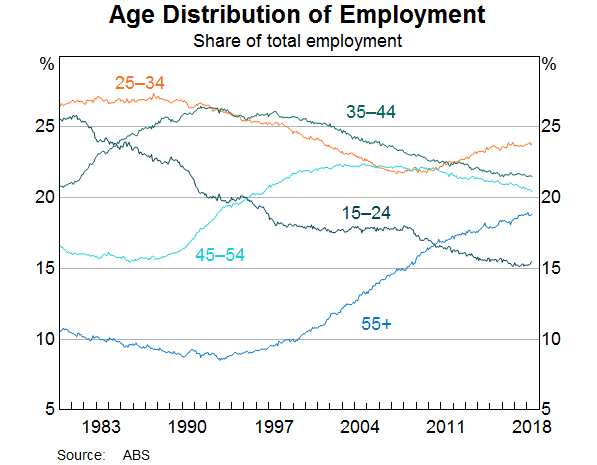
This increase in the number of older Australians and the rise in their labour force participation means that nearly one in five employees are aged over 55 years. This compares with less than one in 10 in the 1980s and 1990s (Graph 10).
There are a range of factors that are at work here.
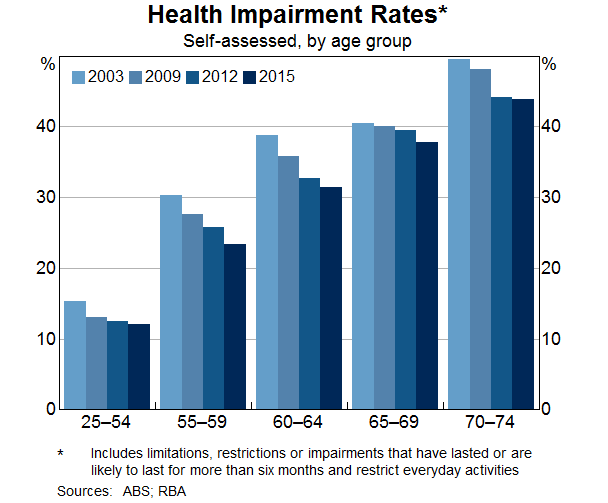
One is the improvement in health outcomes for older people. One way of measuring this improvement is through the responses to an Australian Bureau of Statistics (ABS) survey in which individuals are asked to assess whether they have a health impairment that restricts their everyday activities (Graph 11). Over the past decade and a half there has been a significant decline in the share of people over 55 reporting that they have such an impairment. This improvement in health is allowing people to stay in the workforce longer. Greater acceptance of flexible work practices is also supporting this change.
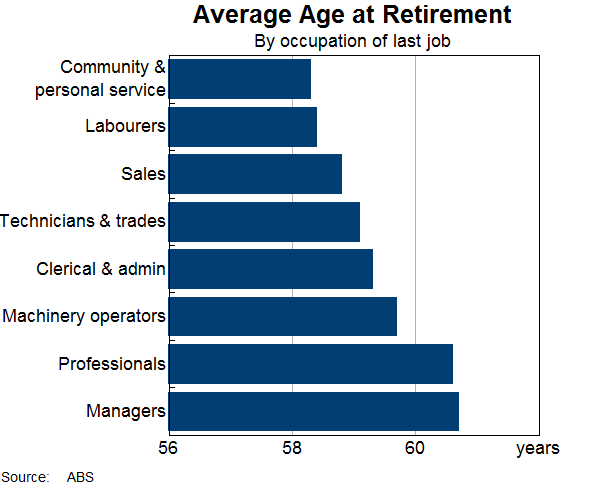
A related development is the ongoing shift in economic activity towards service industries, which tend to be less physically demanding on the body. On average, labourers have one of the youngest retirement ages and managers and professionals have the oldest retirement ages (Graph 12). As the type of work we do changes, it seems that more of us are in a position to spend more years working.
Another factor that has encouraged increased participation by older workers is the changes to retirement income policies. In another ABS survey, the most common reason cited by retirees for their decision to retire is eligibility for superannuation and/or the age pension. The importance of this reason has increased through time, perhaps because other factors – such as health – have become less binding. It seems reasonable to suggest then that the increase in the pension eligibility ages, particularly for women, and the increase in the preservation age for those with superannuation are both likely to have boosted labour force participation.
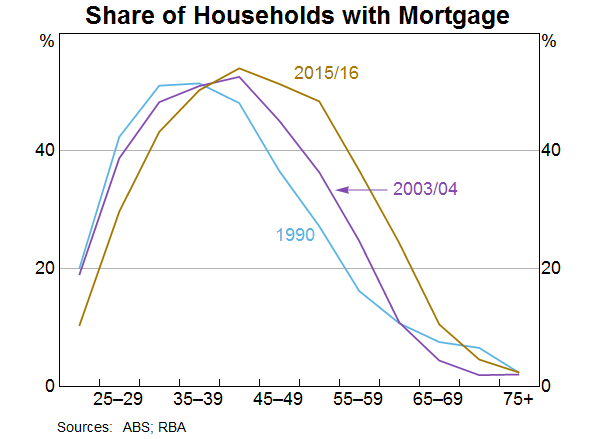
A third set of factors is related to other financial considerations. For some people, increased life expectancy could be expected to lead to delayed retirement because of the need to increase savings to finance a longer life. A loss of wealth during the global financial crisis is likely to have had the same effect. Another financial consideration influencing retirement decisions is the tendency for people to carry debt later in life (Graph 13). The causation here, though, runs both ways. An expectation that one will work for longer makes it possible to carry debt for longer. But for other people, the tendency to buy homes later in life and the fact that the real value of debt erodes more slowly than it used to, is likely to see them stay in the workforce longer.
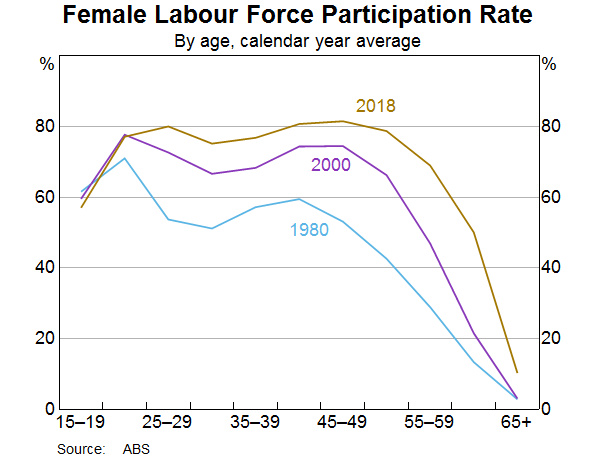
Finally, the increased participation of older women is also an extension of the ongoing increase in female labour force participation across nearly all age groups that has been boosting labour supply in Australia for many decades (Graph 14). This shift has been encouraged by policy changes related to parental leave and child care, and the increased prevalence of flexible and part-time work. Changing societal attitudes and increased time spent in education have also played a role. As a result, the labour force participation rates of younger women no longer display such a pronounced dip as they progress through their child-bearing years, because fewer leave the labour force entirely when they have children, although their hours worked do still show a dip.
So, together, better health outcomes, changes in the nature of work and retirement income policies, financial incentives and the general trend towards greater female participation in the labour force are all boosting the participation rate for older Australians.
The overall picture is one of constructive adjustment to our changing demographics. This is another illustration of the flexibility of the Australian economy. As our population continues to age, further adjustment is likely to be needed. But as I spoke about earlier, Australia is better placed to deal with population ageing than most other advanced economies.
The Near-term Outlook and Monetary Policy
I would now like to shorten my gaze a little and turn to the near-term outlook for the Australian economy and the implications for monetary policy.
The RBA will be releasing its latest forecasts for the economy on Friday. The outlook for GDP growth is little changed from that we have had for some time. Our central scenario remains for growth in the Australian economy to average a bit above 3 per cent in 2018 and 2019. The latest data have been consistent with this.
We also still expect the unemployment rate to move lower over time and to reach 5 per cent at some point over the next few years. An unemployment rate of 5 per cent is the conventional estimate of full employment in Australia, but it is possible that we could go lower than this on a sustained basis. Time will tell.
In terms of inflation, the latest data were in line with our expectations. Over the year to June, headline inflation was 2.1 per cent and, in underlying terms, inflation was close to 2 per cent. Both measures are higher than the average of recent years.
Over the forecast period, we expect inflation to increase further to be close to 2½ per cent in 2020. In the short term, though, we would not be surprised if headline inflation dipped a little, reflecting declines in some administered prices in the September quarter. Electricity prices in some cities have declined recently after earlier large increases, and changes in government policy are likely to result in a decline in child care prices as recorded in the CPI. There have also been changes to some state government programs that are expected to lead to lower measured prices for some services. Together, these changes mean that our forecast for headline inflation for 2018 is now 1¾ per cent.
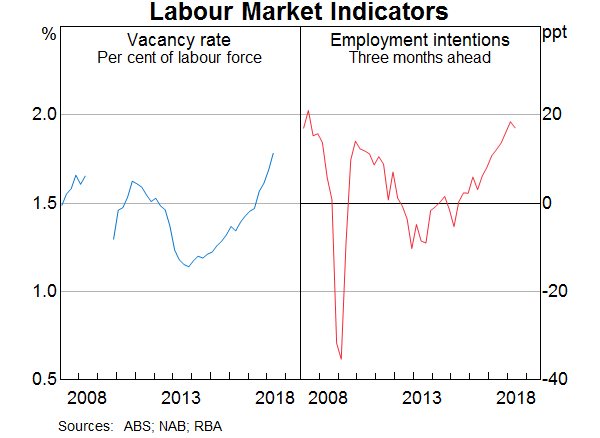
Looking beyond these short-run dynamics, inflation is still expected to rise as the economy moves closer to full employment. The labour market is gradually tightening and it is reasonable to expect that this will lead to a lift in both wages growth and inflation. This tightening of the labour market is evident in the steady increase in job vacancies, with the number of vacancies, as a share of the labour force, at the highest level in many years (Graph 15). It is also evident in the increase in the number of firms reporting that it is difficult to find workers with the necessary skills. As expected, the tighter labour market is leading to higher wage outcomes in certain pockets of the labour market. Over time, we expect that this will become a more general story, although this is going to take some time.
In terms of the financial risks facing the economy, things have also been broadly moving in the right direction. For a number of years, risks were rising due to the nexus of high and rising levels of debt and escalating housing prices. Over the past year, though, housing price declines in the largest cities have reversed a small part of the earlier gains. Borrowing by investors has also slowed considerably, largely because of reduced demand by investors. There has also been a tightening of credit standards. While banks are competing strongly for customers with low credit risk, their appetite to lend to riskier borrowers has lessened a bit. Some of the non-bank lenders are providing credit to these borrowers.
This change in financial trends has helped reduce the build-up of risk. It is helpful that this change is taking place at a time when the world economy is growing strongly, the unemployment rate is trending lower and the economy is recording good growth. This is assisting with the adjustment and means that, notwithstanding the changes in the housing market, we still expect consumption growth of around 3 per cent over each of the next couple of years. We do, though, need to keep a close eye on the housing market and housing finance.
So, in summary, we see reasonable prospects that the economy will record good growth, the unemployment rate will come down gradually and that inflation will increase over time. This is a favourable outlook.
If this is how things evolve, you could expect the next move in interest rates to be up, not down. As the economy strengthens and income growth and inflation lift, it would be natural for interest rates to return towards more normal levels.
The timing of any future change in interest rates is dependent upon the speed of the progress that is made in reducing the unemployment rate and having inflation return to around the midpoint of the target range on a sustained basis. If we were to make faster progress than we currently expect, any future increase in interest rates is likely to be earlier. Conversely, slower progress would likely see a longer period without an adjustment.
For the time being, the Reserve Bank Board's judgement remains that the best course is to maintain the cash rate at its current level. Given that the progress in reducing unemployment and lifting inflation is expected to be only gradual, the Board does not see a strong case for a near-term adjustment in monetary policy. The Board is seeking to be a source of confidence and stability to support the progress that the Australian economy is making.
Thank you for listening and I welcome your questions.
Endnotes
I would like to thank Andrea Brischetto, Merylin Coombs and Angus Moore for assistance in the preparation of this talk. [*]
The Treasury and the Department of Home Affairs (2018), ‘Shaping a Nation’, Treasury Research Institute External Papers, April. [1]
Brown A and R Guttmann (2017), ‘Ageing and Labour Supply in Advanced Economies’, RBA Bulletin, December, pp 37-45; United Nations, Department of Social Affairs, Population Division (2017), World Population Prospects: The 2017 Revision, Volume 1: Comprehensive Tables. [2]
