Submission to the Inquiry into Home Ownership Proportion of Investment Housing Relative to Owner-Occupied Housing
House of Representatives Standing Committee on Economics
- Download 4.73MB
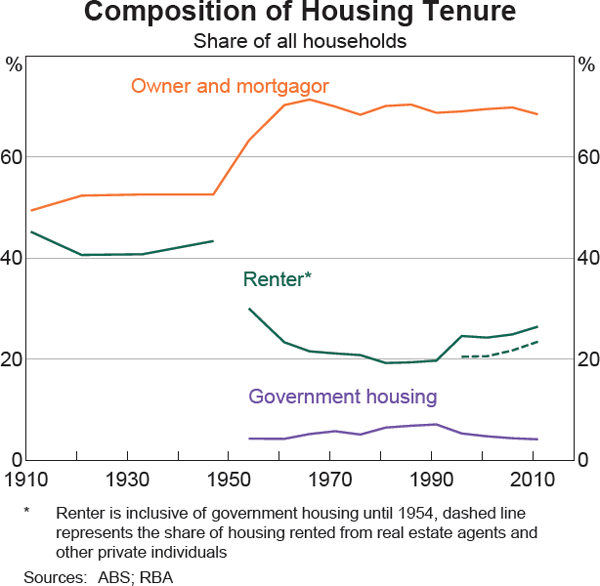
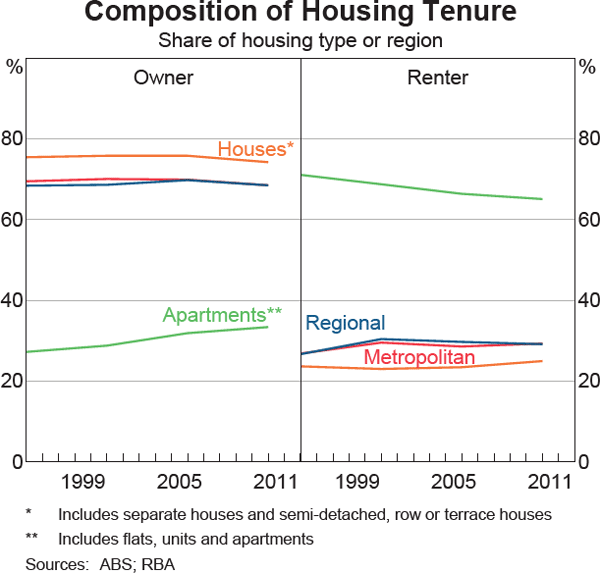
Data on the proportion of the housing stock owned by investors and owner-occupiers are not readily available. However, data on household's tenure type from the Census should be a good proxy.[5] These data suggest that in 2011 around 68 per cent of the occupied housing stock was owned by owner-occupiers (as discussed above). Government-owned housing made up a further 5 per cent of the housing stock.[6] The remaining 26 per cent of occupied housing was rented, from a wide range of sources.[7] The share of housing rented from real estate agents and other private individuals, which could be assumed to be owned by individual investors, was somewhat less at 23 per cent (Graph 22).[8] The proportion of the housing stock owned by investors appears similar in metropolitan and regional areas, but by housing type, investors own a much larger proportion of the apartment stock (around two-thirds) than the stock of houses (around one-quarter) (Graph 23).
Data on the number and value of housing loans outstanding suggest a similar pattern. Around 30 per cent of the number of outstanding housing loans are to investors (with a slightly larger proportion by value).[9] This is a little larger than the apparent share of the housing stock owned by investors, reflecting investors' greater propensity to have a mortgage compared with owner-occupiers.
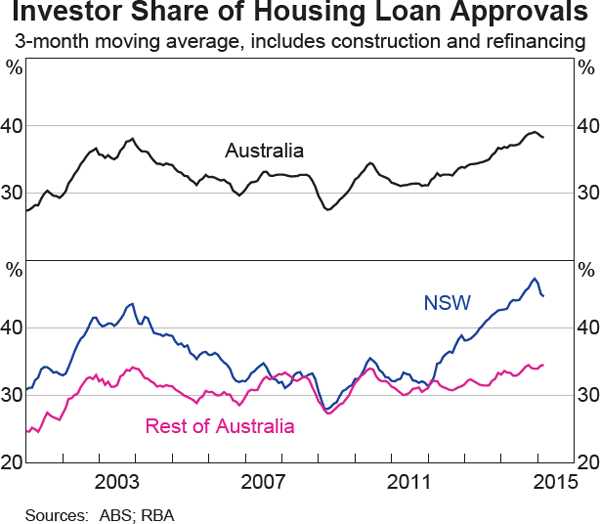
The proportion of the housing stock owned by investors looks to have risen over recent decades, offsetting the decline in the prevalence of public housing (leaving the proportion of the housing stock owned by owner-occupiers – the home ownership rate – relatively stable, as discussed earlier). The investor share is also likely to have risen a little further over the past few years, as investors have accounted for an increasing share of property purchases since 2012. Data on the proportion of residential property transactions that involve investors as purchasers or sellers are not readily available, but loan approvals data give some guide as to the prevalence of investors as purchasers. Investors' share of loan approvals has risen from a little over 30 per cent in 2011 to almost 40 per cent recently, with the increase most pronounced in New South Wales (Graph 24).
As noted in RBA (2014b), prudent limits on loan sizes are less binding for property investors that have significant equity to deploy than for some other purchasers. As discussed above, typically the interest rate used to calculate allowable loan sizes does not fall as much as actual interest rates, or only up to a point; this practice has been strengthened recently in light of recent guidance issued by APRA (2014). This means the marginal borrower has less scope to increase their loan size as interest rates fall. This practice is in the long-term interest of borrowers, as it helps ensure they can still service the loan once interest rates rise again. However, it does mean that borrowers for whom these constraints are not binding appear to have a relative advantage during periods of low interest rates, since they can increase their loan size and make larger offers for specific properties. In the Australian environment, the most constrained borrower is usually a first home buyer and the less constrained borrowers are investors or trade-up buyers with considerable equity. As such, this might help to explain the low share of first home buyers in recent new lending for housing. Reductions in state government incentives for first home buyers (of established housing) could also have contributed to this outcome. It also implies that the increase in investor demand is likely to have contributed to the recent strong growth in housing prices, particularly in Sydney.
The increase in investor activity and strong growth in housing prices, among other developments, has raised concerns about risks emerging in the housing and mortgage markets. In response to these concerns, APRA announced measures in December 2014 to reinforce sound housing lending practices (APRA 2014). This included a benchmark for lenders' growth in investor housing lending of 10 per cent, above which supervisory action may be intensified. With total lending to investors growing at a little above 10 per cent over the past year, these measures are intended to result in some moderation of investor borrowing and purchasing activity in the period ahead, although it will take some time before the existing pipeline of approvals and pre-approvals are worked through.
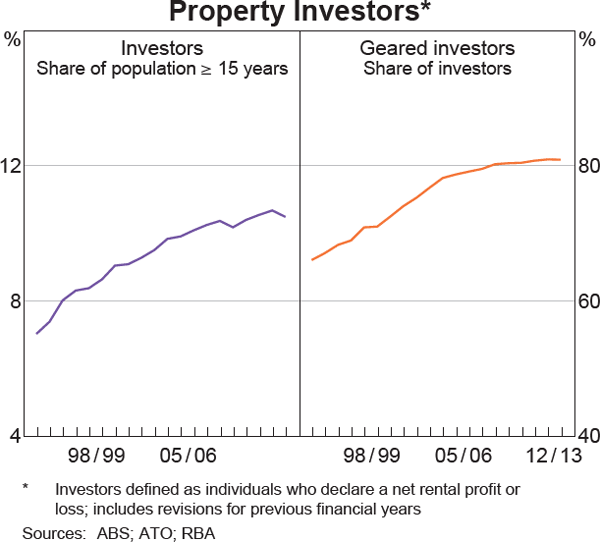
Tax data show that the share of the population aged 15 years and over with an investment property grew steadily through the 1990s and early 2000s, before broadly stabilising in the late 2000s at around 10 per cent (Graph 25). Over the same period, the share of these investments that were geared – where the investor claimed interest deductions – increased steadily before levelling off at a little over 80 per cent. The share of investors that declared a net rental loss, taking advantage of the tax benefits of negative gearing, was just under two-thirds in 2012/13, having increased from around half in the late 1990s.
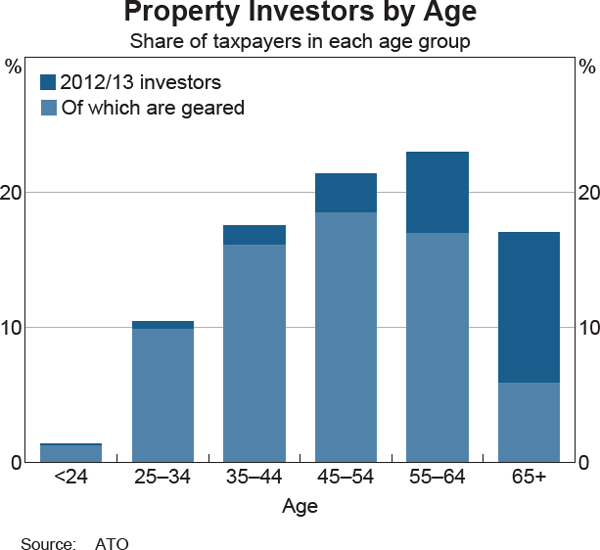
Data from household surveys and the tax office suggest that the propensity to own an investment property increases with age, as with owner-occupation, but declines after the age of 65, consistent with households drawing on investments to fund retirement (Graph 26). Since the early 2000s there have been some notable changes in the distribution of investment and gearing across age groups. In particular, the share of property investors that are aged 60 years and over has increased significantly. According to tax data, this shift in the distribution of investors towards older individuals reflects both the ageing of the population as well as an increase in the propensity to own investment property within this age group (RBA 2014a). Tax data suggest that older individuals have also become more likely to have a mortgage against their property investment, with around one-third of investors aged 65 and over claiming interest deductions from their total incomes in 2012/13. Nonetheless, borrowing remained far more prevalent among younger investors, with almost all investors below the age of 45 years being geared.
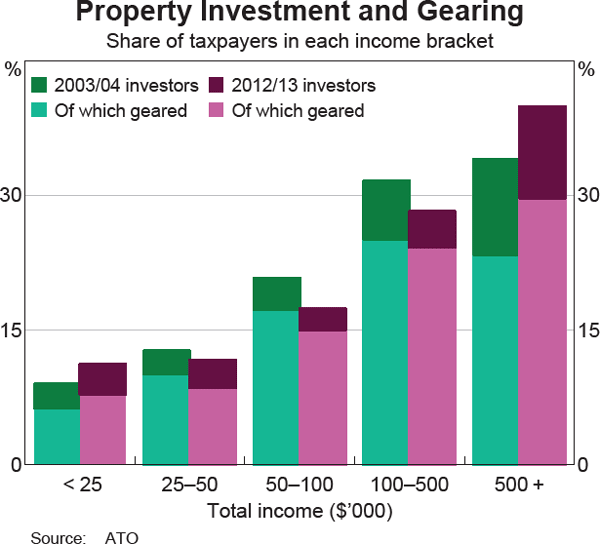
Tax data also show that the incidence of property investment and the incidence of geared property investment both increase with income (Graph 27).[10] While the incidence of property investment fell between 2003/04 and 2012/13 for most income levels, it increased for those with very low incomes and those with very high incomes. For investors with very low incomes, individuals aged 60 years or older comprised a larger share in 2012/13 than in 2003/04, as an increasing number of baby boomers owning investment properties entered retirement.[11] These investors may be more capable of servicing any investment property debt than their younger low-income counterparts. In particular, even though their total income (for tax purposes) is low, they are likely to have non-taxable sources of income, such as drawdowns from superannuation funds.
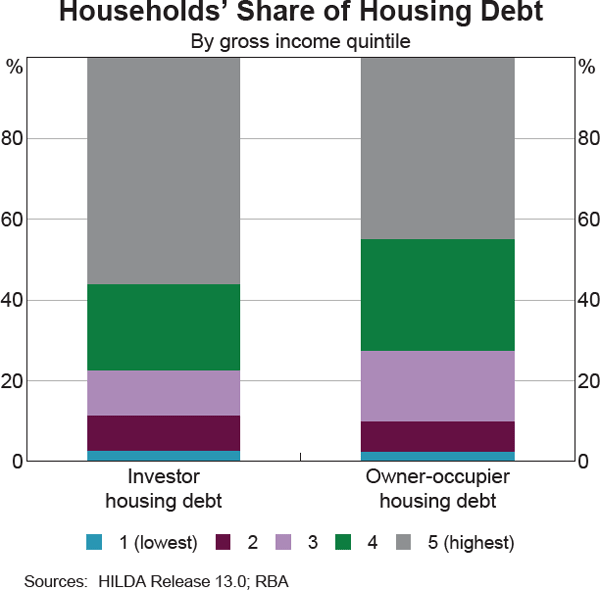
While the incidence of property investment increases with the level of income, the Household, Income and Labour Dynamics in Australia (HILDA) Survey also suggests that most investor households are in the top two income quintiles. These households hold nearly 80 per cent of all investor housing debt (Graph 28), and appear well placed to service their debt: they typically use less than 25 per cent of their income to service their total property debt, and around half are ahead of schedule on all their mortgage repayments (Table 1).[12]
| Gross income quintile | Ahead of schedule on total mortgage repayments | Median total housing debt repayments to gross income ratio | ||
|---|---|---|---|---|
| Per cent of households in each income quintile | Per cent | |||
| Owner-occupiers(a) | Investors(a) | Owner-occupiers(a) | Investors(a) | |
| 1 (lowest) | 36 | 26 | 50 | 128 |
| 2 | 48 | 26 | 30 | 46 |
| 3 | 48 | 38 | 25 | 35 |
| 4 | 55 | 44 | 19 | 24 |
| 5 (highest) | 62 | 49 | 16 | 21 |
|
(a) Most investors are also owner-occupiers, but some are not: according to HILDA, just over 3 per cent of households were investors but not owner-occupiers in 2010, with a median age of 37 years (compared with 50 years for all investor households) Sources: HILDA Release 13.0; RBA |
||||
Footnotes
Housing tenure of households as recorded in the Census differs somewhat from ownership of the housing stock because it does not provide information about the ownership of dwellings that were vacant on Census night, including (owner-occupied) holiday and second homes as well as vacant properties that are available for rent. [5]
This includes a small amount of housing classified in the Census as ‘other tenure type’. [6]
Including: (i) housing provided by state or territory housing authorities; (ii) housing provided by housing cooperatives and community and church groups; (iii) dwellings rented through a residential park, such as a caravan park; and (iv) housing provided by an employer. [7]
However, this includes dwellings rented by members of the owners' family as well as some holiday rentals. As noted above, the tenure data do not capture houses owned by investors that were not rented (such as holiday homes). According to the HILDA Survey, around 9 per cent of investment properties owned by households did not earn rent in the previous year. [8]
Lenders can have difficulty classifying loans by type of purchaser, so these figures will have a margin of error. [9]
Total gross (before-tax assessable) income includes wages and salaries, net rental income, net capital gains, income derived from financial assets and certain other income items. It excludes non-taxable sources of income such as pension streams and drawdowns from superannuation funds. The average total income per taxpayer was around $55,000 in 2012/13, excluding these non-taxable sources. [10]
The increase in lower-income individuals aged 60 years and over was also partly driven by changes to taxation of superannuation in July 2007. Total income as recorded on the individual's tax return fell for those aged 60 years and over, because some superannuation benefits that had previously been taxed became tax free and are therefore no longer recorded in total income. [11]
Debt servicing in the HILDA Survey is measured as ‘usual repayments’. For an amortising loan, it is likely to capture scheduled principal and interest repayments as well as any regular excess repayments made by the borrowers. [12]