Submission to the Inquiry into Home Ownership Home Ownership Rates
House of Representatives Standing Committee on Economics
- Download 4.73MB
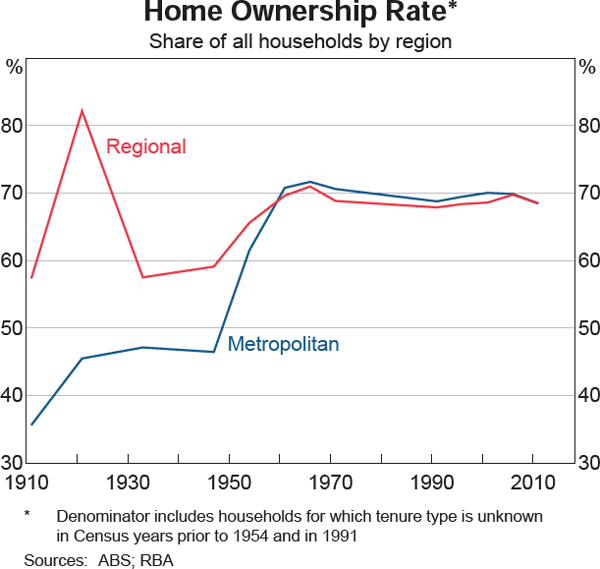
The Census is the best source of data on home ownership rates – the proportion of households that own the home they live in, whether with or without a mortgage – but it is neither frequent nor timely. The prevalence of home ownership in Australia increased considerably over the past century, but has been broadly stable at around 70 per cent since the 1960s (Graph 1). The increases were concentrated in the periods immediately after the two world wars, particularly World War II (WWII), as a result of significant government assistance including War Service Homes programs. According to the latest Census, around 68 per cent of Australian households owned their own home in 2011.

The first half of last century also saw a marked convergence in home ownership rates in metropolitan and regional areas (Graph 2). In the early 1900s, the rate was significantly higher in regional areas than in metropolitan areas, but this gap had closed by the late 1950s, with the post-WWII increase in home ownership much more pronounced in metropolitan areas. In the decades since, home ownership rates in regional and metropolitan areas have been very similar, even though housing prices are generally significantly lower in regional areas.
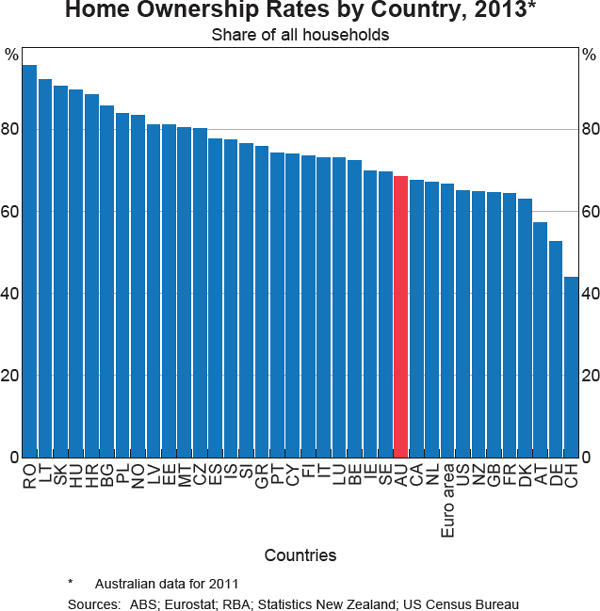
Home ownership rates vary significantly across countries, although most lie in the 60–80 per cent range (Graph 3). Australia's home ownership rate appears neither unusually high nor unusually low compared with that of other countries. There are a range of demographic, economic and institutional factors that can affect the level of home ownership, both through time and across countries. For example, strong government support for rental housing can lead to lower home ownership rates, such as in many western European countries including Germany. The tax treatment of housing, such as the deductibility of mortgage payments or the extent of capital gains tax, can also affect the relative attractiveness of home ownership and influence its prevalence. Differences in financial regulation, household structure, housing affordability, the age structure of the population, cultural values and population growth are other drivers of cross-country variation in home ownership rates.
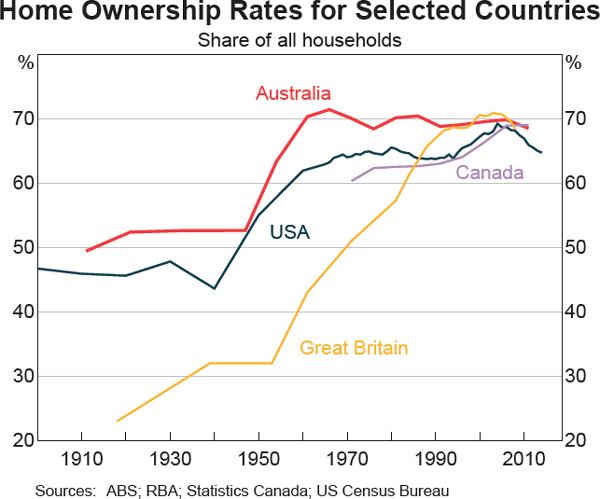
Despite large differences across countries, home ownership rates have tended to increase in many OECD countries over recent decades, although in the United States some of this increase has since reversed (Graph 4). In an OECD study, Andrews and Caldera Sánchez (2011) find that the trend increase can be partly explained by population ageing and rising real household incomes. They also suggest that mortgage market deregulation and innovation has contributed to higher home ownership rates, by increasing the capacity of credit-constrained households to access finance for home purchase. The privatisation of former public housing has also played a role in raising home ownership rates in some eastern European countries (Clapham et al 1996); a similar policy shift also explained much of the increase in ownership rates in the United Kingdom in the 1980s.
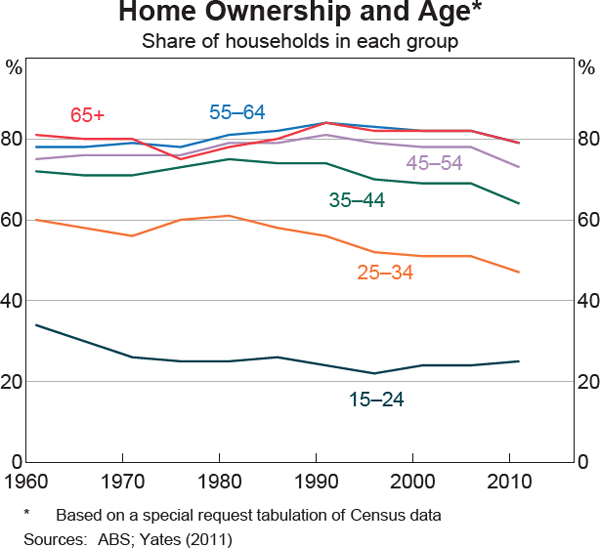
The general stability in home ownership in Australia over recent decades has masked some marked changes in home ownership among different age groups. In particular, there has been a pronounced decline in home ownership among younger households, particularly in the 25–34 and 35–44 age groups (Graph 5). Home ownership rates have generally been more stable among older households. The stability of the aggregate home ownership rate in the face of these trends has been driven by the ageing of the population. Given the clear tendency for home ownership to increase with age, consistent with the life-cycle theory of consumption and saving, the rise in the share of older age groups in the population will have tended to push up the aggregate home ownership rate, offsetting the reduced propensity of younger households to be home owners (Yates 2011).
The decline in home ownership among younger households has attracted considerable attention. In general, there are many interrelated factors that can affect the home ownership rate, whether at the aggregate level or for particular age groups (Yates 2011). These include:
- demographic and social factors, such as the distribution of the population by age or household structure
- economic factors, such as the relative cost of renting and owning or the level and distribution of (current and expected) household income
- institutional factors and government policies, such as the taxation of housing or the provision of public housing.
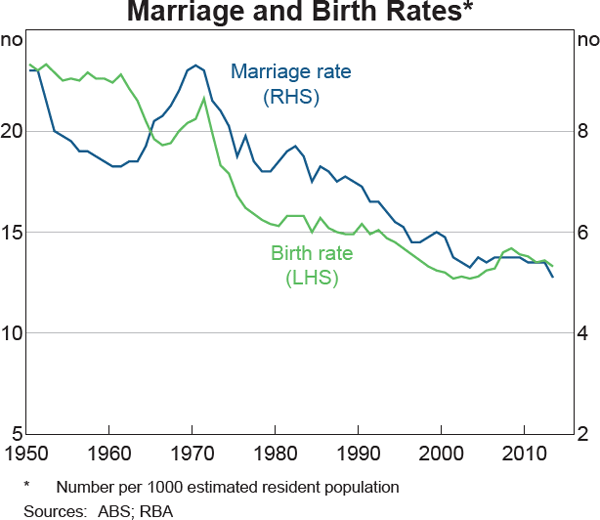
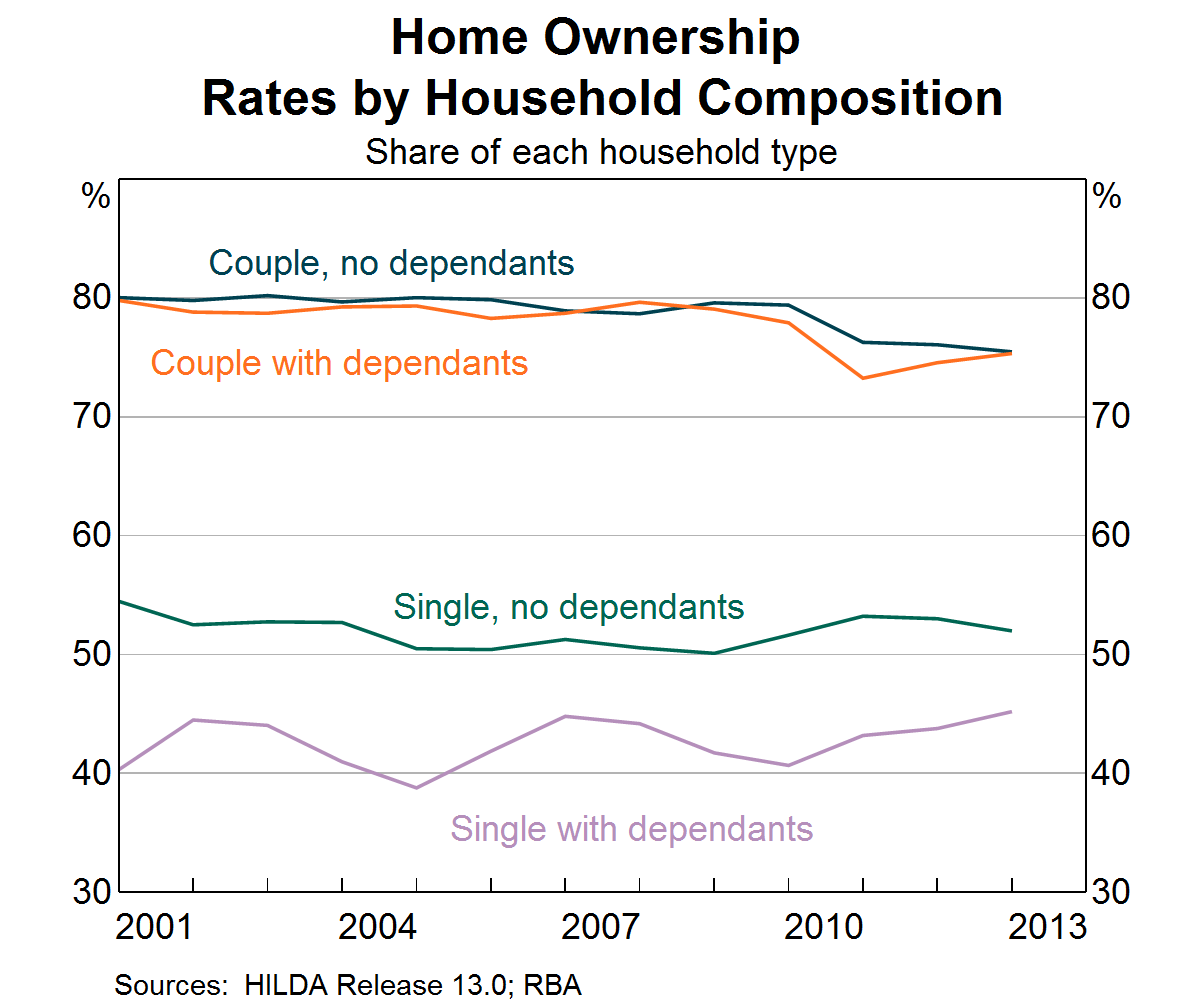
Demographic change has been an especially important driver. In particular, the pronounced trend towards later marriage and family formation over the past 40 years or so would be expected to have reduced ownership rates (Graph 6). For example, the median age at first marriage for women rose from 20.9 years in 1974 to 27.9 years in 2010. Although this shift was probably driven in part by increasing labour force participation by women, it also reflected a reversal of the anomalously low average age at first marriage in the decades following WWII; in the first half of the 20th century and in earlier centuries, the average age at first marriage in a range of Western countries was generally higher than it was in the post-war period (Elliott et al 2012). Whatever the cause, a trend to later marriage is likely to have resulted in deferred home purchase among younger people. Over recent decades there has also been an increase in the prevalence of single adult households, particularly single-parent households, in part driven by significantly higher divorce rates since the 1970s. This trend is also likely to have weighed on the home ownership rate, as single adult households have a much lower tendency to own their own home (Graph 7).
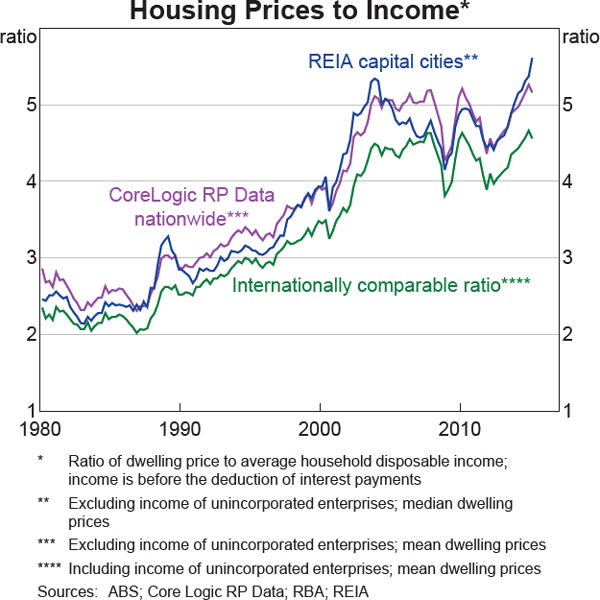
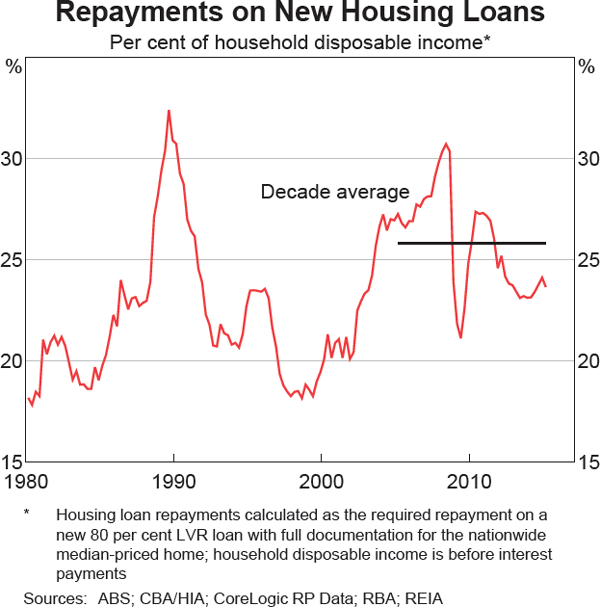
Of the possible economic causes of declining home ownership rates among younger households, the most obvious would be the sharp rise in housing prices in Australia since the mid 1990s. Housing prices rose significantly, including relative to income, between the mid 1990s and mid 2000s (Graph 8). However, this mainly was driven by the structural downward shift in consumer price inflation and thus nominal interest rates. As a result, housing ‘affordability’, measured as the share of average household income required to service a loan on a median-priced dwelling, has continued to cycle between 20 and 30 per cent, and is currently well below previous peaks ( Graph 9).
On the other hand, the rise in housing prices relative to income has also increased the size of a deposit of any given fraction of the purchase price. At first glance, this would seem to imply that housing ‘accessibility’ has declined (Graph 10); previous studies have found that the savings required for a deposit seems to be more important for the transition to home ownership than the ability to service a mortgage from current income thereafter (Bourassa 1995). However, financial deregulation and increased competition in the mortgage market has partly offset this effect, by reducing minimum down payment (deposit) requirements. The maximum loan-to-valuation ratio (LVR) available in the Australian mortgage market has increased noticeably over recent decades, from the 80 per cent typical in the pre-deregulation period to around 95 per cent at present.[1] Equivalently, the deposit required of a first home buyer is no longer necessarily around 20 per cent of the purchase price, but rather, more often in the 5–10 per cent range. This shift would have eased the accessibility constraint imposed by the deposit requirement more than would be apparent from a simple comparison of a fixed percentage of the median purchase price over time. The latest data from mortgage lenders suggest that around 15 per cent of new lending to owner-occupiers involves LVRs above 90 per cent; most of these borrowers would be first home buyers. That said, lower deposit requirements have probably only partly offset the general increase in housing prices relative to incomes, so the net effect of all the forces described above has probably been to delay or prevent home purchase in some cases.
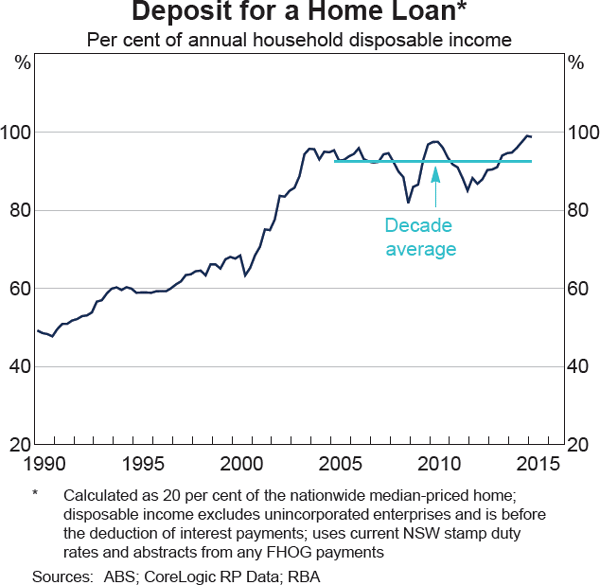
So it seems at least plausible that the rise in housing prices since the mid 1990s has contributed to declining home ownership rates among younger households. But the Census data suggest that the downtrend in home ownership for the 25–34 and 35–44 age groups started in the early 1980s, with much of the decline occurring by the mid 1990s, before the sharp increase in housing prices relative to income. In fact, Census data imply that home ownership rates were relatively stable across these younger age groups between the mid 1990s and mid 2000s when housing prices were rising most rapidly relative to incomes (Graph 5 above). And the subsequent dip in the home ownership rate between the 2006 and 2011 Censuses was apparent across nearly all age groups, not just for these younger households. This suggests that other factors are also likely to have been important contributors to the decline in home ownership among younger households, including the demographic trends discussed above.
Other factors that have been put forward in the literature as contributing to lower home ownership rates among younger households include the following (Yates 2011).
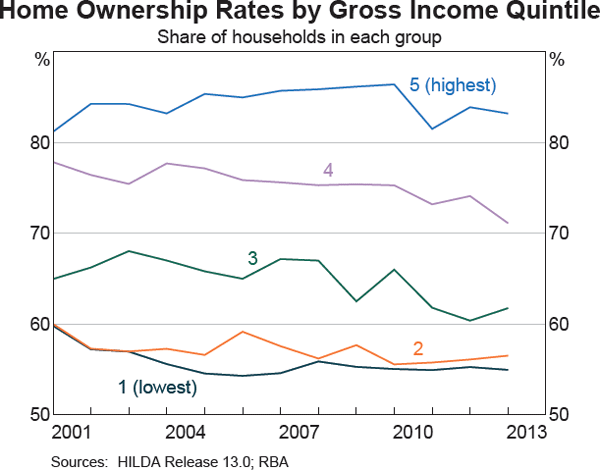
- An increase in income inequality over recent decades, in part reflecting the simultaneous rise of two-income households with increasing workforce participation by women as well as the rise of single adult households (with or without dependents) discussed above. This led to increased borrowing capacities for households with high home ownership propensities, which will tend to have advantaged older households over younger ones. Accordingly, the decline in home ownership rates over the past decade or so has been concentrated in the third and fourth income quintiles, while that of the top income quintile – the top 20 per cent of households by income – has been little changed (Graph 11).
- Financial innovation in the 1990s and the 2000s arguably led to greater relaxation of restrictions on borrowing for higher-income households than for lower-income households. In particular, the shift from traditional rules of thumb based on debt-servicing ratios for assessing mortgage serviceability to more sophisticated net income surplus models, discussed in Laker (2007) and elsewhere, probably had the effect of advantaging higher-income earners (lower-risk borrowers), who are often older.
- Increased labour market flexibility, accelerated technological change and other factors may have increased employment and income insecurity and so reduced the willingness of some households to take on the long-term financial commitment of owning a home (or the ability to service a loan) and the capability of some to remain in home ownership.
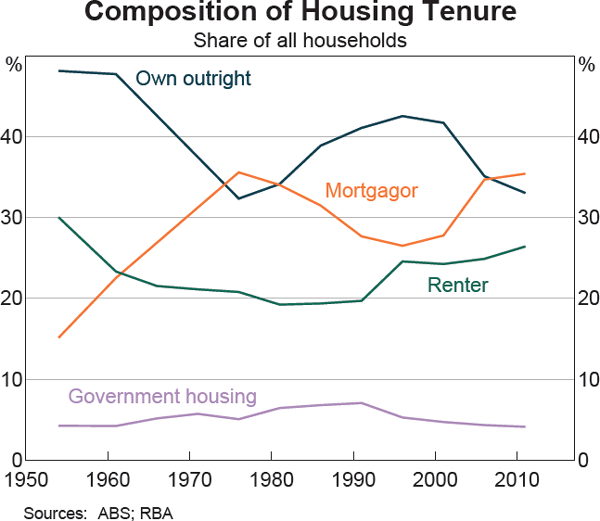
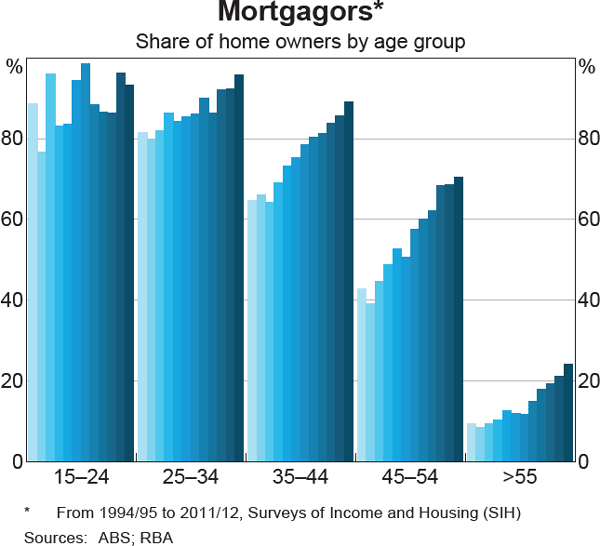
Within the broadly stable aggregate home ownership rate, over recent decades there has also been a marked increase in the tendency for home owners to have a mortgage (Graph 12). In the early 1990s, the share of households that owned their own home outright was larger than the share of households with a mortgage, but now the reverse is true. This change has been visible across all age groups, but is particularly marked in the 45–54 age group (Graph 13). It is most likely a consequence of the structural decline in inflation in the early 1990s, and associated falls in nominal interest rates and nominal income growth. The result of those changes is that the real value of a household's outstanding housing loan is eroded at a slower rate (RBA 2003a).
Another potentially important driver of the increasing prevalence of mortgagor households is the financial deregulation and innovation that has occurred over recent decades. Due to the emergence of products such as home equity loans, home owners can now easily borrow at a relatively low cost against the equity in their home, so that mortgages can now be used to finance many other types of purchases. Reverse mortgages also now allow older households to access the equity in their home, which forms the bulk of most households' wealth, to support consumption during retirement.
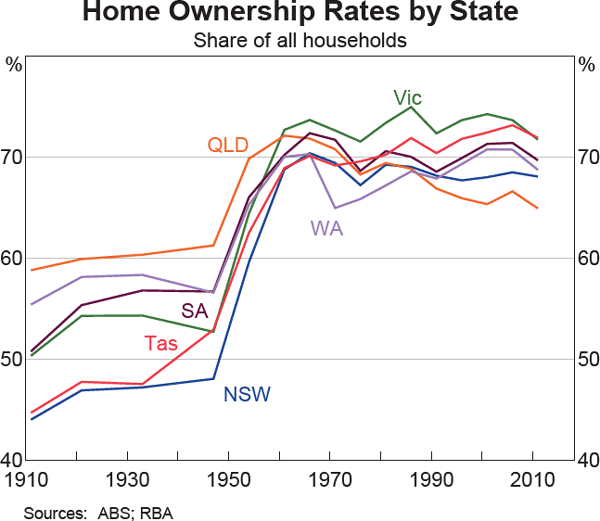
Across the states, long-run trends in home ownership have been broadly similar, although there are noticeable differences (Graph 14). For instance, the home ownership rate in most states remains above levels seen in the interwar period, in line with the national aggregate, but the difference is much smaller in Queensland, where much higher home ownership rates prevailed in the first half of the last century relative to the other states, and where the rate has drifted down more in recent decades. And while all states had home ownership rates between 65 and 75 per cent as at the latest Census, there is still considerable variation across states, with home ownership ranging from a low of around 65 per cent in Queensland to a high of almost 72 per cent in Tasmania and Victoria.
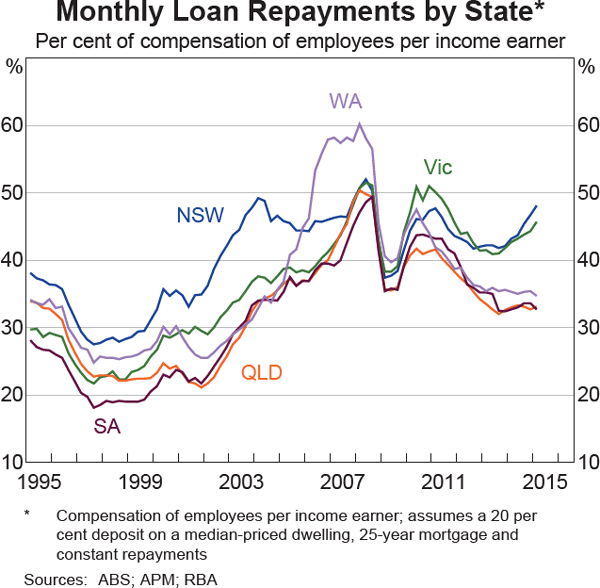
Differences in housing affordability do not, on their own, seem to explain this variation. While New South Wales currently has both low affordability and low home ownership relative to other states, Queensland has both the lowest home ownership rate and the highest affordability (equal with South Australia) (Graph 15). Victoria also has a higher home ownership rate than other states despite noticeably lower affordability.
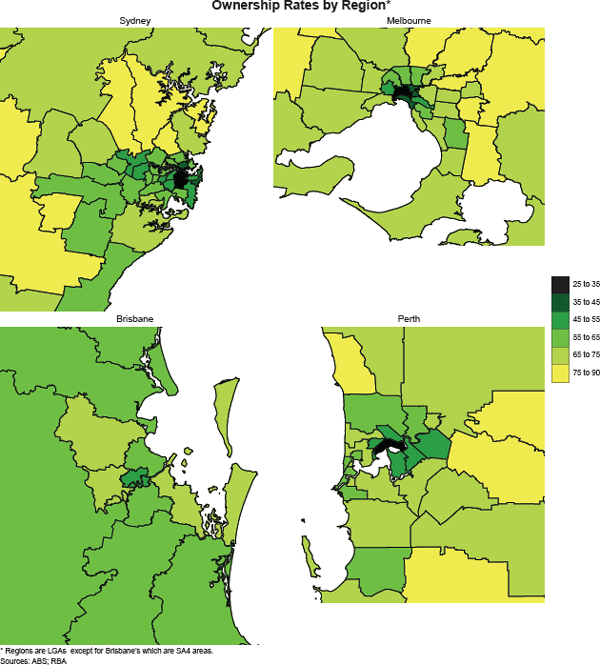
Looking at an even further disaggregated level, home ownership rates display a fairly common pattern within major Australian cities (Graph 16). In general, home ownership is lowest in the city centre – the CBD and surrounding areas – and is highest on the urban fringes (although Brisbane is a notable exception). This pattern is likely to reflect two key factors. First, the relative preference among renters, particularly younger people, for rental housing located close to job opportunities and other amenities, which are concentrated in inner-city areas. And second, the tendency for the most affordable housing to be located on the urban fringe, as the value of land tends to fall with increasing distance from the city centre (Kulish, Richards and Gillitzer 2011).
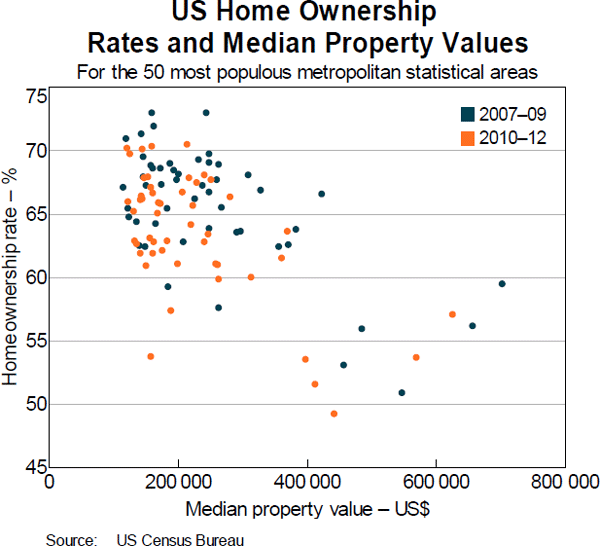
In keeping with the Australian experience, there can also be significant variation in home ownership rates within other countries. For example, home ownership rates across the 50 largest US cities vary from around one half to nearly three-quarters (Graph 17). This variation may, in part, reflect differences in housing affordability, as home ownership tends to be negatively correlated with housing prices (with New York at one extreme with very high housing prices and a low home ownership rate). However, there are many cities, such as Las Vegas (Nevada) or Austin (Texas) where both home ownership and housing prices are relatively low, highlighting the importance of other factors in determining the level of home ownership.
Footnote
Mortgages in Australia with an original LVR above 80 per cent typically require lenders mortgage insurance (LMI), which is an additional up-front cost for the borrower. Although LMI premiums can cost thousands of dollars on a typical first home buyer's loan, the amounts are much lower than the additional deposit that would be required to provide a 20 per cent down payment (80 per cent LVR). [1]