RDP 2024-10: How Do Global Shocks Affect Australia? Appendix C: Supplementary VAR Results

C.1 Trade FEVDs

The global shocks explain close to 30 per cent of the FEV for Australia's terms of trade and for the goods and services trade balance when subtracting resource exports. The global shocks explain very little of the variation in resource exports. Although long-run trends in resource exports clearly depend on foreign demand, Australian producers of some commodities (especially iron ore) are generally low-cost producers compared to global competitors, such that they tend to produce to their maximum capacity regardless of shifts in demand (RBA 2015). Therefore short-run variation in volumes is likely to be driven more by supply shocks than demand shocks. Prices on the other hand appear more responsive to demand.
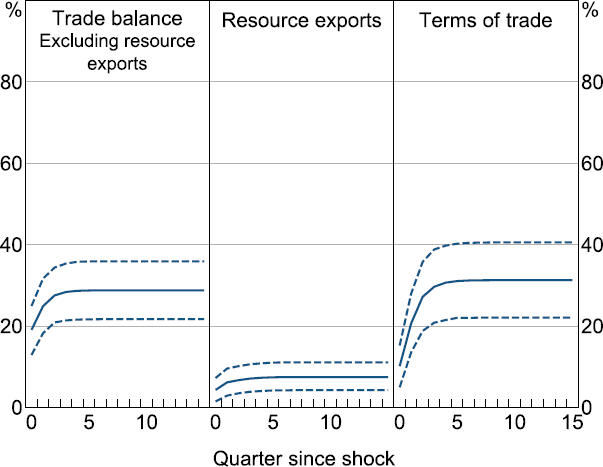
Figure C1: Forecast Error Variance Decomposition
Contribution of global shocks to trade variables
Figure C1: Forecast Error Variance Decomposition - a three panel chart showing the contribution of global shocks to the forecast error variance explained of three variables: the trade balance excluding resource exports, resource exports, and terms of trade. The chart shows that the global shocks explain around 30 per cent of variation in the trade balance and terms of trade, but less than 10 per cent of variation in resource exports.

Note: Dashed lines show 68 per cent confidence interval.

C.2 Impulse response functions

IRFs for a shock to the third factor
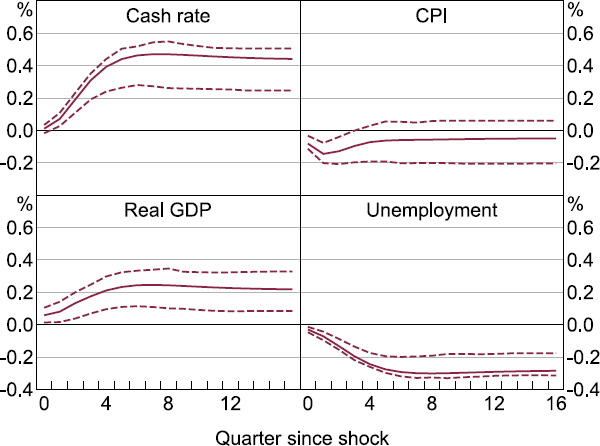
Figure C2: Impulse Response Functions
Response of baseline block to third factor shock, cumulated
Figure C2: Impulse Response Functions - a four panel chart showing the cumulative impulse responses in the cash rate, CPI, real GDP and unemployment between zero and 16 quarters from the shock to the third factor in the FAVAR. The chart shows that cash rate increases, GDP increases, unemployment decreases and CPI decreases but then returns to zero.

Note: Dashed lines show 68 per cent confidence interval.

IRFs for a shock to the first factor
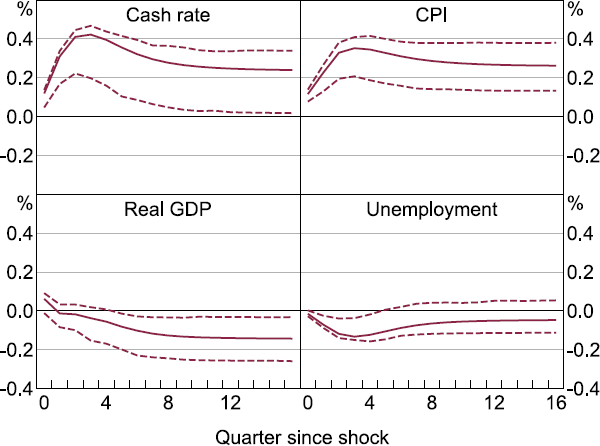
Figure C3: Impulse Response Functions
Response of baseline block to first factor shock, cumulated
Figure C3: Impulse Response Functions - a four panel chart showing the cumulative impulse responses in the cash rate, CPI, real GDP and unemployment between zero and 16 quarters from the shock to the first factor in the FAVAR. The chart shows that the cash rate increases, CPI increases, GDP decreases and unemployment remains stable.

Note: Dashed lines show 68 per cent confidence interval.
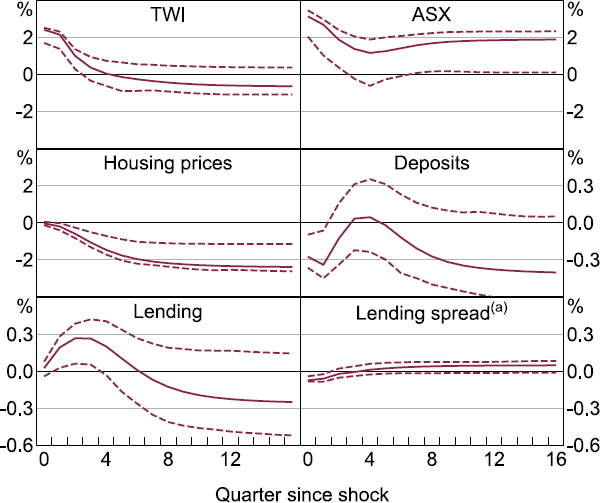
Figure C4: Impulse Response Functions
Response of financial block to first factor shock, cumulated
Figure C4: Impulse Response Functions - a six panel chart showing the cumulative impulse responses in the TWI, ASX, housing prices, deposits, lending and the lending spread between zero and 16 quarters from the shock to the first factor in the FAVAR. The chart shows that the ASX and the TWI increases initially, housing prices decline, while deposits, lending and lending spread remain basically stable.

Notes: Dashed lines show 68 per cent confidence interval.
(a) Spread between average lending rates and three-month bank bill swap rate.

IRFs for a shock to the second factor
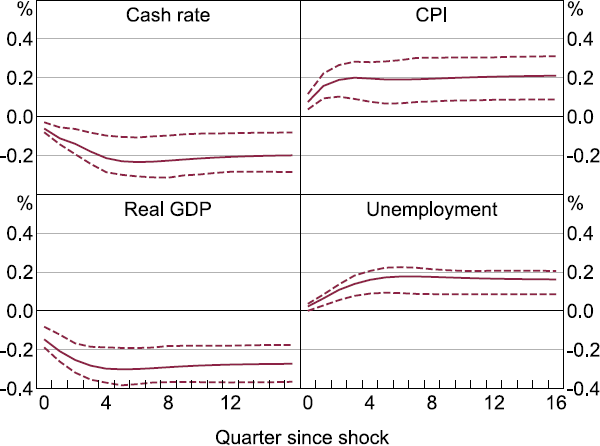
Figure C5: Impulse Response Functions
Response of baseline block to second factor shock, cumulated
Figure C5: Impulse Response Functions - a four panel chart showing the cumulative impulse responses in the cash rate, CPI, real GDP and unemployment between zero and 16 quarters from the shock to the second factor in the FAVAR. The chart shows that cash rate decreases, CPI increases, GDP decreases and unemployment increases.

Note: Dashed lines show 68 per cent confidence interval.
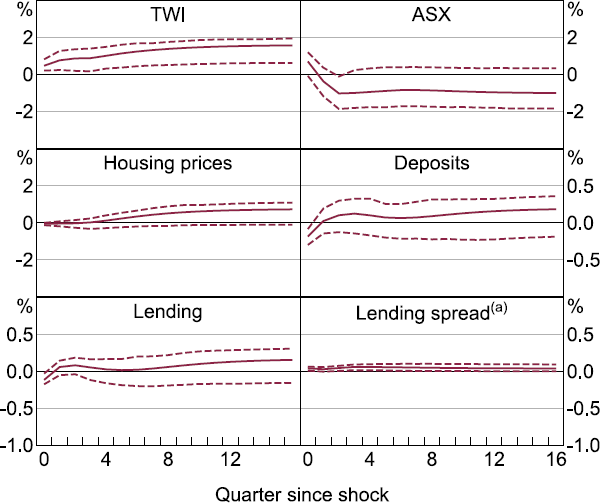
Figure C6: Impulse Response Functions
Response of financial block to second factor shock, cumulated
Figure C6: Impulse Response Functions - a six panel chart showing the cumulative impulse responses in the TWI, ASX, housing prices, deposits, lending and the lending spread between zero and 16 quarters from the shock to the second factor in the FAVAR. The chart shows that the TWI increases, while the ASX, housing prices, deposits, lending and the lending spread remain basically stable.

Notes: Dashed lines show 68 per cent confidence interval.
(a) Spread between average lending rates and three-month bank bill swap rate.