RDP 2024-07: How Do Households Form Inflation and Wage Expectations? Appendix A: Regression Results

Figure A1: Responses of Inflation and Wages to Oil Supply Shock
1 per cent increase in fuel prices
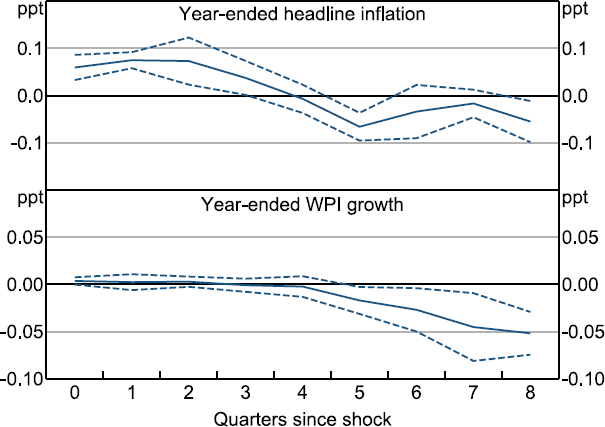
Figure A1: Responses of Inflation and Wages to Oil Supply Shock - a two-panel line chart showing the estimated effect of an oil price shock on inflation and WPI growth. Inflation rises moderately, before falling slightly below zero. WPI growth is unaffected.

Note: Dashed lines indicate 90 per cent confidence intervals.

Sources: ABS; Authors' calculations.

Figure A2: Response of Inflation Expectations to Monetary Policy Shock
100 basis point contractionary shock
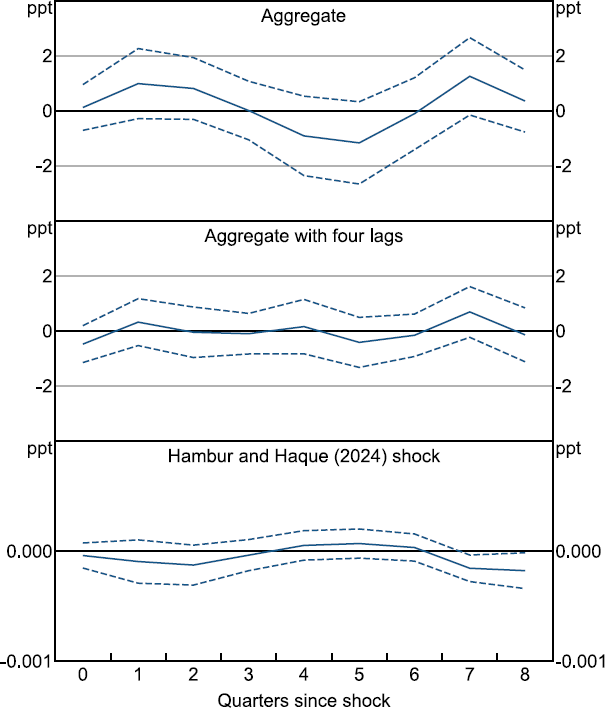
Figure A2: Response of Inflation Expectations to Monetary Policy Shock - a three-panel line chart showing the estimated effect of a monetary policy shock on inflation expectations using the baseline specification in the paper, as well as specifications using more lags, and using the Hambur and Haque (2024) alternative shock measure. All three show no evidence of an effect, with expectations remaining around the zero line, notwithstanding some volatility.

Note: Dashed lines indicate 90 per cent confidence intervals.

Sources: Authors' calculations; Melbourne Institute.