RDP 2023-09: Does Monetary Policy Affect Non-mining Business Investment in Australia? Evidence from BLADE Appendix C: Additional Microdata Results
December 2023
- Download the Paper 1.74MB
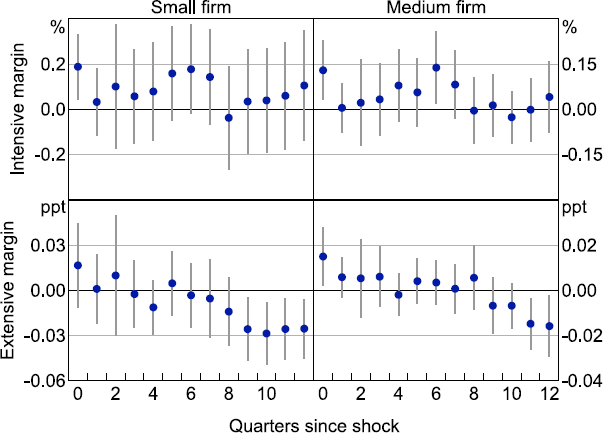
Notes: Dots represent the point estimates of the differences in impulse responses. Bars represent 90 per cent confidence intervals.
Sources: ABS; Authors' calculations.
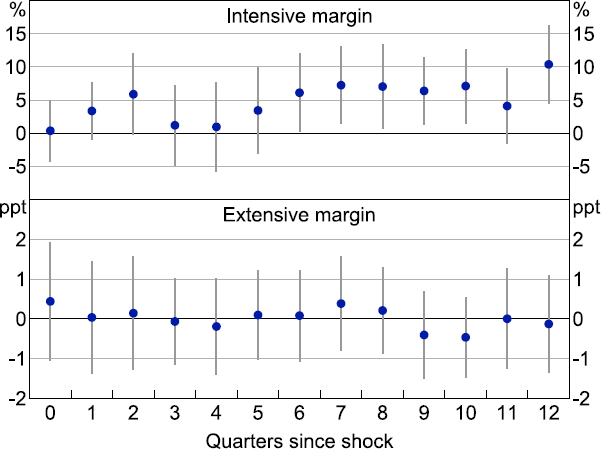
Notes: Dots represent the point estimates of the differences in impulse responses. Bars represent 90 per cent confidence intervals.
Sources: ABS; Authors' calculations.
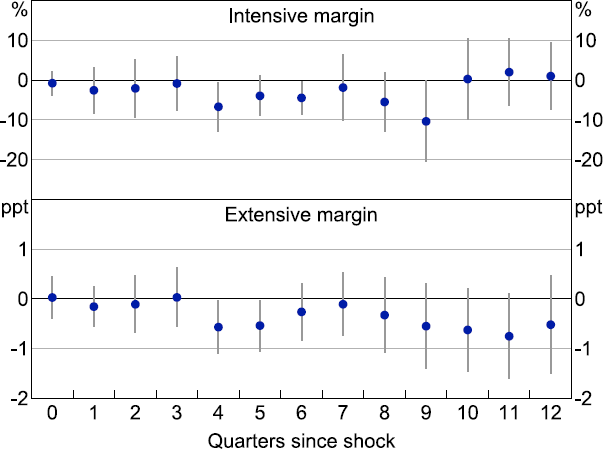
Notes: Dots represent the point estimates of the differences in impulse responses. Bars represent 90 per cent confidence intervals.
Sources: ABS; Authors' calculations.
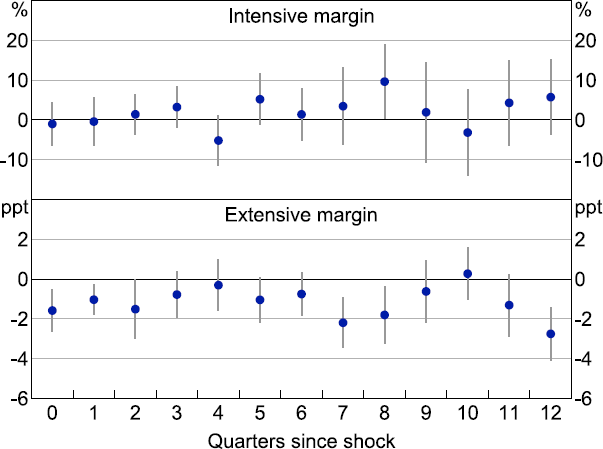
Notes: Dots represent the point estimates of the differences in impulse responses. Bars represent 90 per cent confidence intervals.
Sources: ABS; Authors' calculations.
Sources: ABS; Authors' calculations.
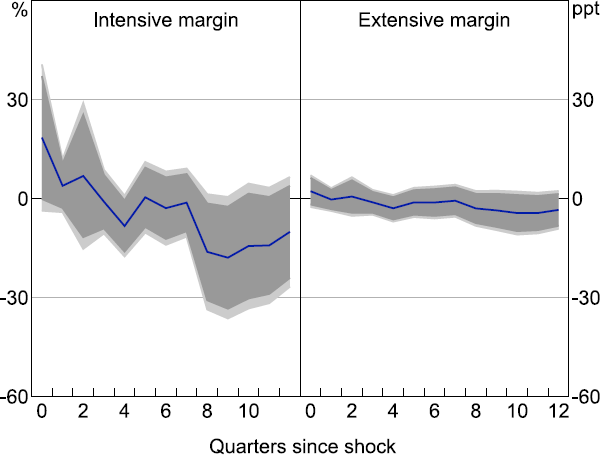
Notes: Monetary policy shock is instrumented via cash rate. Lighter shaded areas show 95 per cent confidence interval; darker show 90 per cent confidence interval.
Sources: ABS; Authors' calculations.
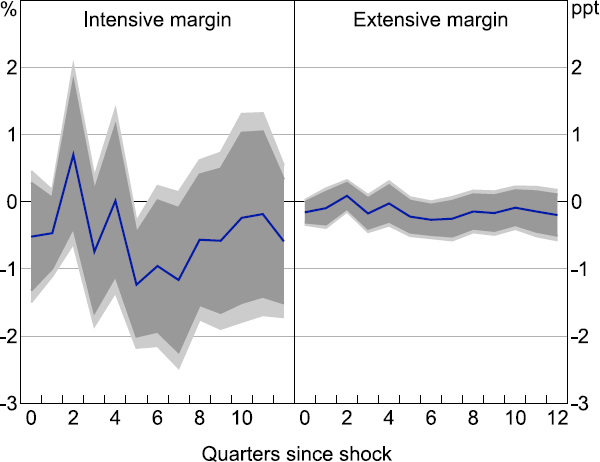
Notes: Monetary policy shock is defined as in Hambur and Haque (2023). Lighter shaded areas show 95 per cent confidence interval; darker show 90 per cent confidence interval.
Sources: ABS; Authors' calculations.
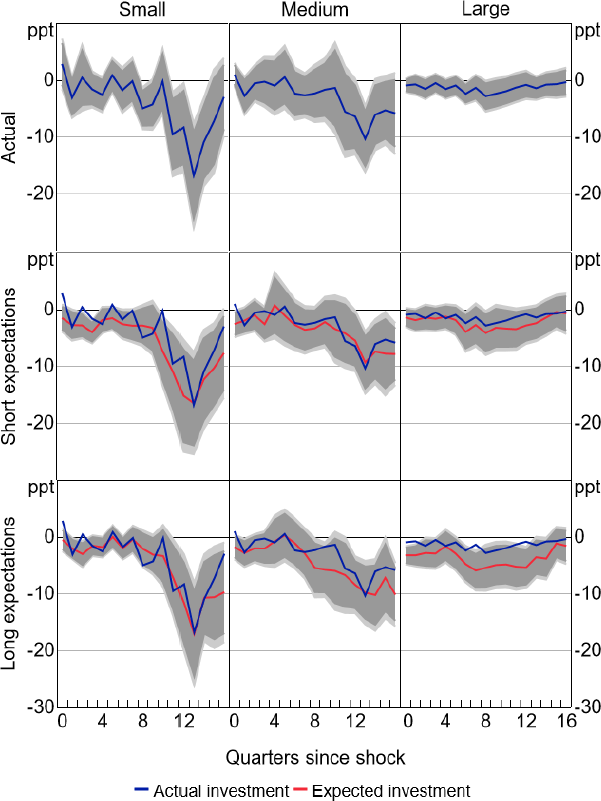
Notes: Non-mining. Lighter shaded areas show 95 per cent confidence interval; darker show 90 per cent confidence interval.
Sources: ABS; Authors' calculations.