RDP 2022-02: The Yield and Market Function Effects of the Reserve Bank of Australia's Bond Purchases 7. Effects on Market Functioning
May 2022
- Download the Paper 1.89MB
Finally, we examine how bond purchases by the Reserve Bank affected the functioning of government bond markets. The international experience suggests that central bank purchases can support good bond market function and lower liquidity premia, particularly in times of market stress. This was in fact the aim of purchases by the Reserve Bank in support of market function. However, the Reserve Bank buying a large share of outstanding government bonds could, in principle, have negative effects on Australia's government bond markets. For example, if the Reserve Bank were to buy so much of a certain bond line that it became scarce, bond dealers may become reluctant to offer to sell that bond to their clients for fear that they would be left short. This could result in reduced bond market liquidity, and could see bid-offer spreads widen and pricing anomalies emerge. Eventually, this could impair related instruments such as bond futures contracts (which are used by banks and corporations to hedge interest rate risk), it could diminish the attractiveness of government bond markets for investors, and could contribute to larger liquidity premia for government bonds in Australia (e.g. Han and Seneviratne 2018; Blix Grimaldi, Crosta and Zhang 2021).
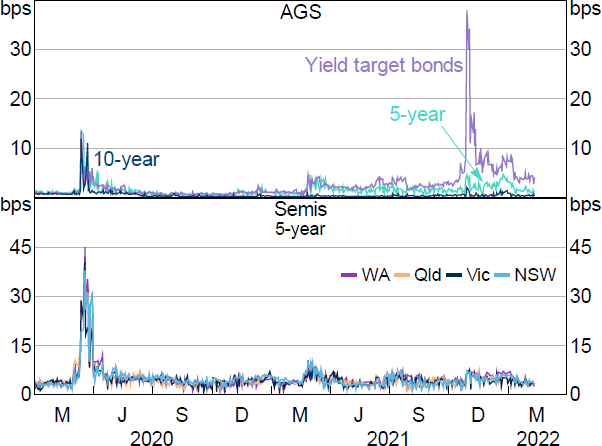
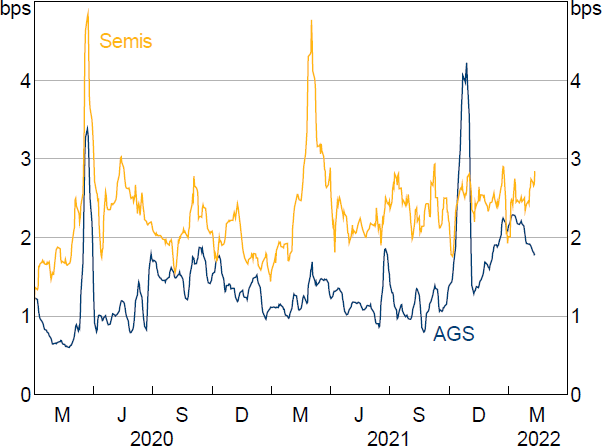
For bonds purchased with the aim of supporting market function, there was no sign of harm. Rather, the evidence suggests that these purchases achieved their aim: bid-offer spreads and yield curve fitting errors, both of which spiked dramatically higher in early March 2020, fell as purchases proceeded (Figures 19 and 20).[33] Conversely, there is evidence that the Reserve Bank's substantial holdings of the April 2023 and April 2024 AGS – purchased in support of the yield target – resulted in some deterioration in market function around the 3-year part of the yield curve. For example, bid-offer spreads remained very low for longer-term AGS and for semis over the second half of 2020 and through 2021, but rose to be higher than usual for shorter-term AGS, spiking in particular for the April 2024 AGS around the discontinuation of the yield target (Figure 19). Yield curve fitting errors for bonds purchased under the bond purchase program also remained within their historical range over the second half of 2020 and most of 2021, although rose for semis alongside a sharp global increase in yields in early 2021, and rose for AGS alongside an increase in global yields and the discontinuation of the yield target in late 2021 (Figure 20).

Source: Yieldbroker

Notes: Fitting errors for semis are a simple average of the states and territories. AGS series excludes the April 2024 AGS.
Sources: Authors' calculations; Bloomberg
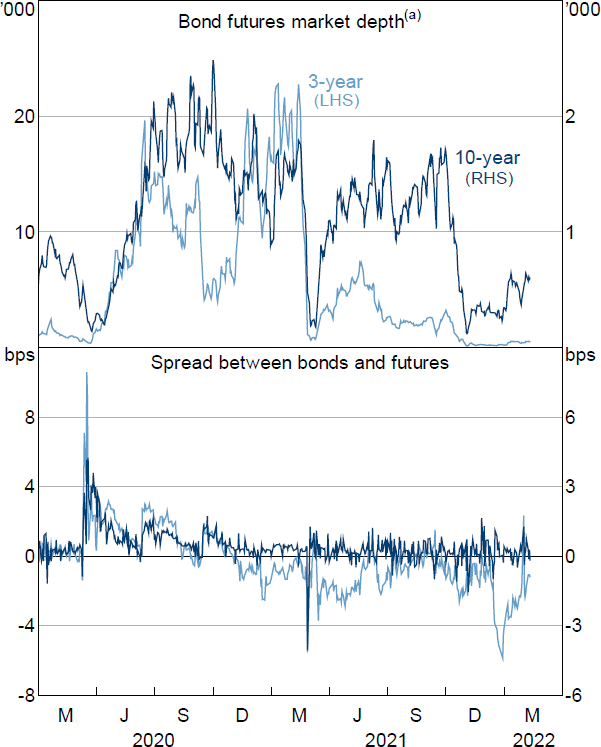
Indicators of bond futures market function suggest a similar story: the period over which purchases to support bond market function were undertaken saw mispricing between bonds and futures narrow, after having risen substantially around the onset of the pandemic, and saw more futures contracts available to trade at the best available price (Figure 21). Conversely, these measures deteriorated over 2021, particularly for the 3-year futures contract, and particularly around periods of market volatility (including early 2021 and ahead of November 2021 when the yield target was discontinued). Market contacts noted the perceived risk of the Reserve Bank discontinuing the yield target at various points through 2021, which would have seen the 3-year futures price gap lower, as well as the Reserve Bank's substantial holdings of 3-year bonds (and an associated fall in liquidity which made hedging futures against bonds more difficult), as contributing to the deterioration in futures market function, although other factors including uncertainty associated with the rapidly changing economic outlook may also have contributed.

Note: (a) One-week moving average. Seasonally adjusted to remove predictable intra-quarter variation. Number of top-of-book contracts.
Sources: Authors' calculations; Bloomberg; Thomson Reuters
To formally test the effect of the Reserve Bank's bond purchases on bid-offer spreads, we estimate the equation:
where yit denotes the average bid-offer spread for bond i in week t; purchasesit denotes the share of remaining free float of bond i purchased in week t (that is, purchases in the week divided by the outstanding stock not already held by the Reserve Bank at the beginning of the week); holdingsit denotes the share of the total stock of bond i held by the Reserve Bank at the beginning of week t; and bi and vt are bond and time fixed effects.
We estimate this equation for AGS and semis purchased in support of market functioning and under the bond purchase program (using issuer fixed effects instead of bond fixed effects in the case of semis), and also estimate a similar equation for purchases in support of the yield target, but in this case dropping time fixed effects in favour of a dummy to denote weeks in which the stock lending fee charged for borrowing April 2023 AGS and April 2024 AGS from the Reserve Bank was elevated. Results are presented in Table 8.
| Market functioning purchases | Bond purchase program | Yield target purchases | ||||
|---|---|---|---|---|---|---|
| AGS | Semis | AGS | Semis | |||
| Purchases of free float in the week | −1.61*** (0.36) |
−3.28** (1.48) |
0.23* (0.12) |
−1.57 (1.30) |
0.44*** (0.01) |
|
| Holdings of total stock at the start of the week | −0.53 (0.33) |
−2.00* (1.10) |
0.18*** (0.07) |
−0.67 (0.49) |
0.53*** (0.01) |
|
| Dummy for elevated stock lending fee | 2.89*** (0.24) |
|||||
| Fixed effects | Bond and time | Issuer and time | Bond and time | Issuer and time | Bond | |
| No of obs | 112 | 425 | 1,098 | 2,802 | 132 | |
| Adjusted R2 | 0.81 | 0.66 | 0.78 | 0.03 | 0.23 | |
|
Notes: HAC standard errors in parentheses; *, ** and *** denote statistical significance at the 10, 5 and 1 per cent levels, respectively. For market functioning purchases, the sample is from 20 March 2020 to 6 May 2020; for the bond purchase program, it is from 5 November 2020 to 10 February 2022; for yield target purchases, it is from 5 August 2020 to 2 November 2021. Bonds issued by Tasmania and the two territories are excluded. Sources: Austraclear; Australian Office of Financial Management; Authors' calculations; RBA; Yieldbroker |
||||||
We find that purchases in support of market function led to lower bid-offer spreads, as intended. In particular, for each 10 percentage points of the free float of an AGS purchased to support market function, the bid-offer spread of that bond narrowed by 1.6 basis points, while for semis the effect was larger at 3.3 basis points. Additionally, a 10 percentage point higher share of the outstanding stock of a semis bond line by the Reserve Bank was associated with the bid-offer spread on that bond being 2 basis points narrower, perhaps because higher Reserve Bank holdings during the period of market dysfunction in early 2020 were associated with less of a supply overhang on dealer balance sheets for those bond lines.
For the bond purchase program and yield target, however, we find that AGS purchases led to wider bid-offer spreads. For AGS purchased under the bond purchase program, each 10 percentage points of purchases of the free float was associated with bid-offer spreads being 0.2 basis points wider, and similarly each 10 percentage points of holdings of the outstanding stock was associated with bid-offer spreads being 0.2 basis points wider. For AGS purchased to support the yield target, each 10 percentage points of purchases was associated with bid-offer spreads being 0.4 basis points wider, while each 10 percentage points of bond holdings was associated with bid-offer spreads being 0.5 basis points wider. We also find that an elevated stock lending fee led to higher bid-offer spreads, which is unsurprising as a higher fee makes intermediation by bond dealers more costly.[34]
For semis purchased under the bond purchase program, there was no statistically significant effect of purchases on bid-offer spreads. Taken together, the results above suggest that in the already liquid AGS market, the Reserve Bank removing bonds from the market outside of periods of stress can lead to a rise in bid-offer spreads as bonds become more difficult to source. Conversely, for the less liquid semis market, the existence of a regular buyer in the form of the Reserve Bank offsets any negative impact from less bonds being available to the wider market.
We also replicate the above analysis for turnover in place of bid-offer spreads, with yit instead denoting the log of the average turnover in bond i in week t, using turnover data for trades processed through the Yieldbroker platform. Although these trades represent only a part of trading activity for AGS and semis, our results will be informative if the sample is representative of trading in the wider market. Results are presented in Table 9. For market function purchases and purchases under the bond purchase program, we find no statistically significant effect of purchases or holdings on turnover. For yield target purchases, by contrast, we find that turnover increases significantly in weeks when the Reserve Bank makes purchases, but that higher Reserve Bank holdings ultimately result in less secondary market turnover.
| Market functioning purchases | Bond purchase program | Yield target purchases | ||||
|---|---|---|---|---|---|---|
| AGS | Semis | AGS | Semis | |||
| Purchases of free float in the week | 0.13 (0.43) |
0.90 (0.67) |
−0.03 (0.25) |
0.32 (0.60) |
0.93*** (0.27) |
|
| Holdings of total stock at the start of the week | 0.10 (0.36) |
−0.52 (0.37) |
−0.08 (0.11) |
−0.03 (0.11) |
−0.27*** (0.07) |
|
| Dummy for elevated stock lending fee | 0.17 (0.42) |
|||||
| Fixed effects | Bond and time | Issuer and time | Bond and time | Issuer and time | Bond | |
| No of obs | 112 | 384 | 1,098 | 2,639 | 132 | |
| Adjusted R2 | 0.28 | 0.35 | 0.39 | 0.19 | 0.09 | |
|
Notes: HAC standard errors in parentheses; *, ** and *** denote statistical significance at the 10, 5 and 1 per cent levels, respectively. For market functioning purchases, the sample is from 20 March 2020 to 6 May 2020; for the bond purchase program, it is from 5 November 2020 to 10 February 2022; for yield target purchases, it is from 5 August 2020 to 2 November 2021. Bonds issued by Tasmania and the two territories are excluded. Sources: Austraclear; Australian Office of Financial Management; Authors' calculations; RBA; Yieldbroker |
||||||
Finally, by regressing the log change in the weekly average number of 3-year futures contracts available to trade at the best price on weekly yield target purchases, we find that each 10 percentage points of purchases of the free float across either the April 2023 or April 2024 bond is associated with a 36 per cent fall in the number of futures contracts available to trade, significant at the 1 per cent level. Similarly, regressing average weekly mispricing between 3-year bonds and 3-year futures on weekly yield target purchases, yield target bond holdings and the stock lending fee suggests that each 10 percentage points of bond purchases is associated with a 0.4 basis point increase in bond-futures mispricing, while an elevated stock lending fee is associated with a 1 basis point increase in bond-futures mispricing, both significant at the 1 per cent level.[35]
Footnotes
See also Finlay et al (2020) for further discussion of these measures of market function, and for a broader discussion of how bond purchases by the Reserve Bank supported government bond market function over early 2020. [33]
As discussed earlier, however, increasing the stock lending fee tended to lower the 3-year AGS yield, thereby obviating the need for additional bond purchases, which would have reduced the free float of bonds and increased bid-offer spreads. [34]
Note that we use a log differences specification for the first regression as the number of futures contracts available to trade appears to be non-stationary, while we use a levels specification for the bond-futures mispricing regression as that variable is stationary. Note also that we control for predictable intra-quarter variation, due to the futures expiry cycle, in both regressions. We do not attempt similar regressions for purchases to support market function or purchases under the bond purchase program, as those programs had much less week-to-week variation in purchases, making identification of any effect more difficult. [35]