RDP 2022-02: The Yield and Market Function Effects of the Reserve Bank of Australia's Bond Purchases 5. Additional Analysis of Yield Effects
May 2022
- Download the Paper 1.89MB
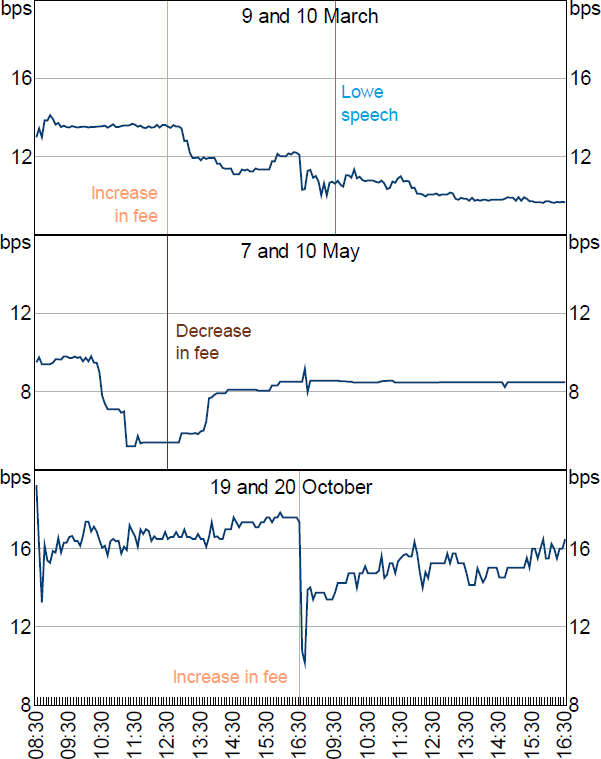
In addition to the announcement of the yield target and purchases of the target bond, other Reserve Bank actions in support of the yield target had an effect on the target bond yield. In particular, in early March 2021 the April 2024 AGS yield had risen above the target and liaison suggested that a number of market participants had positioned to profit from the Reserve Bank discontinuing the yield target in the near future, by borrowing the target bond under repo and selling it outright (that is, short-selling the bond). At 12.30 pm on 9 March 2021 the Reserve Bank communicated to market participants that it had increased the fee that it was going to charge counterparties to borrow the target bond from 25 to 100 basis points, which made short-selling the bond more costly, while at 9 am on 10 March 2021 Governor Lowe gave a speech in which he reaffirmed the Reserve Bank's commitment to the yield target (Lowe 2021). The increase in the stock lending fee saw the April 2024 AGS yield fall by around 2 basis points on announcement, while Governor Lowe's speech saw the yield open a further 1 basis point lower the next day, and continue to fall over the course of the week (Figure 13). See also RBA (2021) for a further discussion of these events.
The stock lending fee for the target bond was changed two further times, with similarly large impacts on the target bond yield. The stock lending fee was decreased from 100 basis points to 25 basis points, announced around 12.30 pm on 7 May 2021 following a sharp fall in the April 2024 AGS yield to a level below the target. This saw the yield move around 2 basis points higher (Figure 13). An increase in the stock lending fee at 4.30 pm on 19 October 2021 back to 100 basis points saw the yield fall from around 17 basis points to around 11 basis points. The standard deviation of daily changes for the 3-year AGS yield is a little less than 1 basis point, so the relatively large moves in the yield following the stock lending fee changes and Governor Lowe's speech, in the absence of any other news of note, suggests that these actions had a meaningful effect on the target bond yield. A higher stock lending fee makes bond market intermediation more costly, and this is discussed further in Section 7.

Source: Yieldbroker
Turning to the bond purchase program, to complement our main results we construct a counterfactual scenario for how AGS yields might have moved in its absence. We then take the difference between the observed yield change and this counterfactual as another measure of the impact of the program.
A simple counterfactual is to assume that, in the absence of bond purchases by the Reserve Bank, longer-term AGS yields would have moved in line with the government bond yields of the United States. This approach makes a few assumptions. In particular, it assumes that AGS yields tend to move with US Treasury yields in response to global news events (but not necessarily news pertaining to a change in the relative economic prospects or stance of monetary policy in each country). Another assumption is that the main news on relative monetary policy stances over the period in question related to domestic bond purchase expectations.
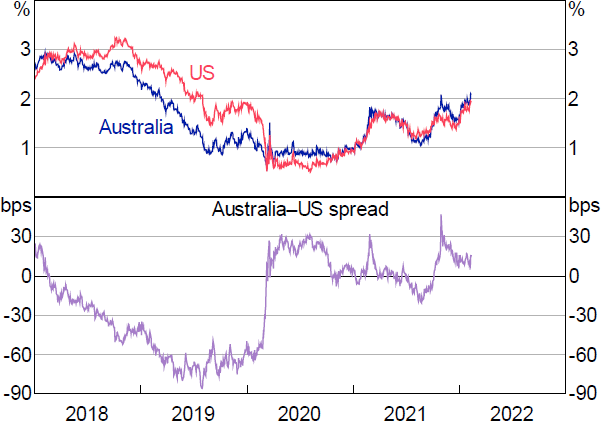
Focusing on the spread between 10-year yields for AGS and US Treasury bonds, after rising at the onset of the COVID-19 crisis as the relative outlook for US growth and inflation deteriorated rapidly, the spread remained stable at around 25 to 30 basis points through to mid-2020 (Figure 14). However, this spread narrowed over September and October 2020 as market participants began to price-in the likelihood of bond purchases in Australia, with the spread reaching around zero when the Reserve Bank's bond purchase program was announced in early November. To the extent that the evolution of longer-term US Treasury yields provides a good counterfactual for what would have happened to longer-term AGS yields in the absence of a bond purchase program, this approach suggests that the announcement of the bond purchase program led to a fall in longer-term AGS yields of around 30 basis points. With the exception of relatively short-lived moves higher in early and late 2021 associated with global increases in bond yields, the spread remained close to zero for an extended period, suggesting that the announcement effect was persistent but that there was no additional implementation effect that depressed Australian yields further as and when bond purchases were made. However, over time the accumulation of other market moving events and differing outcomes for the Australian and US economies lessens the validity of this comparison, and we would not expect the spread to remain near zero indefinitely.

Sources: Bloomberg; Yieldbroker
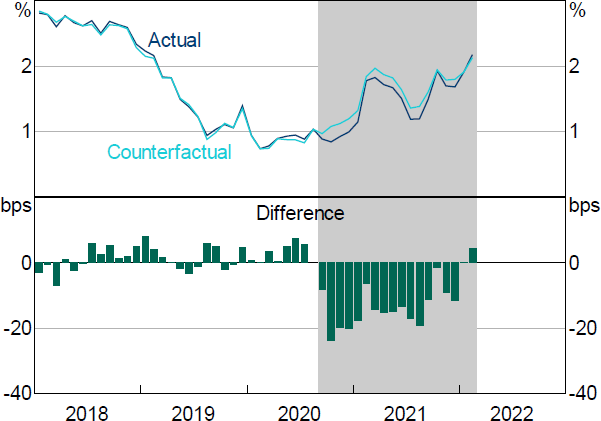
A slightly more sophisticated approach is to construct a model of AGS yields that controls for a handful of domestic and international factors, but for the most part does not capture the effects of the Reserve Bank's bond purchase program, and then use the implied path of AGS yields resulting from this model as a counterfactual against which to measure the yield impact of the program.[27] The model we employ attempts to explain monthly changes in the 10-year AGS yield using: changes in the 10-year Australian OIS rate; changes in the 10-year US Treasury yield; changes in US Federal Reserve bond holdings as a share of US GDP; and changes in the spread between the 3-month BBSW and the 3-month Australian OIS rate. As noted earlier, the 10-year OIS rate will capture market expectations for the cash rate path, and therefore any signalling effect of bond purchases. This implies that our measure will abstract from any such signalling effect, so the measure should be taken as a lower bound rather than a central estimate. Regarding the other explanatory variables: the US Treasury yield captures international factors affecting long-term interest rates; US Federal Reserve bond holdings capture the yield impact of bond purchases in the United States (with market expectations for bond holdings, which were estimated using survey data, used instead of actual holdings starting from May 2020); and the BBSW–OIS spread is a measure of domestic risk aversion and a proxy for the cost of funding holdings of AGS in the repo market. Overall, the counterfactual 10-year AGS yield implied by the model, in the absence of bond purchases, is up to around 20 basis points higher than the observed 10-year AGS yield around the announcement of the bond purchase program, with much of the difference persisting for an extended period (Figure 15).

Note: Counterfactual calculated by cumulating modelled changes in the 10-year AGS yield.
Sources: Authors' calculations; Bloomberg; Federal Reserve Bank of New York; Yieldbroker
Model results are given in Table 7.[28]
| Model 1 | Model 2 | Model 3 | Preferred model | |
|---|---|---|---|---|
| Includes 3-month USD LIBOR–OIS spread |
Includes Reserve Bank bond holdings to Australian GDP |
Includes 10-year US Treasury yield–OIS spread |
||
| 10-year AUD OIS rate | 0.79*** (0.12) |
0.81*** (0.12) |
0.81*** (0.12) |
0.77*** (0.09) |
| 10-year US Treasury yield | 0.22*** (0.08) |
0.21*** (0.07) |
0.20*** (0.07) |
0.22*** (0.06) |
| 10-year US Treasury yield–OIS spread | 0.34 (0.43) |
0.37 (0.43) |
0.35 (0.43) |
|
| Reserve Bank bond holdings to GDP | 0.01 (0.07) |
0.04 (0.06) |
||
| US Federal Reserve bond holdings to GDP | 0.04** (0.02) |
0.03*** (0.01) |
0.04*** (0.01) |
0.04*** (0.01) |
| 3-month BBSW–OIS spread | 0.18* (0.11) |
0.19* (0.10) |
0.20** (0.10) |
0.16 (0.10) |
| 3-month USD LIBOR–OIS spread | 0.02 (0.03) |
|||
| No of obs | 32 | 32 | 32 | 32 |
| Adjusted R2 | 0.94 | 0.94 | 0.94 | 0.94 |
| Durbin-Watson statistic | 2.29 | 2.36 | 2.43 | 2.48 |
|
Notes: HAC standard errors in parentheses; *, ** and *** denote statistical significance at the 10, 5 and 1 per cent levels, respectively. Estimated zero-coupon yields were used for AGS and US Treasury yields throughout the models. Sources: Authors' calculations; Bloomberg; Federal Reserve Bank of New York; RBA; Yieldbroker |
||||
Footnotes
See Kawamoto et al (2021) for a similar exercise focused on Japan. Ideally, we would prefer to construct a model of AGS yields that accurately captures the channels of a bond purchase program discussed earlier, and then use this model to directly measure the impact of bond purchases on yields. The relatively short time horizon over which the Reserve Bank has been conducting bond purchases, however, means that any such model would be poorly estimated. Further, and as discussed earlier, market participants' expectations of bond purchases are an important determinant of yields, and we do not have an accurate measure of these expectations through time for Australia. Together, these difficulties make estimating a model of yields that directly captures the effect of bond purchases unviable in the current context. [27]
Modelling the spread between 10-year AGS and US Treasury yields, and/or including additional explanatory variables (such as Reserve Bank bond holdings, the 10-year US OIS rate and the 3-month USD LIBOR–OIS spread) produced similar results. The additional explanatory variables that we tested were not statistically (or economically) significant in most specifications, so we did not include them in our preferred model. Although the 3-month BBSW–OIS spread fell short of statistical significance in some specifications, we have included it in our preferred model as we consider it likely that the spread had some influence on the 10-year AGS yield in the sample period. [28]