RDP 2021-03: Financial Conditions and Downside Risk to Economic Activity in Australia Appendix B: Additional Growth-at-Risk Results
March 2021
- Download the Paper 1,967KB
B.1 Quantile regression coefficient estimates
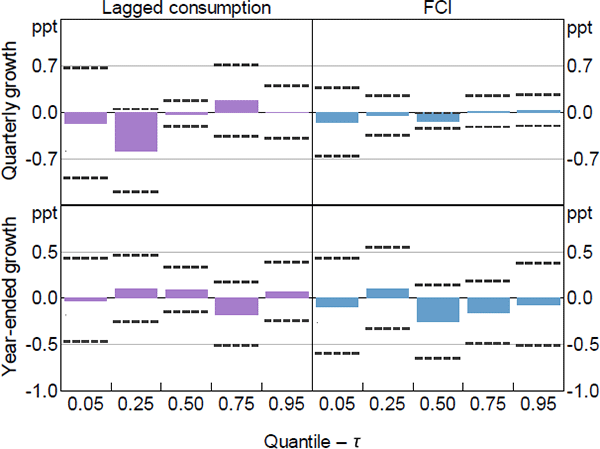
Note: Dashed lines represent 95 per cent confidence intervals computed using the stationary bootstrap proposed in Politis and Romano (1994) assuming an average block length of 8 quarters and 1,000 replications
Sources: ABS; Authors' calculations
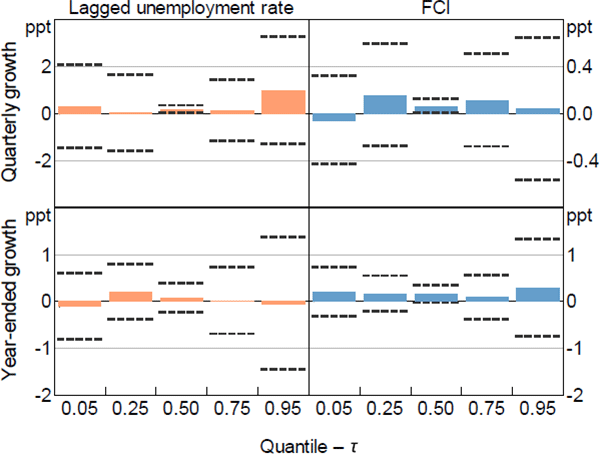
Note: Dashed lines represent 95 per cent confidence intervals computed using the stationary bootstrap proposed in Politis and Romano (1994) assuming an average block length of 8 quarters and 1,000 replications
Sources: ABS; Authors' calculations
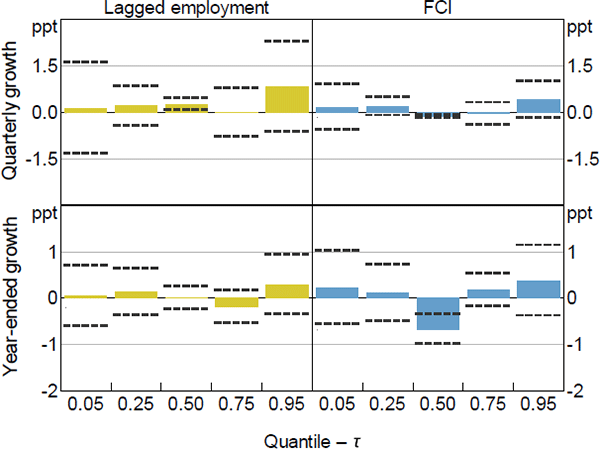
Note: Dashed lines represent 95 per cent confidence intervals computed using the stationary bootstrap proposed in Politis and Romano (1994) assuming an average block length of 8 quarters and 1,000 replications
Sources: ABS; Authors' calculations
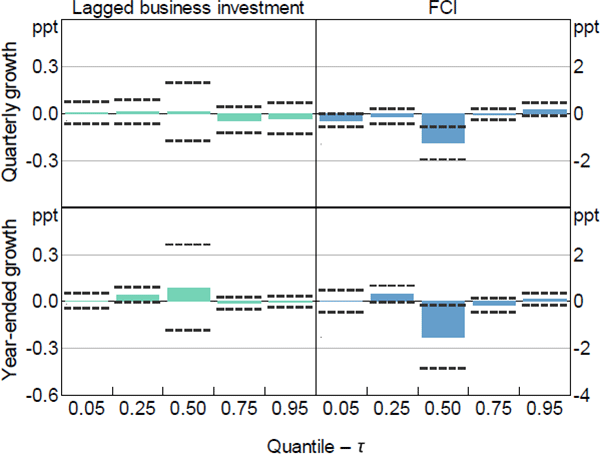
Note: Dashed lines represent 95 per cent confidence intervals computed using the stationary bootstrap proposed in Politis and Romano (1994) assuming an average block length of 8 quarters and 1,000 replications
Sources: ABS; Authors' calculations
B.2 Fitted quantile ranges
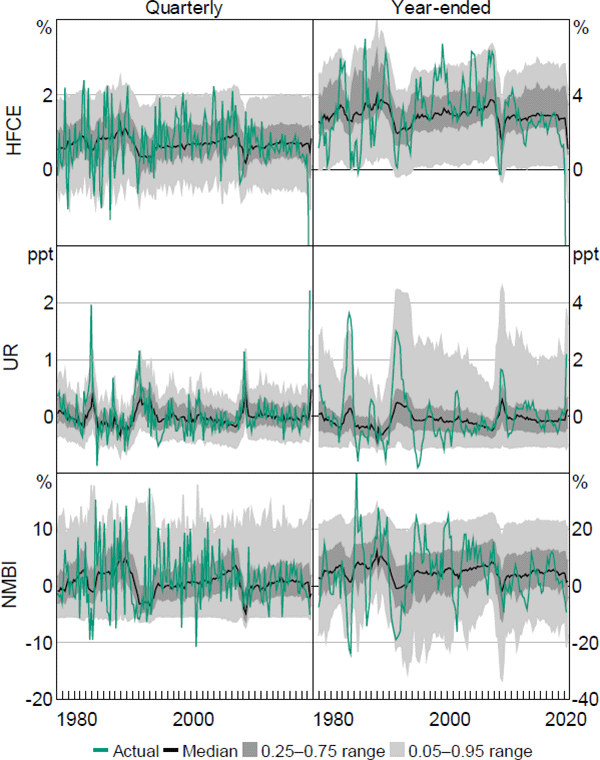
Notes: ‘HFCE’ is the growth rate of real household final consumption expenditure, actual HFCE quarterly growth rate for 2020:Q2 is –12.1 per cent, actual HFCE year-ended growth rate for 2020:Q2 is –12.8 per cent; ‘UR’ is the change in the total unemployment rate; ‘NMBI’ is the growth rate of real business investment excluding mining investment
Sources: ABS; Authors' calculations; RBA
B.3 Downside and upside risk estimates
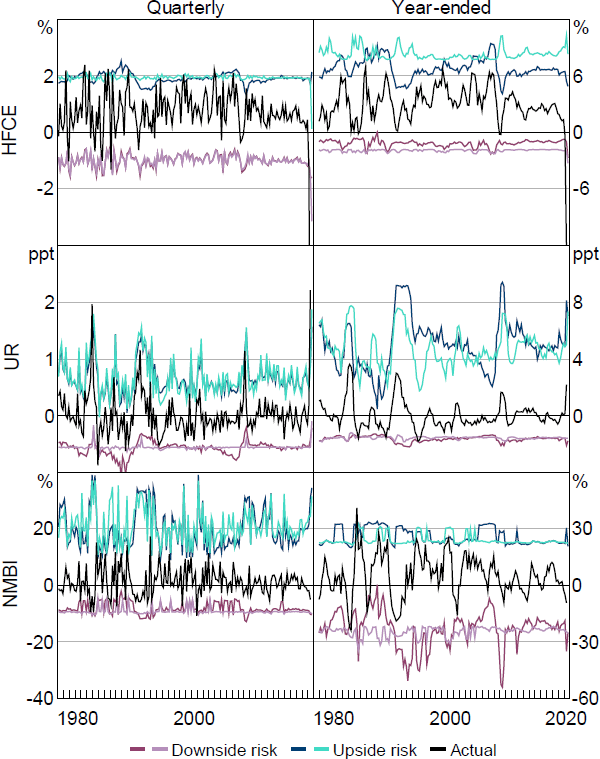
Notes: ‘HFCE’ is the growth rate of real household final consumption expenditure, actual HFCE quarterly growth rate for 2020:Q2 is –12.1 per cent, actual HFCE year-ended growth rate for 2020:Q2 is -12.8 per cent; ‘UR’ is the change in the total unemployment rate; ‘NMBI’ is the growth rate of real business investment excluding mining investment; is set equal to 5 per cent; thicker darker-coloured line is estimated with the FCI; thinner lighter-coloured line is estimated without the FCI
Sources: ABS; Authors' calculations; RBA