RDP 2020-02: The Distributional Effects of Monetary Policy: Evidence from Local Housing Markets Appendix C: Rolling Samples
February 2020
- Download the Paper 1,879KB
To assess the stability of our estimates we conduct rolling regressions. We re-estimate our baseline model taking 15-year samples from 1990 to 2019. Our full-sample results are robust to this change.
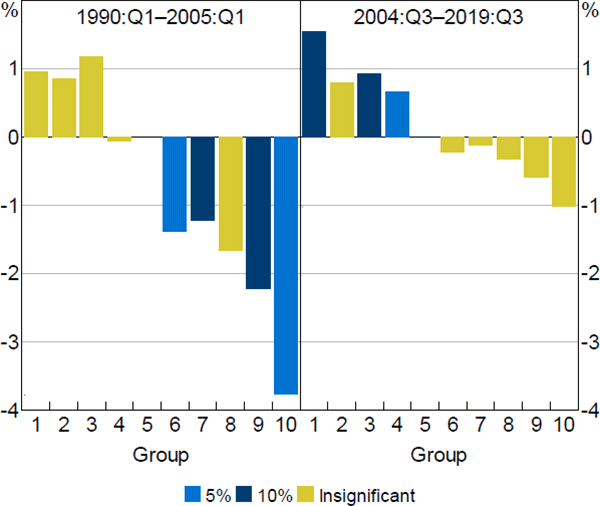
Figure C1 shows the six-quarter-ahead housing price responses using different sub-samples of the data. The earliest sub-sample (1990:Q1–2005:Q2) shows similar results to our baseline; more expensive regions respond more to changes in monetary policy than the median group. However, the magnitudes are slightly larger with the average of the top four deciles being –2.23 percentage points. The latest sub-sample (2004:Q3–2019:Q3) provides some evidence to suggest that the distributional effects of monetary policy on housing wealth has become weaker over time, with more expensive areas experiencing similar housing price responses to the median group. However, the differences between the estimates across sub-samples are not statistically distinguishable from one another.

Note: Colours represent level of significance of estimated coefficients using standard errors clustered across time and state (or territory)
Sources: ABS; Authors' calculations; CoreLogic data; RBA