RDP 2018-07: The GFC Investment Tax Break Appendix C: Extra DD Results
June 2018
- Download the Paper 1.8MB
This appendix presents results from DD models using Capex Survey data aggregated to the division-by-business size level. The key difference from the business-level specification, Equation (1), is the replacement of the business fixed effects with ANZSIC division by size dummies.
| Control group | ||
|---|---|---|
| $2–10 million | > $2 million | |
| η | 1.76*** (0.57) |
2.04*** (0.36) |
| Clusters (division by size) | 28 | 98 |
| Observations | 504 | 1,750 |
|
Notes: *** indicates significance at the 1 per cent level; standard errors are in parentheses and are clustered at the division by size level |
||
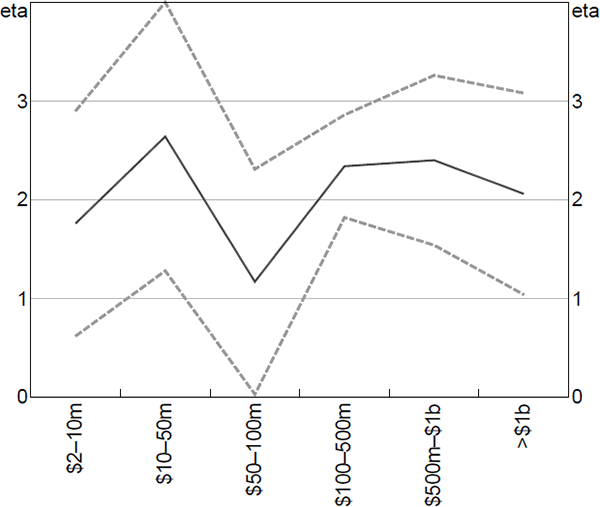
Figure C1 shows the estimated aggregate elasticities using different control groups. These are the elasticities used to construct the estimates of the macroeconomic effects in Section 6.5.
Figure C1: Aggregate DD Estimates
By control group

Note: Dashed lines are 95 per cent confidence intervals
