Bulletin – September 2018 Financial Stability Financial Stability Risks and Retailing
- Download 455KB
Abstract
Discretionary goods retailers are facing a challenging environment of increased competition, slow growth in consumer spending and changing consumer preferences. Despite this, these retailers generally appear to be in good financial health and there are many new shopping centres and refurbishments in the pipeline. Banks are active in funding these developments, and are increasing their exposure to retail commercial property, although they are reducing their exposure to retail businesses. If these new developments fail to attract sufficient customer spending, retailers may find themselves unable to pay rent to landlords who have taken on additional debt, and this could lead to losses at banks.
Background
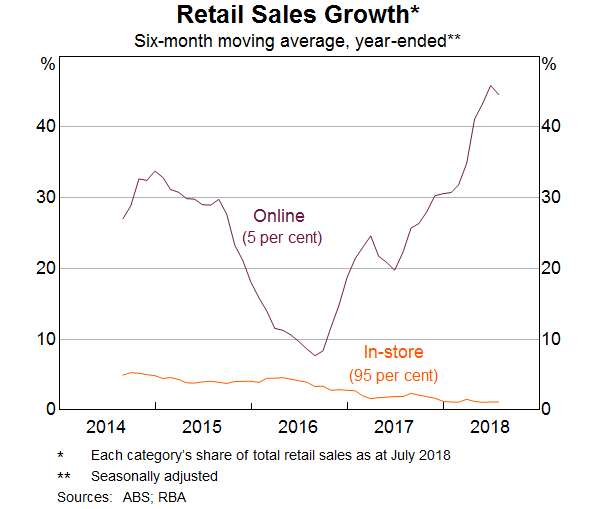
Competition from online shopping and large international retailers has created a challenging environment for domestic bricks-and-mortar retailers, particularly discretionary goods retailers.[1] International retailers tend to have lower cost bases, greater economies of scale and ‘just-in-time’ production models that allow rapid changes to inventories to keep up with trends. At the same time, online retailers are gaining market share (albeit from a low base) with online sales growing much more strongly than in-store sales (Graph 1).[2] This is occurring in an environment where consumer preferences are evolving as consumers allocate a larger share of their income towards retail services, such as cafes and restaurants, relative to goods.
There have been some high-profile failures of retailers over the past few years, although, to date, these remain isolated and the retail sector's corporate insolvency rate remains around its average.[3] The flow-on effect to Australian banks so far appears minimal. Australian banks' exposures to retail businesses are declining (Graph 2). But banks' exposures to retail properties are growing strongly. One contributor to this is the numerous refurbishments to shopping centres being undertaken to accommodate large international retailers and place a stronger emphasis on services and hospitality – differentiating shopping centres from online retailers. The volume of retail property development is now above its historical average, and banks appear to be funding much of this. One risk is that the changing retail environment might lead to store closures or insolvencies of domestic bricks-and-mortar retailers. This could result in higher vacancy rates at shopping centres and make it harder for shopping centre owners to meet their debt obligations. In turn, this could have implications for banks' asset quality.
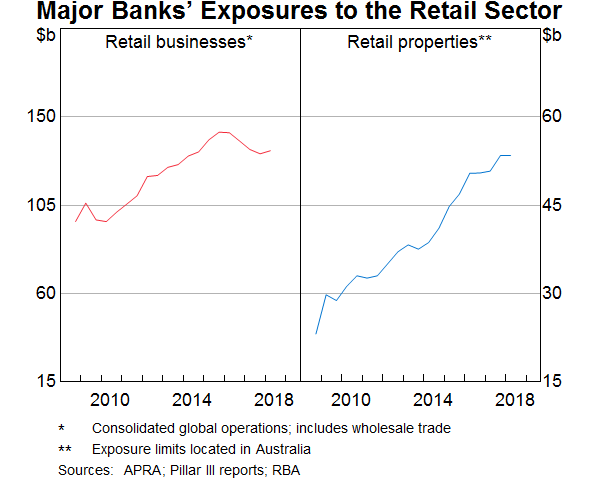
The major banks' non-performing loan ratios for the retail business sector and retail commercial property remain low. However, due to the difficulties currently facing these sectors, and the intention of some retailers to reduce their physical footprint, banks' growing exposure to retail properties warrants close monitoring.
The Financial Health of Retailers
We find that most discretionary goods retailers appear to be in good financial health. However, the financial position of some unlisted retailers has deteriorated, largely driven by a decline in profitability and liquidity. The analysis in this section is focused on discretionary goods retailers because these retailers are facing the strongest competition from online and international retailers. According to the Australian Bureau of Statistics (ABS) Business Longitudinal Analysis Data Environment (BLADE) database, there were around 50,000 discretionary goods retailers as at June 2015. By asset value, discretionary goods retailers accounted for around half of the total retail sector.[4] Within this group, department stores account for 10 per cent of the retail sector, as measured by total assets.
While the ABS BLADE dataset is comprehensive, it is not timely. Accordingly, the following analysis is based on more timely data on listed companies from Morningstar and on unlisted businesses from illion (formerly known as Dun & Bradstreet), a credit bureau. The Morningstar dataset has good coverage of listed discretionary goods retailers, while only about 120 unlisted discretionary goods retailers are included in the illion dataset. The representativeness of this latter group is questionable because firms in the database are likely to be those that applied for credit, and they are more likely to be relatively large companies as illion can more easily obtain financial information on these businesses. It is also worth noting that, while online-only retailers are excluded from the sample, some of the retailers in the sample may have online operations. Nevertheless, analysis based on these data can provide some indication of conditions.
To assess financial health, we use four indicators: profitability (return on equity, i.e. the ratio of earnings to equity); liquidity (ratio of cash to current liabilities); gearing (ratio of debt to equity); and debt servicing (ratio of interest expenses to earnings).[5] We focus on the tail of the distributions for each indicator, which capture businesses that are likely to be more vulnerable.[6]
Overall, most of these retailers appear to be in good financial health. However, the profitability and liquidity position of some unlisted retailers have declined. In particular, unlisted home furnishings retailers – which are highly leveraged – appear to have become more vulnerable as profitability has declined. Small-sized retailers also appear more vulnerable than large retailers.[7] The share of debt held by retailers classified as ‘vulnerable’ – that is, firms with at least two financial ratios in the most vulnerable 25th percentile of the distribution – increased over 2017. Most of this debt is concentrated among clothing and home furnishings retailers. The rest of this article explores these findings in further detail.
Key financial ratios
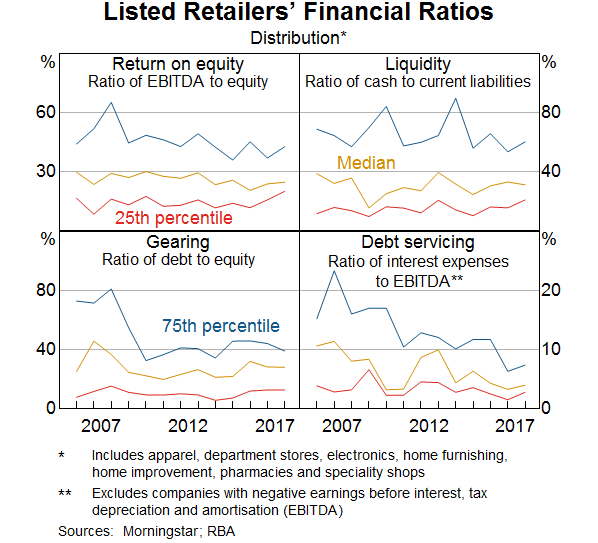
Listed discretionary goods retailers appear to be in good financial health overall. Their profitability is at relatively high levels and has improved over recent years across the distribution of profitability (Graph 3). Further, the share of companies making a loss has been broadly unchanged at around 5 per cent. Listed retailers are also well positioned to meet their short-term liabilities; the median liquidity ratio has been broadly stable at a high level in the post-global financial crisis period and the liquidity position of companies in the vulnerable tail of this distribution has improved over the past few years and reached a record high in 2017. Gearing ratios have been relatively stable at low levels across this distribution in the post-crisis period. In line with low levels of gearing and the low interest rate environment, discretionary goods retailers' debt-servicing burdens remain at very low levels and have fallen over the past decade for the top 25 per cent of companies.
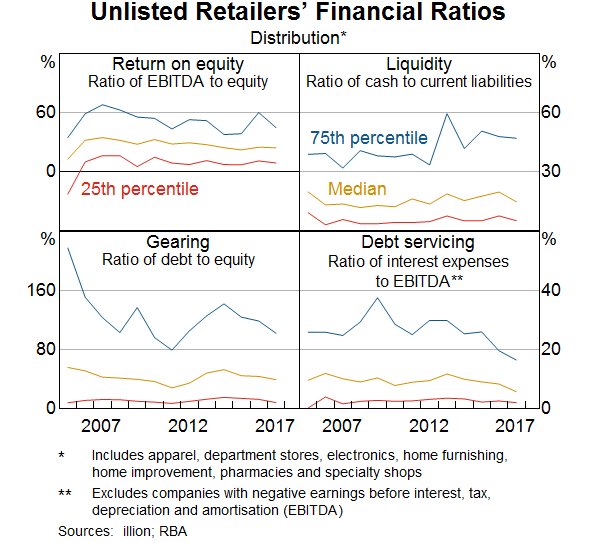
In aggregate, unlisted retailers also appear to be in good financial health although, for some businesses, on some indicators, it has deteriorated over 2017 (Graph 4). Debt-servicing ratios have trended downwards since the global financial crisis, consistent with the decline in interest rates. Although unlisted retailers' gearing ratios typically fell over 2017, more than one-quarter of retailers are highly indebted, with gearing ratios above 100 per cent. Most of these highly leveraged retailers were specialty shops, clothing, home furnishings and electronics retailers.
However, the liquidity ratios of unlisted retailers declined over 2017 and remain at relatively low levels. This has increased the risk that they will not be able to meet their short-term liabilities without selling assets. Home furnishings retailers appear to be more likely to face liquidity constraints as more than half of retailers in this category are below the 25th percentile of the liquidity distribution for unlisted retailers.
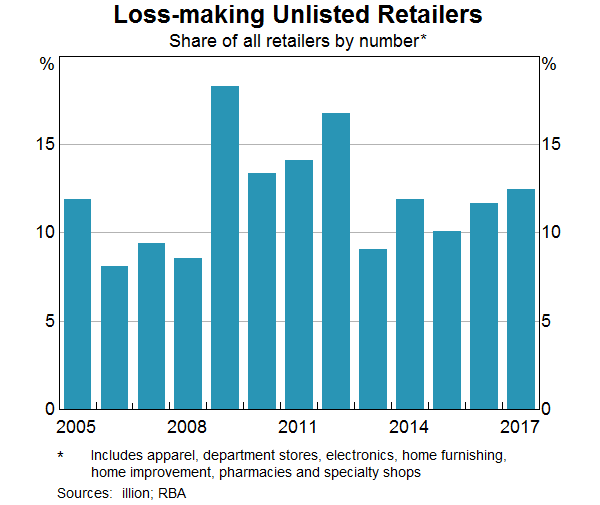
The profitability of unlisted retailers also declined across the distribution over 2017, with an increase in the share of loss-making firms (Graph 5). Over this period, losses became more prevalent among both small and large-sized firms, while the share of loss-making medium-sized retailers was little changed. Furthermore, together small and large-sized businesses account for around 40 per cent businesses in the sample of discretionary goods retailers. By sub-industry, home furnishings and electronics retailers have the greatest share of loss-making firms. However, loss-making retailers are, on average, smaller and so they account for less than 5 per cent of total retail sector assets and around 10 per cent of total retail sector debt. This suggests that unlisted loss-making retailers do not pose significant direct risks to the banking system.
Vulnerable companies
Although the above analysis suggests the overall financial health of retail businesses appears to be good, there may be problems at the individual business level, particularly as vulnerable businesses may not be well represented in the data sample. The sampled businesses are relatively large compared with those in the more comprehensive ABS BLADE dataset, and businesses in the sample are likely those that applied for credit. Caution should be taken when interpreting these results as they are subject to survivorship bias – businesses that fail drop out of the data sample and so cannot be included in the analysis.[8]
We assess the vulnerability of retailers based on whether at least two out of the four financial ratios fall in the most vulnerable 25 per cent of their distributions. Further, vulnerability does not necessarily translate to financial stress – healthy businesses may have relatively high gearing ratios and debt-servicing costs, but may be able to safely sustain these due to strong profitability.
By our metric, 40 per cent of the $2.5 billion of listed company debt was owed by vulnerable retailers in 2017. Most of this debt was owed by electronics and specialty retailers (Graph 6). Additionally, a greater proportion of small and medium-sized listed retailers are classified as vulnerable.
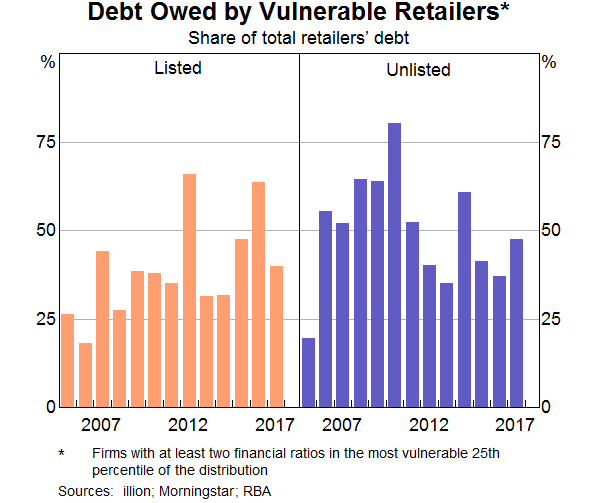
The share of unlisted retailers' debt owed by vulnerable retailers rose noticeably over the past year. In June 2017, around half of the $6.3 billion of unlisted business debt was owed by retailers identified as vulnerable in our sample. Most of this debt is concentrated among clothing and home furnishings retailers. Small retailers are more likely to be classified as vulnerable than larger retailers, and the share of home furnishing firms classified as vulnerable has risen sharply over recent years.
Retail Commercial Property
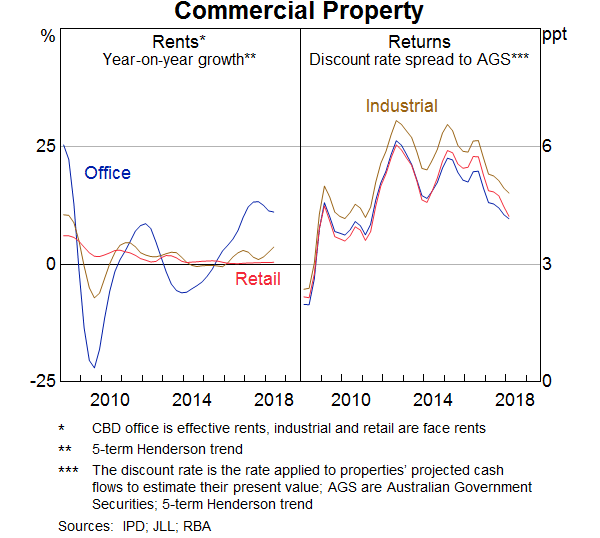
The headwinds faced by the retail sector have caused subdued demand for retail floor space and stagnating rental growth (Graph 7). However, liaison suggests that landlords have largely managed to avoid vacancies by offering significant incentives in the form of rent-free periods and store fit-outs (Graph 8). Landlords have also responded to the evolving retail landscape by changing the tenancy mix to have fewer small (domestic) specialty stores and more large (international) retailers. The latter are able to negotiate relatively lower rents due to their size and ability to attract foot traffic. Recent liaison with shopping centre owners and industry analysts indicates that rents on new leases are broadly lower than expiring leases, suggesting that rental demand has softened in recent years.
Even though rents have been flat for some years, returns to retail property investments remain in line with other commercial property asset classes (Graph 7). This is because the valuations of retail property investments have been growing at a slower rate than valuations for other commercial property classes. However, the very similar returns for retail properties relative to office or industrial property suggest property valuers are probably not pricing in any sectoral risk for retail properties relative to other commercial property asset classes.
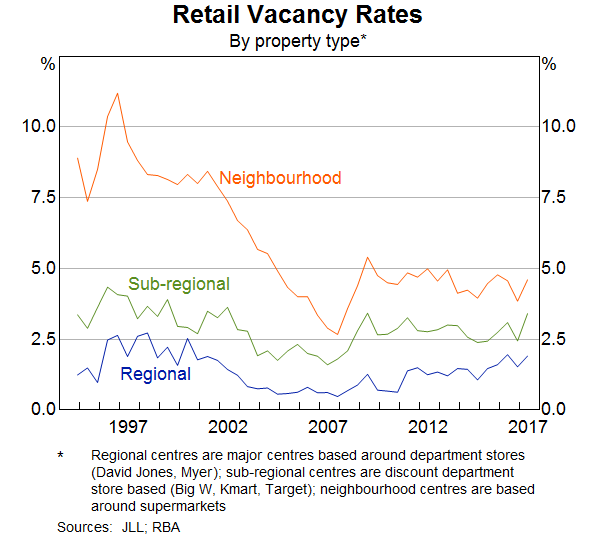
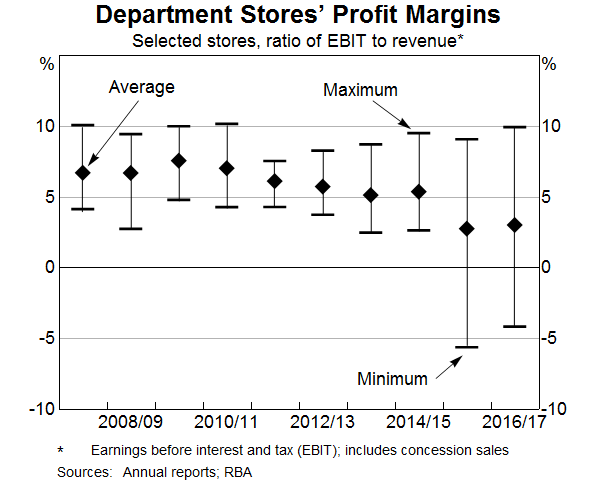
However, department stores, which take up a large amount of floor space in shopping centres, have been facing difficult conditions in recent years, with sales growth falling to very low levels. With some department stores experiencing low turnover and falling margins, landlords face the risk of having their largest tenant vacate their premises, which may leave space that is difficult to repurpose (Graph 9). This may have a flow-on effect to surrounding shops that are already facing challenging conditions.
Many shopping centres are being refurbished to attract high-quality hospitality tenants, large international retailers and non-retail service tenancies to offer a different experience to shoppers that cannot be provided by online retailers. Most analysts anticipate a widening gap between the value of high-end and lower-tier retail properties. During Reserve Bank liaison, the major banks have expressed confidence in higher-quality shopping malls, but suggested that older, less well-located malls may struggle to find tenants.
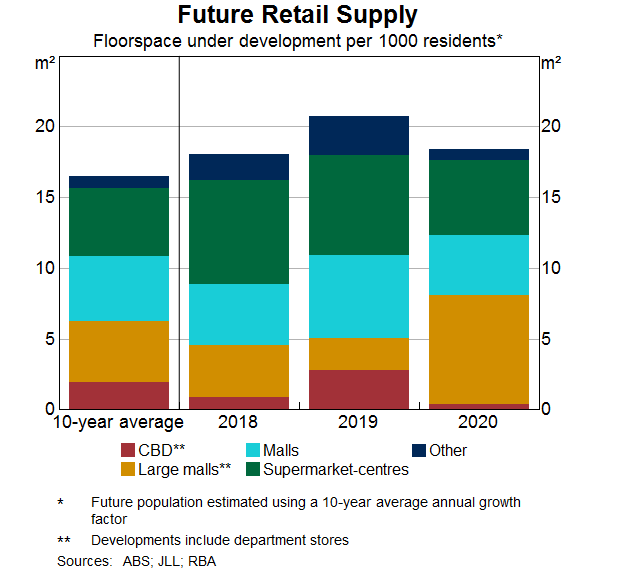
Despite flat rents and an uncertain outlook for tenant demand, the development pipeline for retail property is expected to be above its historical average for the next three years, in per capita terms (Graph 10). This increase in supply is partly driven by new neighbourhood ‘convenience centres’, based around supermarkets. The major contributor is the refurbishment of regional and sub-regional shopping centres to accommodate more services such as cafes, medical centres, entertainment and large international retailers.
In per capita terms, the intensity of retail development differs significantly across states, with Queensland and Western Australia expecting a stronger increase in retail floor space than Victoria and New South Wales (Graph 11). In Queensland, this is mostly new convenience centres, servicing the new high-density residential developments of Brisbane, and the developing corridor between Brisbane and the Gold Coast. In Western Australia, refurbishments and extensions of existing centres are driving supply. The recent easing of zoning restrictions in Perth, which previously limited the total floor space of retail properties, appears to have triggered many of these recent refurbishments and expansions, despite the state's weak economic conditions. Reserve Bank liaison with industry suggests that the near simultaneous commencement of these refurbishments is also from centre owners wanting to minimise losing foot traffic to other nearby malls undergoing refurbishment. New South Wales also has a potentially large amount of refurbishments in the pipeline. Many of these projects are only in the planning phase, do not have financing secured and have yet to begin construction.
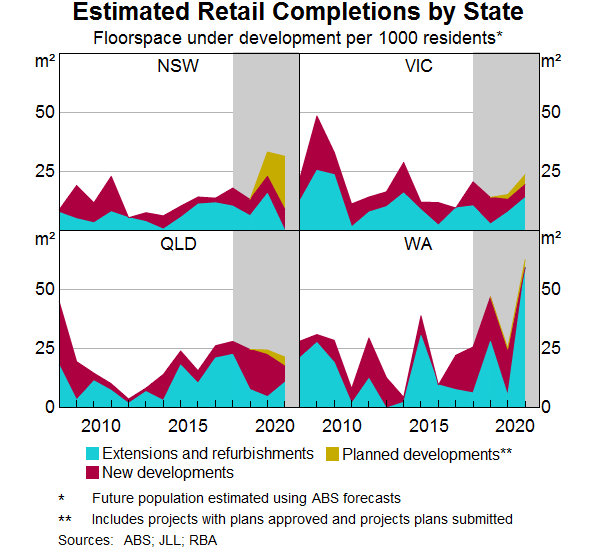
While the scale of shopping centre expansions appears high by historical standards, some analysts estimate that the stock of retail floor space per capita will remain lower than 10 years ago due to population growth – except in Western Australian where population growth has slowed significantly. As such, analysts assess that, in most states, the property market is adjusting to the reduced demand for retail floor space, and is not likely to be oversupplied.[10]
Banks' Retail Property Exposures
Retail development activity has coincided with growth in bank lending to retail property outpacing lending to other classes of commercial property. Retail property lending now accounts for one-quarter of banks' total commercial property exposures, up from 18 per cent in 2008. The major banks provide more than 80 per cent of this lending and they have accounted for most of the growth in retail exposures since the global financial crisis. Nevertheless, lending to retail commercial property accounts for less than 2 per cent of the major banks' total assets.
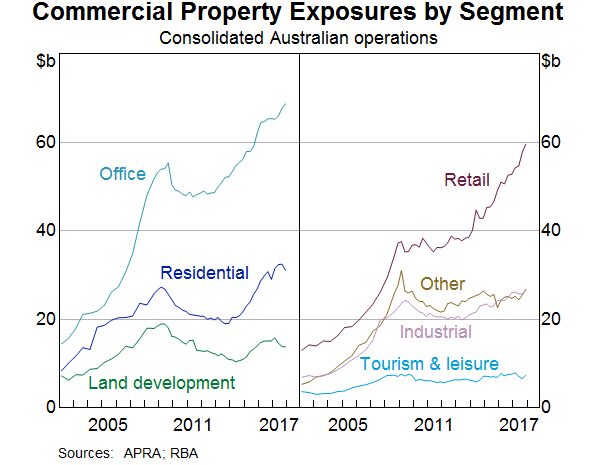
Risks
Although there is currently no strong evidence of widespread vulnerability, retailers and investors in retail property face a number of risks. If retailers are unable to adapt their business models to changing conditions quickly enough, their financial position may deteriorate and they may be forced to close stores or cease operating altogether. Liaison suggests that banks are concerned about the outlook for discretionary goods retailers, which is weighing on their willingness to lend. Additionally, department store closures could result in large vacant spaces in shopping centres. To the extent that these multi-floor spaces are difficult to repurpose quickly, closures may also have spillover effects on the profitability of neighbouring shops and could result in a sharp increase in vacancies.
Many new retail property developments include significant expansions in the floor space dedicated to specialty shops, as well as to hospitality and services. For retail property investors, a key risk is that these service- and hospitality-focused refurbishments may fail to attract the foot traffic required to sustain tenants' profit margins. While each development may individually appear sound, if they merely attract foot traffic away from nearby centres, they could deteriorate the financial position of those centres. Additionally, the increased foot traffic attracted by the dining and service offerings may not translate into increased sales for other specialty shops in the centre, posing a risk to the viability of these businesses. Owners of refurbished centres, or nearby centres, may then find themselves unable to meet debt obligations and be forced to sell, precipitating price declines. Price falls generated by sell-offs, or unexpected increases in long-term borrowing rates, would depress valuations, which might then mean owners breach loan-to-value ratio covenants on their bank debt, potentially triggering further sales and price declines.
Floor space within refurbished centres may also prove difficult to repurpose should consumer preferences shift further away from bricks-and-mortar retailing than anticipated. Liaison has indicated that some shopping centre owners are considering repurposing potentially vacant floor space into warehousing and distribution hubs for online retailers. However, there have been very few examples of this repurposing, and it remains unclear whether warehousing tenants would be willing to pay rents of a similar level to previous retailing tenants.
The retailing sector is facing considerable change and is having to adapt. Retailers, property owners and banks all face risks from this change. Overall, the risks appear greater for individual retailers and property owners as some centres may benefit from the change at the expense of other centres. For banks with large diversified retail exposures, the risks would seem smaller, unless there is a widespread downturn for bricks-and-mortar retailing, for example precipitated by online retailers.
Appendix A
Data and Characteristics
Disaggregated data on Australian businesses are available from a limited number of sources. This article mostly draws on two sources of disaggregated data which contain yearly data from 2005 to 2017 and vary in coverage. The first dataset is from illion, a credit reporting bureau, and covers a sample of unlisted retailing businesses. This sample includes both private and public unlisted firms and contains annual data.[11] We also use disaggregated data on retail companies listed in the Australian Securities Exchange (ASX) from Morningstar. Businesses in our samples are larger than the average Australian discretionary retailing business but they hold around 20 per cent of total assets in the retail sector. As a result, insolvencies among these firms can have significant effects on the real economy.
Firm level data is also available from the ABS BLADE database. This database contains yearly financial data on almost every business in Australia (excluding sole traders) from June 2005 to June 2015. Due to the lack of timeliness, we mostly draw on these data to document some characteristics of Australian retailers.
Footnotes
The authors are from Financial Stability Department. [*]
These include apparel, electronics, home furnishings, and home-improvement retailers, department stores, pharmacies and specialty shops. [1]
Online-only retailers are innovating by providing increasingly flexible returns policies, quicker and more flexible deliveries, product reviews and a more personalised service. In response, bricks-and-mortar retailers are enhancing ‘in-store’ shopping experiences by improving customer service and implementing ‘omni-channel shopping’ (which integrates online and in-store purchases, returns and exchanges), as well as growing their e-commerce and social media presence and seeking to reduce their supply costs. [2]
According to Colliers International 2017, over half of the 33 high-profile retail failures since 2012 were from the apparel category. Available at <http://www.colliers.com.au/find_research/retail/retail_-_second_half_2017>. [3]
Excludes businesses whose share of total sub-industry assets increases by more than threefold from year to year as these numbers are likely to be misreported. [4]
A large body of literature has shown that these ratios are significant predictors of business failure, for example see Beaver (1966), Altman (1968) and Bunn and Redwood (2003). [5]
For more information on the data used to assess the financial health of listed and unlisted retail companies, and the characteristics of this sector, see Appendix A. [6]
We define small businesses as those with less than $10 million in assets, medium-sized businesses as those with more than $10 million but less than $100 million in assets, and large businesses as those with $100 million or more in assets. [7]
illion collects data on businesses predominantly when the prospective lender asks illion for a credit assessment of the prospective borrower. Businesses applying for credit may be more leveraged than other firms and therefore more vulnerable to unexpected negative shocks. On the other hand, larger businesses may be less likely to fail than the average small or medium-sized business. As a result, whether the riskiness of unlisted businesses in the sample is higher or lower than the population of businesses is unclear. For further detail, see Kenney, La Cava and Rodgers (2016). [8]
Planned developments did not have an expected completion date cited in the data. Projects with plans approved were lagged by a distribution around three years and assumed to have a 75 per cent completion rate. Projects with plans submitted were lagged by a distribution around four years and assumed to have a 50 per cent completion rate. [9]
Jones Lang LaSalle (2017) [10]
Australian public companies are excluded from the sample. [11]
References
Altman E (1968), ‘Financial ratios, discriminant analysis and the prediction of corporate bankruptcy’, The Journal of Finance, 23(4), pp 589–609.
Beaver W (1966), ‘Financial Ratios as Predictors of Failure’, Journal of Accounting Research, 4, pp 71–111.
Bunn P and V Redwood (2003), ‘Company accounts based modelling of business failures and the implications for financial stability’, Bank of England Working Paper No 210.
Colliers International (2017), ‘Retail Research and Forecast Report’, Second Half 2017, November.
Colliers International (2018), ‘Retail Research and Forecast Report’, First Half 2018, June.
Rooney S and Quillfeldt A (2017), ‘Australian Shopping Centre Investment Review & Outlook 2017’, Final Report, March.
Jones Lang LaSalle (2017), ‘Australian Shopping Centre Investment Review and Outlook 2017’, Final Report, March.
Jones Lang LaSalle (2018), ‘Australian Shopping Centre Investment Review & Outlook 2018’, Final Report, April.
Kenney R, G La Cava and D Rodgers (2016), ‘Why Do Companies Fail?’, RBA Research Discussion Paper No 2016-09.