Bulletin – June 2018 Finance The Australian OTC Derivatives Market: Insights from New Trade Repository Data
- Download 1MB

Abstract
Over-the-counter (OTC) derivatives have played a significant role in episodes of financial stress, including the global financial crisis. However, because these derivatives are not traded on exchanges, detailed information about them has not generally been available. Newly available trade-level data coming from trade repositories can now facilitate a closer look at these markets than was possible before. This article focusses on OTC interest rate derivatives. Central counterparties (CCPs) have become much more important, in large part because of G20 reforms to increase the central clearing of OTC derivatives. Nonetheless, Australian banks still have significant exposures to other counterparties, including foreign banks. In aggregate, Australian banks hold a variety of offsetting single-currency interest rate derivatives, and use cross-currency swaps to hedge exchange rate risks.
Background
Financial institutions and non-financial corporations use derivatives both to mitigate the risks they face from changes in prices and interest rates and to take speculative positions. They do so both with derivatives traded on exchanges and in OTC derivatives, which are typically agreed privately between the two counterparties. One advantage of OTC derivatives is that they are more flexible than derivatives traded on an exchange because they can be customised to meet the individual needs of the counterparties.
Before the financial crisis, regulators generally only had access to highly aggregated data to understand the OTC derivatives market. In Australia, this was either from bank-reported data compiled by the Australian Prudential Regulation Authority, from supervisory data for CCPs licensed in Australia or from periodic survey measures (produced by the Reserve Bank (the Bank) or the Bank for International Settlements (BIS)). However, the global financial crisis highlighted that these aggregated data are insufficient to shed light on the vulnerabilities that can exist when there is a web of derivative transactions between a large variety of firms.
To address these issues, in 2009 the G20 committed to a number of reforms. These aimed to improve transparency, combat market abuse and decrease systemic risk (CFR 2012). This resulted in requirements on a wide range of financial institutions to report every OTC derivative trade to regulators, via trade repositories. Trade repositories collect and store information on OTC derivatives. In Australia, the Australian Securities and Investment Commission (ASIC) made trade reporting rules in 2013. The trade repositories now provide these data to the Bank and ASIC daily. This article uses trades reported to DTCC Data Repository Singapore (DDRS), which covers the vast majority of the Australian OTC derivatives market. Some trades are reported to a small number of other trade repositories.
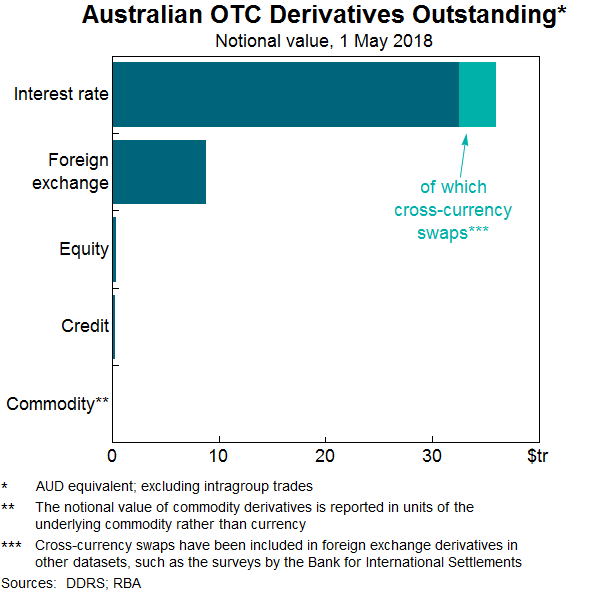
This article provides a summary of the new trade repository data, focusing on OTC interest rate derivatives, which account for the vast bulk of OTC derivatives outstanding (Graph 1). Future work will consider other OTC derivative products such as foreign exchange swaps, which are used regularly by Australian entities. Using these data, we examine the structure of the market and highlight some key trends. We also analyse the growth in central clearing and how Australian banks use OTC interest rate derivatives. The aim of the article is to take a general look at the OTC interest rate derivatives market, providing a foundation for future work to examine more deeply the vulnerabilities that may be present.
Australian Trade Repository Data
Trade repository data capture each OTC derivative open in the Australian market at the end of each business day. The ‘Australian market’ includes any OTC derivative (whether or not it is centrally cleared) entered into by an Australian entity or their overseas subsidiaries, or by foreign entities where the trade is booked or entered into in Australia (ASIC (Australian Securities and Investments Commission) 2013).[1] This means that the Australian trade repository data cover only part of foreign entities' global activity. Notably, the data do not include Australian dollar-denominated trades booked or entered into outside Australia between two foreign entities. The reporting requirements started for large entities in October 2013 and applied to all entities by 2015.[2] This article focusses on the data from 2016, which are more complete.
The Australian trade repository data include around two million records reported each day, and almost two billion records in total so far. Each record includes around 80 pieces of information, including the counterparties, notional value, maturity, price and interest rate, mark-to-market value and collateral data. These data can be used to assess financial stability risks, market conduct and market functioning. Internationally, other central banks and securities regulators have also recently started using trade repository data to analyse market structure (Abad et al 2016) and risk events (Cielinksa et al 2017), among other things.
Data submitted to trade repositories are not revised for errors, so the Bank and ASIC have developed tools to clean the data. However, this limitation needs to be considered when interpreting the data. Further improving the quality of trade repository data remains a focus for regulators.
Market Structure and Key Trends
Most OTC interest rate derivatives are swaps, where counterparties exchange payments based on the difference between two interest rates. By contrast, most exchange-traded interest rate derivatives in Australia are futures contracts (agreements to purchase particular assets at a future time for a predetermined price) that reference bonds or bank bills. The OTC interest rate derivatives market is much larger than other OTC derivatives markets as measured by notional value (explained below) because hedging different interest rates is important to the banks given the vast majority of their assets and liabilities earn interest income or are serviced by interest repayments. The Australian OTC interest rate derivatives market consists of six broad products:
- Fixed-to-floating swaps exchange regular payments based on the difference between a fixed rate and a floating (or variable) rate in the same currency.
- Overnight indexed swaps (OIS) are a special type of fixed-to-floating swaps where the floating interest rate is an overnight interbank lending rate.
- Forward rate agreements (FRAs) are similar to fixed-to-floating swaps and begin sometime in the future. The main difference is that only a single payment is exchanged during the contract, rather than many.
- Basis swaps exchange payments based on two floating rates in the same currency (e.g. effectively converting a 6-month floating rate into a 3-month floating rate).
- Cross-currency swaps exchange both a lump sum value and interest payments from one currency into another, based on an exchange rate decided at the start of the contract.
- ‘Other’ includes fixed-to-fixed interest rate swaps, inflation swaps and option-style instruments.
There are around $36 trillion in outstanding OTC interest rate derivatives in the Australian market, measured by notional value (Graph 2). Notional value is the amount from which the interest payments on a derivative are calculated and is most commonly used to measure the size of derivative markets. However, notional value overstates what the derivative positions are worth to the entities that own them. This is mainly because the notional value is rarely exchanged (cross-currency swaps are an important exception). Other measures of the size of OTC derivatives positions are more suitable for different purposes:
- The gross market value of derivatives is the sum of the current resale value of all outstanding derivatives. This is much smaller than notional value, at around $470 billion.
- Gross credit exposure is a better measure of risk than notional value or gross market value. Gross credit exposures captures the gross market value of outstanding derivatives after netting trades between each pair of counterparties. It is currently around $140 billion in the Australian market.
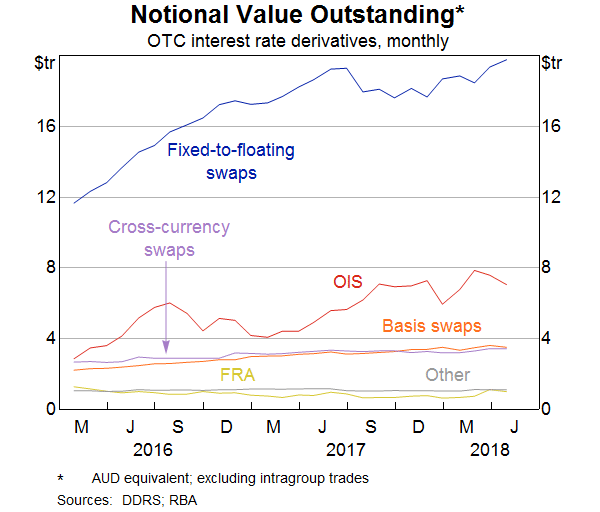
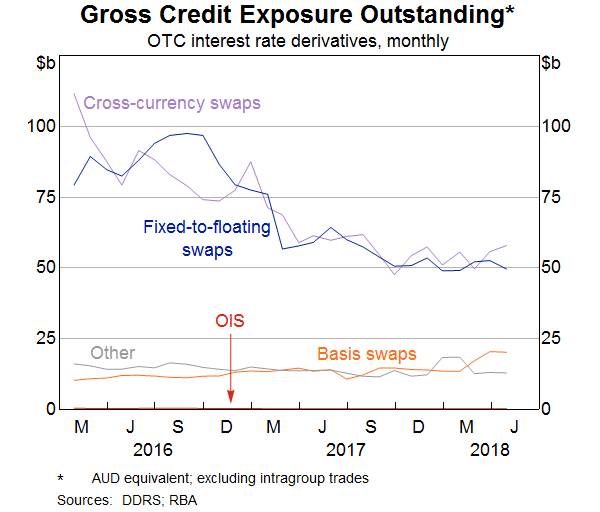
The relative size of the market for each type of OTC interest rate derivative depends on the measure. By notional value outstanding, fixed-to-floating swaps account for more than half of activity, with OIS (the next largest) having a 20 per cent share. Cross-currency and basis swaps are both smaller markets and are roughly equal in size. However, in terms of gross credit exposures, cross-currency swaps contribute a much larger share of the risk (Graph 3). This is because the notional value is exchanged at the start and end of the swap (unlike in single-currency swaps where the notional value is not exchanged). The market value of the amount exchanged at the end of the swap can be volatile because it fluctuates with the exchange rate. At the other extreme, OIS products contribute very little in gross credit risk terms – despite significant activity in these products – both because the notional value is not exchanged and because contract maturities are usually short.
As measured by notional value, activity in the Australian OTC interest rate derivatives market has increased significantly since early 2016. This increase has mainly been driven by fixed-to-floating interest rate swaps (especially swaps with a maturity less than one year) and OIS. By contrast, gross credit exposures fell over 2016 and have been broadly stable since then. This continues the decline seen in previous years that is also apparent internationally (Garner, Nitschke and Xu 2016). The fall in global market volatility (and relative stability in exchange rates and interest rates) likely contributed to this decline in gross credit exposures, because the market values of individual derivatives generally only deviate from zero if the price of the underlying asset has moved since the contract was initiated. If market volatility was to increase, we would expect gross credit exposures to rise as well.
Counterparties
Figure 1 shows the gross market value of OTC derivatives outstanding between different types of counterparties. The size of the circles show the value of derivatives held by each counterparty type, while the arrows reflect the size of positions between types of counterparties. The share of a given counterparty type's positions with each other type of counterparty is shown around the circle. These data allow a more complete breakdown of activity between different pairs of counterparties than was previously available, enabling a more detailed understanding of the interconnections.
The data confirm that Australian banks, foreign banks and CCPs are the largest counterparties in the Australian OTC interest rate derivatives market. Around two-thirds of Australian banks' activity are with foreign banks or cleared through CCPs. When a derivative is centrally cleared, the original trade (for example, entered into between two banks) is replaced by two identical but opposite contracts, between a CCP and each of the original counterparties. There is no longer a direct relationship between the original parties; the activity reported in trade repository data reflect this. Central clearing shifts the counterparty risk from the original counterparties to the CCP – each counterparty is now exposed to the CCP and the CCP is exposed to the various counterparties. In this example, the banks would not have any direct counterparty exposure to each other from the original trade. However, the market risk (risk of financial loss due to price and value changes) they face is unchanged.
Banks' remaining activity is with a wide range of counterparties, including other Australian banks (around $12 billion in gross market value between Australian banks). These include trusts (particularly special purpose vehicles for residential mortgage-backed securities and covered bonds), various non-bank financial institutions (asset managers and sovereign, supranational and agency entities) and non-financial corporations. The trades of foreign banks captured in the data are also broadly dispersed across a similar range of entities. However, as noted above, the trade repository data that the Bank and ASIC receive cover only part of their global activities (that which occurs in the Australian market).
This figure shows the gross market value exposures of OTC interest rate derivatives between different types of counterparties in Australian market. Australian banks are the largest counterparties in the market, followed by foreign banks and CCPs. The largest exposures are between Australian and foreign banks and between Australian banks and CCPs.
[†] AUD equivalent; excluding intragroup trades; coloured borders show the shares of exposures to each type of counterparty
Source: DDRS; RBA
Maturity and currency characteristics
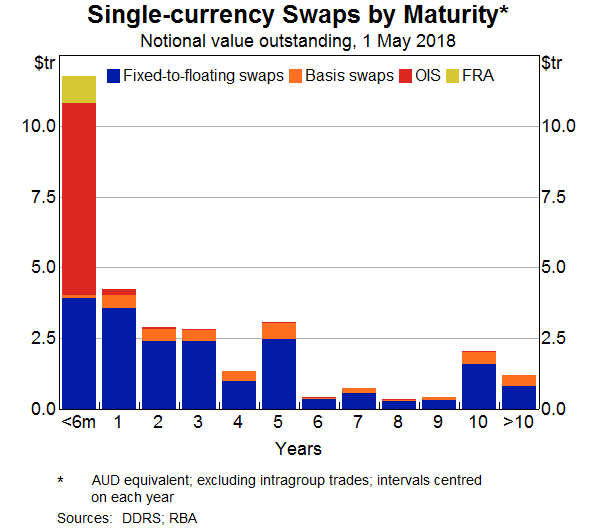
Among single-currency interest rate swaps, there is a wide range of maturities traded (Graph 4). Fixed-to-floating swaps are traded with both very short and very long maturities, as are basis swaps. By contrast, OIS tend to have short maturities (almost all are less than six months).
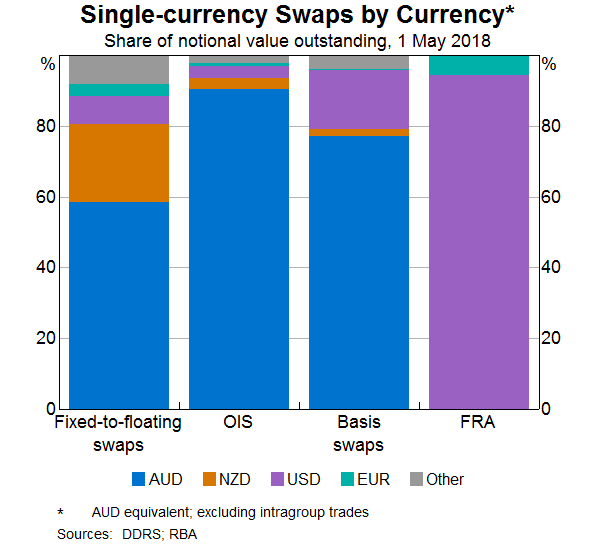
Around half of fixed-to-floating rate swaps by notional value are denominated in Australian dollars, but New Zealand dollar swaps are also common because Australian banks are exposed to New Zealand dollar interest rates through their New Zealand subsidiaries (Graph 5). The Australian dollar accounts for a greater proportion of OIS and basis swaps. By contrast, there are very few Australian dollar FRAs recorded in the database, as the market now mostly uses fixed-to-floating swaps instead.
Cross-currency derivatives are very important for Australia because they are used by Australian banks to hedge the foreign currency risk from foreign currency funding raised offshore.[3] The trade repository data confirm a number of key facts about the cross-currency derivatives market in Australia identified in past research (Arsov et al 2013; Garner, Nitschke and Xu 2016; Berger-Thomson and Chapman 2017):
- Foreign banks and non-resident (or ‘kangaroo’) bond issuers in Australia are active participants in the market and enter cross-currency swaps to hedge their Australian dollar liabilities into their home currency (Bergmann and Nitschke 2016). However, it appears that kangaroo bond issuers may enter OTC derivatives mostly with foreign counterparties outside of Australia. This is because their activity reported in Australian trade repository data, which only covers their trades with Australian entities or which are booked in Australia, is small relative to the outstanding amount of kangaroo bonds;
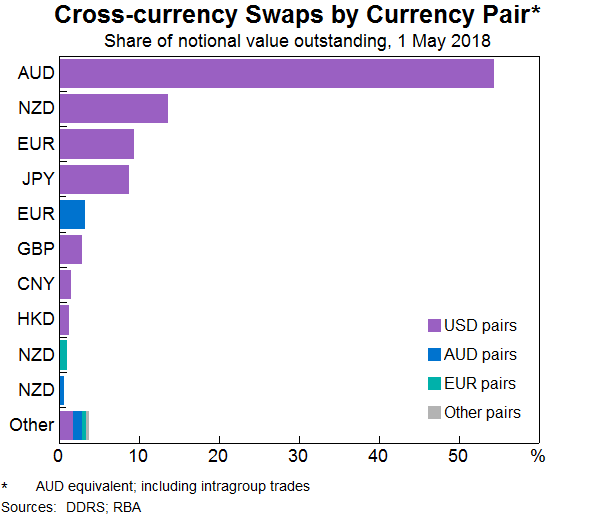
- Most cross-currency transactions involve the US dollar. In the trade repository data, these account for over 90 per cent of trades (Graph 6). This high share reflects that swaps between two currencies other than the US dollar generally are executed using two swaps that both reference the US dollar. While the Australian dollar is by far the most common counterpart currency to the US dollar, NZD/USD swaps are the second most common for reporting entities, reflecting the significant lending activities of Australian banks' New Zealand subsidiaries; and
- Around two-thirds of outstanding transactions have residual maturities of less than five years.
We discuss how Australian banks use these products in more detail below.
The Growing Role of Central Counterparties
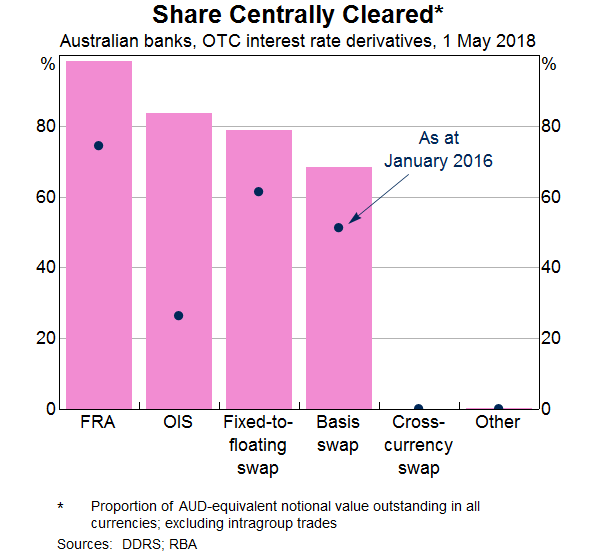
The clearing of single-currency OTC interest rate derivatives through CCPs has increased significantly over the past five years or so. Prior to 2012, Australian banks cleared almost none of their OTC interest rate derivatives (Edey 2015). The share cleared by Australian banks has continued to grow in recent years; they now clear over three-quarters of their single-currency swaps (Graph 7). These are cleared through three CCPs: ASX Clear (Futures), Chicago Mercantile Exchange Inc and LCH Ltd, which are licensed to operate in Australia. As noted above, when a derivative is centrally cleared by a CCP, the original trade is replaced by two identical but opposite contracts, between that CCP and each of the original counterparties. This means there is no longer a direct relationship between the original parties, and the counterparty risk shifts from the original counterparties to the CCP.
The growth in central clearing has been partly driven by ASIC requirements that certain OTC interest rate derivatives between large financial institutions in major currencies are cleared (ASIC 2015). Australian banks do not have to clear all their single-currency swaps; some are still outstanding from before the rules were introduced, or are not captured by the requirements (such as trades with smaller entities or in minor currencies).
Other factors have also incentivised firms to clear more of their OTC derivatives, by increasing the relative benefits to clearing (namely, that may be cheaper to clear than not to clear). These include higher capital and collateral requirements for OTC derivatives that are not cleared, and the potential to lower capital requirements further if trades with multiple counterparties can be netted in a CCP (BIS (Bank of International Settlements) 2014; FSB (Financial Stability Board) 2017).
In line with these clearing benefits, some OTC derivatives not covered by the mandatory clearing requirements are still centrally cleared. A notable example is NZ dollar interest rate derivatives, where about 80 per cent of trades involving Australian entities are cleared. The trade repository data also show that a growing number of smaller entities (such as investment funds) are clearing their OTC interest rate derivatives.
In contrast to single-currency swaps, cross-currency swaps are not required to be cleared and, to date, Australian entities (most notably banks) do not clear them. This is partly because they are relatively challenging to clear, requiring significant collateral to cover the exposure to changes in exchange rates on the lump sum exchanged at the end of the swap. However, a small number of CCPs are beginning to offer cross-currency swaps for clearing.[4]
The clearing process allows participants to offset positions across multiple counterparties; this simplifies the web of connections between counterparties. CCPs are also specialist risk managers: they hold significant financial resources to manage the default of a counterparty, which can limit the negative effects on surviving counterparties in the market. While markets benefit from this, the shift towards clearing concentrates risk in CCPs. As a result, CCPs are closely scrutinised by regulators (in Australia, by the Bank and ASIC) to ensure they operate safely. Regulators also continue to work to ensure CCPs can recover from losses or be resolved without taxpayers bearing the cost (FSB, BCBS (Basel Committee on Banking Supervision), CPMI (Committee on Payments and Market Infrastructures), IOSCO (International Organization of Securities Commissions) 2015).
How Australian Banks Use OTC Interest Rate Derivatives
Australian banks use OTC interest rate derivatives to hedge their own risks, speculate on price and interest rate changes and make markets in OTC derivatives for their clients. Making markets typically involves the bank offsetting the risks from trades with their clients by entering into another derivative with another counterparty (such as a large foreign bank).
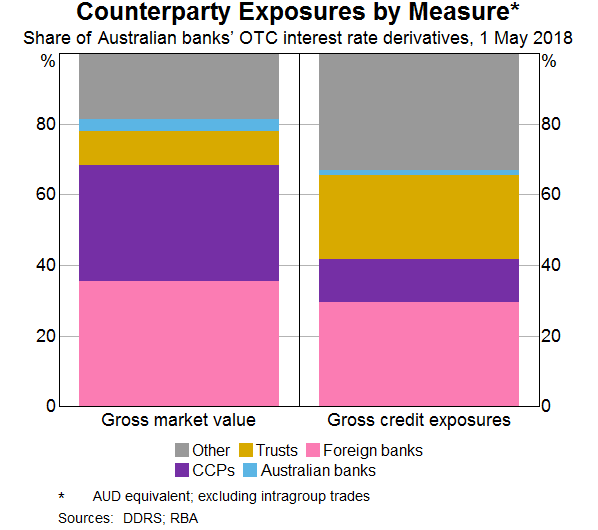
As previously mentioned, most of Australian banks' OTC derivatives positions are with CCPs and foreign banks (as measured by gross market value; Figure 1). However, their counterparty risk exposure, as measured by gross credit exposure, is more concentrated with foreign banks than with CCPs. Graph 8 compares the two measures of Australian banks' exposures to different types of counterparties. CCPs (the purple bar) comprise around 30 per cent of Australian banks' gross market value, but only about 10 per cent of gross credit exposure. By contrast, Australian banks to foreign banks (the pink bar) is roughly similar for both measures.
There are two main reasons for the difference between the size of Australian banks' positions and counterparty risk exposures to CCPs versus foreign banks:
- Counterparty netting. As noted above, a key benefit of clearing is the ability to net positions that were originally entered into with multiple counterparties. This reduces gross credit exposure, but not gross market value. By contrast, Australian banks have trades with a larger number of foreign banks, which reduces netting opportunities.
- Direction of cross-currency swaps. As discussed below, Australian banks' cross-currency swaps tend to all be in the same direction to hedge their foreign currency bonds issued offshore. That is, they mostly enter trades where they receive payments in foreign currency and pay in Australian dollars after the initial payment. In addition, the exchange of principal in cross-currency, but not other, swaps means that they have more risk than a single-currency swap of the same size. Since cross-currency swaps are not cleared and so are largely traded with foreign banks (see below), this tends to result in larger gross credit exposures with foreign banks.
Australian banks' gross credit exposures to trusts and other counterparties (the yellow and gray bars in Graph 8) are also relatively larger than activity measures (gross market value or notional value) would imply. Unlike Australian banks, these counterparties tend not to engage in market-making. Rather they mostly hedge their own exposures by entering derivatives with an Australian or foreign bank. These counterparties therefore tend to have few offsetting derivative positions.
Single-currency swaps
Australian banks enter fixed-to-floating swaps for a range of reasons, including to hedge interest rate risks on their balance sheets (see RBA (2018) for more information about Australian banks' exposures to interest rate risk). Trade repository data confirm previous work showing that Australian banks have net receiver positions in fixed-to-floating interest rate swaps; that is, they enter more trades where they receive the fixed rate than those where they receive the floating rate (Graph 9). This means that, if longer-term interest rates decline, their fixed-to-floating swap positions are likely to increase in value. The net receiver positions are most pronounced at 1-,5- and 10-year maturities, with the 5- and 10-year maturities matching the pattern of their long-term bond issuance. Although Australian banks have more fixed-to-floating trades at shorter maturities by notional value, their trades at longer maturities contribute significantly more to their market risk exposure. This is because the longer maturity contracts have more cash flows over their full life, so their value is more sensitive to movements in interest rates.
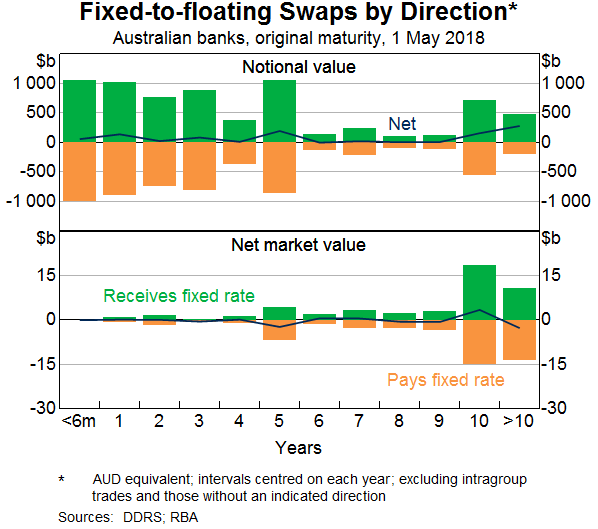
Australian banks (and other participants) use OIS to hedge or speculate on changes in the RBA cash rate. Because of this, pricing in the OIS market provides an estimate of the market's expectations for the future cash rate (Finlay and Olivan 2012). These data suggest that Australian banks enter trades on both sides of this market.
Basis swaps are used to hedge the risk that different interest rates move away from – or towards – each other. The most common type of Australian dollar basis swaps reference the bank bill swap rate (BBSW) at different tenors (such as three and six months). They can be used to convert payments at a six-monthly frequency (which is typical for bonds) to a quarterly frequency (more common for fixed-to-floating rate swaps). A small share of Australian dollar basis swaps reference the spread between BBSW and the cash rate.
Cross-currency swaps
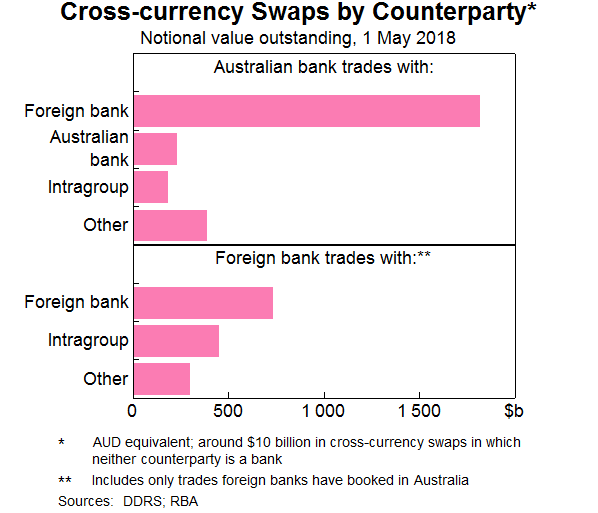
In the cross-currency swaps market, just under half of outstanding trades by notional value are between an Australian bank and a foreign bank (Graph 10). Australian banks' cross-currency positions with foreign banks are moderately concentrated, with five large international dealers comprising just over half of these positions. The largest of these dealers are banks headquartered in the United States.
Intragroup trades (that is, trades between entities in the same consolidated group) account for 16 per cent of activity. These trades are particularly important in cross-currency swaps, and can be used to transfer risk between countries, for example, by an Australian bank and its New Zealand subsidiary. Australian banks also provide cross-currency swaps to other counterparties, such as trusts, large non-financial corporates and sovereign, supranational and agency entities, so these firms can hedge their exchange rate risks.
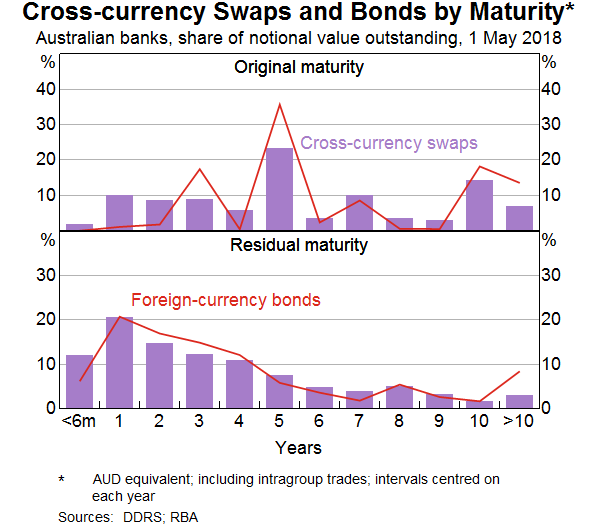
The most common original maturities for Australian banks' cross-currency swaps are five and ten years, consistent with the maturities of bonds they issue in offshore markets (Graph 11). The residual maturity of their outstanding cross-currency swaps are generally more evenly spread than the original maturity, consistent with many of these swaps having been initiated several years ago to hedge bonds issued at the time. The average maturity of the banks' outstanding cross-currency swaps has gradually increased since 2016, in line with trends in bond issuance.
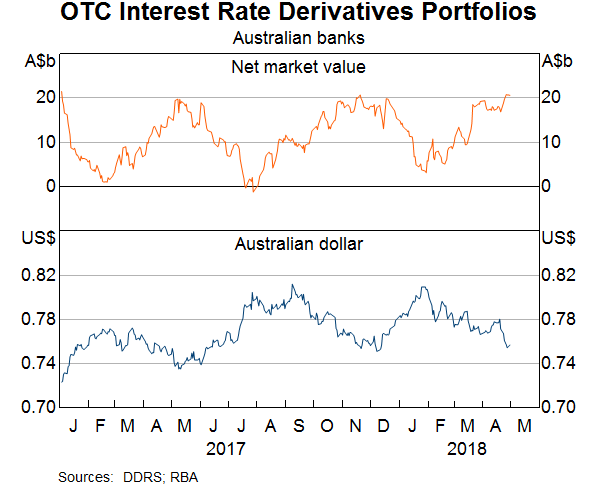
As cross-currency swaps account for a large portion of Australian banks' derivative risk exposures, exchange rates have been a key driver of recent movements in the net market value of their OTC interest rate derivatives portfolios (Graph 12). By contrast, interest rate movements have had a smaller impact on the value of Australian banks' portfolios, partly because a large share of Australian banks' single currency swap positions are offsetting. It is clear from the direction of movements in the net market value of Australian banks' derivatives that they maintain a net long foreign currency position in cross-currency swaps to hedge their foreign currency liabilities: when the Australian dollar appreciates, the value of their derivatives portfolios tends to decline. However, to the extent that the cross-currency swaps are hedging underlying foreign currency liabilities, changes in the net mark-to-market value on the swaps will be offset by changes in the value of their liabilities.
Conclusion
Mandatory trade reporting has greatly increased the information that regulators have about the Australian OTC derivatives market. The Australian financial regulators now receive each day trade-level data on open OTC derivatives in the Australian market from trade repositories. These data can give us deeper insights into key markets, the implications of the growing role of CCPs and how Australian banks' use of derivatives affect their exposure to interest rate and exchange rate risk. The Reserve Bank intends to use these data for further research into financial stability risks and financial conditions, and CCP supervision.
Footnotes
The authors are from Financial System Group, and thank Dilhan Perera for early analysis on these data. [*]
Foreign entities may also elect to report trades based on a sales or trading connection to Australia. [1]
Entities with small exposures (notional value outstanding less than $5 billion) do not have to report trades that are entered into with other reporting entities. [2]
Banks also use foreign exchange swaps to hedge their currency risks. In a foreign exchange swap, one counterparty simultaneously borrows in one currency from another counterparty and lends in another currency to that counterparty. These instruments are typically used to hedge the currency risk arising from liabilities or assets with short maturities. [3]
In particular, HKEX's OTC Clear service clears cross-currency swaps that reference the Hong Kong dollar and Chinese yuan, and Eurex is considering clearing EUR/USD and GBP/USD cross-currency swaps as well. [4]
References
Abad J, I Aldasor, C Aymanns, M D'Errico, LF Rousová, P Hoffmann, S Langfield, M Neychev and T Roukny (2016), ‘Shedding Light on Dark Markets: First Insights from the New EU-wide OTC Derivatives Dataset’, European Systemic Risk Board Occasional Paper Series 11.
Arsov I, G Moran, B Shanahan and K Stacey (2013), ‘OTC Derivatives Reforms and the Australian Cross-currency Swap Market’, RBA Bulletin, June, pp 55–64.
ASIC (Australian Securities and Investments Commission) (2013), ‘ASIC Derivative Transaction Rules (Reporting) 2013’. Available at <https://www.legislation.gov.au/Details/F2015C00262>.
ASIC (2015), ‘ASIC Derivatives Transaction Rules (Clearing) 2015’. Available at <https://www.legislation.gov.au/Details/F2015L01960>.
Berger-Thomson L and B Chapman (2017), ‘Foreign Currency Exposure and Hedging in Australia’, RBA Bulletin, December, pp 67–76.
Bergmann M and A Nitschke (2016), ‘The Kangaroo Bond Market’, RBA Bulletin, September, pp 47–52.
BIS (Bank of International Settlements) (2014), ‘Regulatory Reform of Over-the-counter Derivatives: an Assessment of Incentive to Clear Centrally’, October. Available at <https://www.bis.org/publ/othp21.pdf>.
CFR (Council of Financial Regulators) (2011), ‘Central Clearing of OTC Derivatives in Australia’, June. Available at <https://www.rba.gov.au/publications/consultations/201106-otc-derivatives/>.
CFR (2012), ‘OTC Derivatives Market Reform Considerations’, March. Available at <https://www.rba.gov.au/payments-and-infrastructure/financial-market-infrastructure/otc-deriviatives/reports/201203-otc-derivatives-market-reform-considerations/>.
Cielinksa O, A Joseph, U Shreyas, J Tanner and M Vasios (2017), ‘Gauging Market Dynamics Using Trade Repository Data: the Case of the Swiss Franc De-pegging’, Bank of England Financial Stability Paper 41.
Edey M (2015), ‘The Transition to Central Clearing of OTC Derivatives in Australia’, Speech at the International Swaps and Derivatives Association's (ISDA) 2015 Annual Australia Conference, Sydney, 22 October.
Finlay R and D Olivan (2012), ‘Extracting Information from Financial Market Instruments’, RBA Bulletin, March, pp 45–54.
FSB (Financial Stability Board) (2017), ‘Review of Incentives to Clear OTC Derivatives Centrally’, 18 August. Available at <http://www.fsb.org/wp-content/uploads/P180817-x.pdf>.
FSB, BCBS (Basel Committee on Banking Supervision), CPMI (Committee on Payments and Market Infrastructures), IOSCO (International Organization of Securities Commissions) (2015), ‘2015 CCP Workplan’, 15 April. Available at <http://www.fsb.org/wp-content/uploads/Joint-CCP-Workplan-for-2015-For-Publication.pdf>.
Garner M, A Nitschke and D Xu (2016), ‘Developments in Foreign Exchange and OTC Derivatives Markets’, RBA Bulletin, December, pp 63–74.
RBA (Reserve Bank of Australia) (2016), ‘Box D: Trade Compression’, Financial Stability Review, April, pp 49–50.
RBA (2018), ‘Box C: Interest Rate Risk in the Australian Financial System’, Financial Stability Review, April, pp 45–48.
Watson B (2017), ‘Covered Bonds in Australia’, RBA Bulletin, September, pp 53–62.