Bulletin – June 2018 Global Economy Indicators of Labour Market Conditions in Advanced Economies
- Download 847KB

Abstract
While the unemployment rate is the most widely used indicator of labour market slack, there are many other measures. This article reports on what a broad range of indicators say about conditions in the labour markets of advanced economies. We summarise the various indicators using a standard statistical technique. The summary measures show labour markets in most advanced economies are tight, although in some cases not as tight as implied by the unemployment rate. The Australian labour market has spare capacity remaining, consistent with readings from the unemployment rate. The summary measures provide additional information about wage developments for most advanced economies, above and beyond the unemployment rate, but do not fully account for the weak wages growth of recent years.
Introduction
Labour market conditions are very important for understanding economic developments. The unemployment rate is the most commonly used metric of labour market slack. It is a useful gauge of how much spare capacity remains in the labour market, together with estimates of the unemployment rate consistent with stable inflation (also known as ‘full employment’, the non-accelerating inflation rate of unemployment or NAIRU). When the unemployment rate is close to estimates of the NAIRU, fewer appropriately skilled workers are available to fill vacant positions, so employers must offer higher wages to attract them, such that wage and inflation pressures build. When there are many unemployed people seeking work, there is more spare capacity in the labour market.
The unemployment rate increased sharply across advanced economies during the global financial crisis. As these economies have recovered, employment has grown strongly and the unemployment rates have declined (Graph 1). In many advanced economies the unemployment rate is now below conventional estimates of full employment, suggesting that there is little to no spare capacity left in the labour market. In contrast, Australia still has spare capacity remaining in the labour market based on the unemployment rate and the NAIRU estimate (Cusbert 2017).
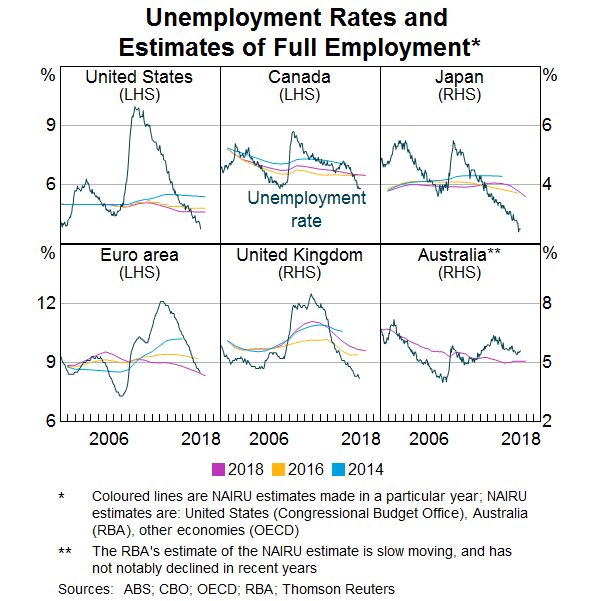
While the unemployment rate is the key indicator of spare capacity and broader conditions in the labour market, there is a wide range of other labour market measures that can assist in assessing labour market conditions. This is especially relevant now because estimates of full employment have been revised down repeatedly in recent years as unemployment rates have continued to decline but wages growth has remained low. One explanation for the lack of a significant pick-up in wages growth could be that the labour markets are not as tight as unemployment rates imply. For example, the International Monetary Fund (IMF 2017) finds an important role for underemployment in explaining wages growth (in some economies) but previous Bank work found that underemployment has not been a significant determinant of wages growth in Australia or other advanced economies.[1] Rather than focus on any additional single metric, such as the underemployment rate, we examine a broad range of labour market variables and use statistical techniques to summarise their information to assess what they imply about labour market conditions in advanced economies. We also examine if the broader labour market indicators are useful for understanding wage developments.
Other Measures of Labour Market Conditions
A broad range of variables point to strengthening labour market conditions across a range of advanced economies, though some of the variables are influenced by structural forces as well as cyclical conditions.
For Japan, Canada, the United States and the United Kingdom, most indicators suggest labour market conditions are at least as strong as they were before the crisis. Nonetheless, some indicators still point to conditions not being as strong as the unemployment rate implies. The underemployment and long-term unemployment rates generally point to more spare capacity than the unemployment rate. For the euro area, where the recovery started later, the indicators are more mixed. Australian variables largely indicate weaker labour market conditions than before the crisis.
Underemployment
The unemployment rate measures the share of the labour force that is not employed but is actively seeking employment. The underemployment rate takes a broader view of underutilisation. In Australia, it measures the share of the labour force that is employed, but is not fully utilised. This usually refers to those working part time involuntarily because they could not find full-time work, or those who would like to work more hours.[2] Here, we broaden the definition to also include marginally attached workers, for those economies where the data are available.[3] There are two types of marginally attached workers: discouraged workers (those who are available to work but are no longer seeking work) and those people who are seeking work but are not available at that time. Together, the unemployed and underemployed rates add up to the labour underutilisation rate.
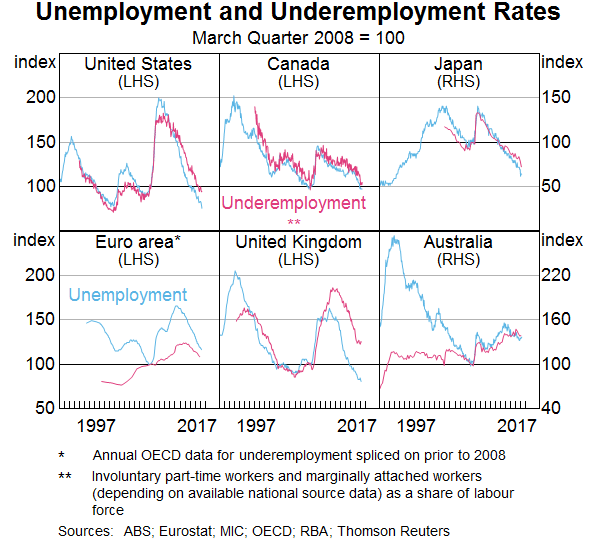
Unemployment and underemployment generally move closely together. Both increased during the global financial crisis in most advanced economies and have declined significantly in recent years (Graph 2). However, there appear to be higher rates of underemployment for a given unemployment rate across a range of advanced economies in the post-crisis period. This points to more spare capacity than the unemployment rates imply. In Japan, both the underemployment and unemployment rates are below pre-crisis rates, but the unemployment rate has declined more sharply. The share of part-time workers who would prefer full-time work is around its pre-crisis level. In the United States and Canada, the underemployment rate is back at its pre-crisis rate. This is consistent with the unemployment rate for Canada, while in the United States the unemployment rate has fallen even further. The divergence is quite stark in the United Kingdom, where the underemployment rate remains elevated while the unemployment rate has declined to be well below its pre-crisis rate. In the euro area and Australia, both the underemployment and unemployment rates are above pre-crisis rates. In the euro area, underemployment increased across the region following the financial crisis, but is most elevated in the member countries that were most affected by the euro area's sovereign debt crisis. With the exception of Germany, the underemployment rate has not significantly declined since the crisis in euro area economies.
Long-term unemployment
Periods of high unemployment are associated with increases in the long-term unemployment rate; conversely, a tighter labour market enables the long-term unemployed to be re-employed.[4] However, due to the skill erosion that occurs, and potentially the stigma attached to being unemployed for an extended period, the long-term unemployment rate generally declines more slowly than the unemployment rate; the long-term unemployed are often only recruited when the labour market has become quite tight (OECD 2016).
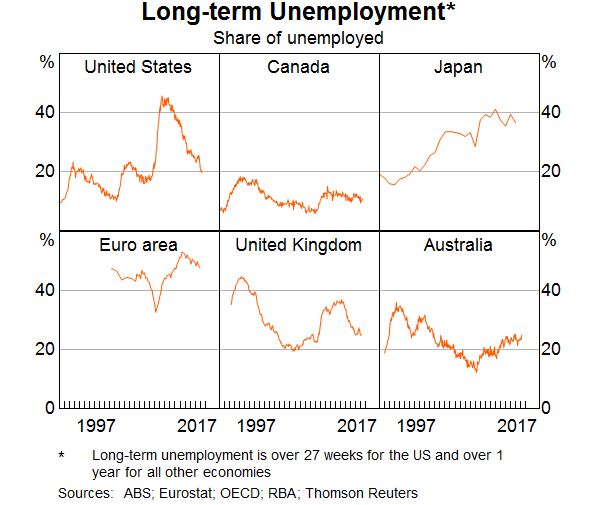
In the United States, the long-term unemployment rate spiked sharply during the financial crisis, and more than 40 per cent of the unemployed were classified as long term from 2010 to 2012 (Graph 3). The United Kingdom and Canada also saw significant increases at around the same time. In the euro area, the long-term unemployment rate peaked after the sovereign debt crisis, at which point over half of the unemployed were long-term unemployed.
Across most economies, the long-term unemployment rate has not declined as sharply as the unemployment rate. The long-term unemployment rate has declined in the United States and the United Kingdom to approximately pre-crisis levels as the labour markets improved; but the unemployment rate has fallen further. Canada, the euro area and Australia have seen only modest improvement, and the shares of long-term unemployed remain above pre-crisis levels. Although some euro area countries, such as Germany, have lower rates of long-term unemployment, Greece and Italy are experiencing very high rates. Japan has followed a different trajectory to the other advanced economies. The long-term unemployment share has increased steadily since the mid 1990s and is above pre-crisis levels, which is at odds with the strengthening labour market implied by other indicators. This is likely to reflect the dominance of structural factors such as skill mismatches due to changes in industry composition. Naganuma and Uno (2016) find much of the increase in the long-term unemployment rate is due to males aged 25 to 44; they point to the shift away from manufacturing as well as a persistent cohort effect for those who graduated in the 1990s, a time of significant labour market slack.
Youth unemployment
Youth unemployment is particularly cyclical, because younger people's lower experience and skill levels make them especially sensitive to changes in demand for labour. It may therefore be a useful metric for spare labour market capacity. Youth unemployment rates increased sharply in advanced economies following the financial crisis. More recently, youth unemployment rates have declined in Japan, the United States, the United Kingdom and Canada, where they are now below their pre-crisis levels.
In the euro area, however, youth unemployment remains elevated relative to its pre-crisis level despite the significant fall in aggregate unemployment in the region since 2013. This suggests ongoing spare capacity. But, as is often the case, the aggregate rate for the euro area masks wide divergences in the member economies. In Germany, youth unemployment has declined to be well below its pre-crisis rate; the Netherlands has also returned to around pre-crisis rates of youth unemployment. However, in the majority of euro area economies, youth unemployment remains well above pre-crisis rates, particularly in Italy, Spain and Greece. The elevated youth unemployment rates in these countries are closely mirroring their still high unemployment rates.
Youth unemployment in Australia has remained higher than before the financial crisis; for a detailed discussion of the Australian youth labour market see Dhillon and Cassidy (2018), in this Bulletin.
Participation rates
Participation rates can also provide information about the cyclical conditions in the labour market. Typically, stronger employment growth encourages growth in the labour force as well, with jobs filled not only by the unemployed, but also by those previously outside the labour force. In tight labour markets, employers might need to offer more favourable conditions to attract workers and this can encourage participation. Discouraged workers may find jobs or resume job searching, and higher wages and more flexible conditions might attract non-participants and encourage older workers to remain in employment for longer.
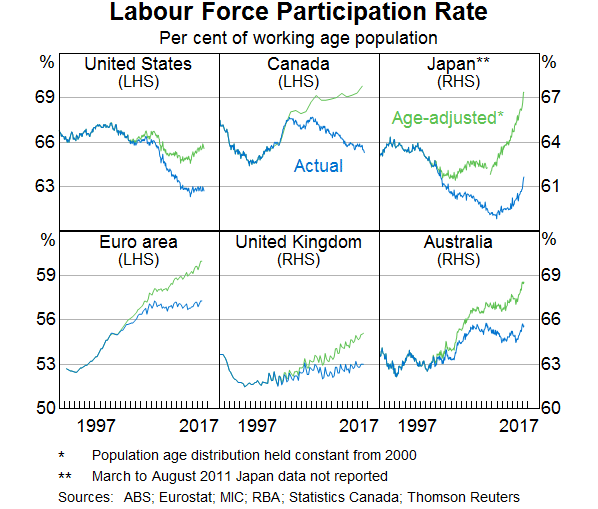
While the participation rate is affected by cyclical developments, it is also affected by structural drivers. One of these is population ageing, which weighs on the aggregate participation rate because older people have lower participation rates. We follow Brown and Guttmann (2017) to adjust the participation rate for the ageing of the population by assuming the population shares in each age cohort are unchanged from 2000. This shows that labour force participation rates within age cohorts have been increasing across most advanced economies (Graph 4). Disentangling structural factors other than age composition, such as improved health outcomes (RBA 2018), from the cyclical effect remains difficult. The longer-run upward trend in the age-adjusted participation rates in a number of economies points to a role for structural forces, but the sharp pick-up in age-adjusted participation rates in some economies in recent years suggests cyclical factors are also at work, consistent with the tighter labour markets. The United States is a notable exception; even adjusted for ageing, the participation rate has declined because some younger groups (particularly males aged 25 to 54) have reduced their participation rates; this is likely to be a discouraged worker effect of the high unemployment following the global financial crisis. More recently, the United States participation rate has stabilised and the age-adjusted rate has largely recovered from its fall during the crisis.
Average hours worked
The average number of hours worked can also be expected to move with labour market conditions: in tight labour markets, employers may increase hours for those staff seeking additional work before hiring new employees. This can be achieved, for example, by offering full-time jobs to part-time workers, more (part-time) hours for part-time workers or more overtime. When there is more spare labour market capacity, workers may not be able to gain as many hours of work as they would like and may accept part-time work if they cannot find full-time work; businesses may require less overtime, and may reduce hours for existing staff rather than lowering employee numbers (Bishop, Gustafsson and Plumb 2016). Average hours worked is a useful additional metric as changes in hours in response to labour market conditions are not captured by employment growth and the unemployment rate; for example, employment growth does not increase if a part-time job is replaced with a full-time job, and unemployment does not increase if a worker's hours are reduced.
However, structural forces also affect the average number of hours worked: a longer-term downward trend in average hours can be observed for all economies (Graph 5). In many advanced economies, the share of workers preferring to work part time has increased; this may partly be because technological change, changes to the nature of work, and childcare and retirement policies have allowed women and older workers to increase their participation in ways that were not previously possible.
A cyclical effect can also be observed in the sharp decline in hours worked across advanced economies consistent with the deterioration in labour market conditions following the global financial crisis. In the United States and the United Kingdom, hours rebounded promptly to around pre-crisis levels, and have since been quite steady. In Canada and the euro area, hours have been broadly flat since declines seen during the crisis. In Japan and Australia, hours worked have continued to decline and are well below pre-crisis levels. In the euro area and Australia this could be, in part, because the underemployment rates are still elevated, though it may also reflect the structural forces behind the trend decline.
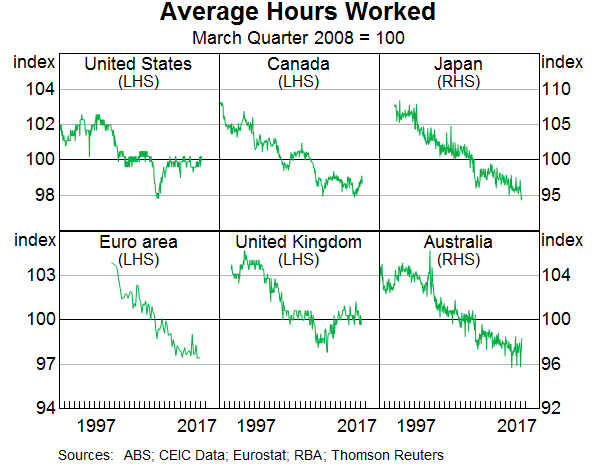
The balance between cyclical and structural factors likely differs by economy. Brouillette et al (2017) find that the decline in Canadian hours is broadly based across sector, region, sex, age groups and across full- and part-time work. Similarly, Bishop et al (2016) conclude the composition of employment has not been the main driver of the decline in average hours during downturns and recessions in Australia. On the other hand, in Japan there has been an increased policy focus on reducing excessive overtime hours worked and a significant increase in part-time work. More generally, employers are also using more attractive work practices (including flexible work) to compete in the increasingly tight labour market (Harding 2017). While there may be little underemployment associated with voluntary part-time work, these workers may still represent additional capacity if they would increase their hours for higher wages.
Job vacancies
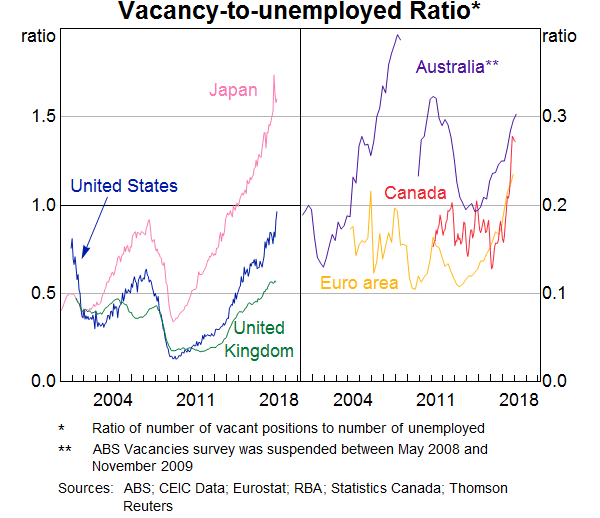
Job vacancies can convey information about employment prospects, and thus contribute to an assessment of labour market conditions. The ratio of job vacancies to unemployed people tends to increase when labour markets are tight; a higher ratio means that there are more jobs available and fewer job seekers. The vacancy ratio declined sharply in the United States and Japan as the unemployment rate increased; declines in the euro area were more modest (Graph 6). The vacancy ratios have increased across the board as labour markets have strengthened. Indeed, based on the vacancy ratio, the labour market is exceptionally tight in Japan: the vacancy ratio is the highest since 1974, and there are around 60 per cent more vacancies than there are unemployed people. In the United States, Canada and the United Kingdom, the vacancy ratios are well above their pre-crisis levels, with an especially sharp increase in recent months in Canada. In the euro area, it is slightly above its pre-crisis level. However, the euro area vacancy ratio also masks significant regional variation: at one extreme, Germany's vacancy ratio is at a series high, and on the other, Spain's indicates a much larger degree of slack remaining in the labour market. In Australia, the vacancy ratio is high, but below its pre-crisis level, consistent with the spare capacity indicated by the unemployment rate.
While the increases in the vacancy ratios are consistent with the tightening labour markets over recent years, the elevated vacancy ratios could also point to greater skills mismatches or frictions. Skills mismatches increase the vacancy-to-unemployed ratios because of a lack of suitably skilled labour; this can occur due to changes in the composition of the economy (for example, jobs shifting from one industry to another) or from skills erosion due to long-term unemployment. Frictions can also increase if the incentives or structures that encourage efficient job matching decline; for example, higher unemployment benefits reduce the urgency of finding new work and thus increase frictions, while programs which help match available jobs and job seekers reduce frictions.[5]
Turnover
Turnover measures the rate at which people change or leave jobs; it can provide an indication of workers' confidence in their ability to find employment. When jobs are scarce, employees are unlikely to quit and try to find another job; when jobs are plentiful, people become more willing to change jobs as employment prospects improve. Data on turnover rates are rather limited. The quits rate, which measures the share of workers who voluntarily quit their job, fell sharply in the United States as labour market conditions deteriorated, and has increased to its pre-crisis rate as the labour market has recovered. In Australia, the quits rate has picked up very slightly since the crisis, although it has remained broadly flat over recent decades. In Japan, the quits rate has shown a long-run trend decline; the Japanese quits rate has historically been relatively low reflecting the prevalent ‘employment for life’ model. Given the improving labour market, the declining quits rate is likely to reflect structural changes in Japan.
Surveys
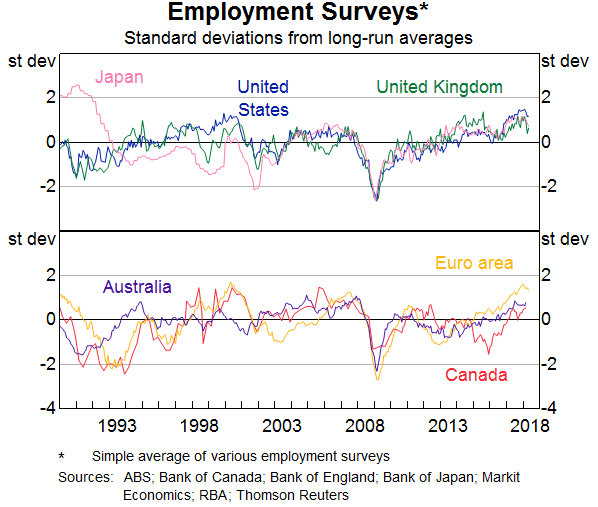
Another indicator of labour market conditions is the information provided in consumer and business surveys. Consumers are surveyed about their perceptions of job availability. Businesses are asked about availability of suitable labour or their plans to hire additional staff; and purchasing managers report on changes in employment levels. Across countries, and across the range of surveys, responses are consistent with strong labour markets (Graph 7). Survey indicators declined sharply during the global financial crisis (and in the euro area, declined again during the sovereign debt crisis). In recent years, surveyed labour market conditions have improved and are above average in advanced economies. Survey measures became especially strong in the euro area over 2017. The United States and Canada also saw a strong pick-up over this time.
Summary Measures of Labour Market Conditions
There is a very broad range of labour market measures and assessing this information in its totality is challenging. To help with this, we can summarise the information in labour market indices (LMIs), one for each advanced economy, using standard statistical techniques. There are a number of such techniques, but we follow Hakkio and Willis (2014b), and use principal components analysis.[6] We can observe how the summary measures that we construct have evolved compared to the unemployment rates and what they imply about labour market conditions. We can also assess whether they help explain the sluggish wages growth at a time of low unemployment (details on the variables included in the indices can be found in Appendix A).
In order to interpret the LMI in a meaningful way, we scale the series to the unemployment rate using the estimated relationship between each country's unemployment rate and LMI (from the start of the LMI series to 2008). We can then see how the LMI has evolved relative to the unemployment rate since the global financial crisis.
In most economies, the LMIs broadly track the unemployment rate: the LMIs increased alongside the unemployment rate post crisis, and have declined as the unemployment rate has fallen (Graph 8).
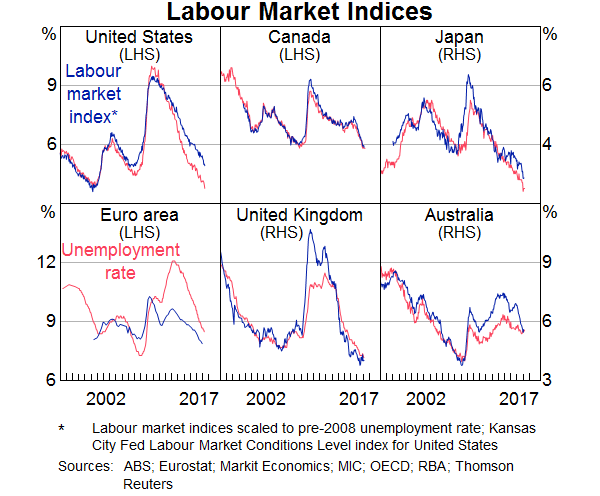
For Japan and the United States, the LMIs indicate that the labour markets are at least as tight as before the crisis, but are not as tight as the unemployment rate implies. For the United Kingdom, Canada and Australia, the LMIs showed a sharper deterioration in labour market conditions than the unemployment rate following the global financial crisis; though conditions are now similar to what the unemployment rate shows.[7] In the euro area, the LMI is back around its pre-crisis level, while the unemployment rate is still above its pre-crisis rate (though at the NAIRU). Given the mixed conditions in the euro area indicated by the different labour market variables, this result is somewhat unexpected. For the euro area, the methodology gives significant weight to the surveys and employment growth. As these variables suggest strong labour market conditions, the LMI points to greater labour market tightness than the unemployment rate. Australia is the only economy in the sample where the LMI points to a labour market with more slack relative to pre-crisis, consistent with the slack indicated by the unemployment rate.
We also found statistical evidence that the inclusion of the LMIs helps to explain wages growth beyond what the unemployment rate alone can explain in most of the advanced economies we consider (except the euro area and Canada). We ran a series of simple regressions looking at the relationship between each economy's wages growth rate with the unemployment rate and the LMI (using residuals from regressing the LMI on the unemployment rate to abstract from information already contained in the unemployment rate series). The LMI variable is generally statistically significant and improves the model fit, indicating that the LMIs contain information beyond the unemployment rate that is useful for understanding wage dynamics over the sample period (see Appendix B for details). However, the LMIs do not help resolve the question of why wages growth has remained sluggish in recent years. While incorporating the LMIs into simple wage regressions does improve model fit, residuals are still negative in recent years for most economies. This is consistent with the observation that recent wages growth is low relative to periods of similar LMI readings in the past. This suggests other factors remain relevant, such as those outlined in previous Bank work (including lower bargaining power of labour, low productivity growth, and inflation expectations).
Conclusion
Although the unemployment rate is a useful indicator of labour market tightness, it is only one of a number of labour market indicators. We look at a wide range of alternative labour market variables, and most show that labour markets have progressively strengthened across advanced economies in the post-crisis period. We summarise this broader set of labour market variables into an index for each economy. In general, the LMIs point to significant improvement in the labour markets in advanced economies over recent years. These summary measures show labour markets are tighter than signalled by the unemployment rate in the euro area, but not as tight as the unemployment rate suggests in the United States and Japan. In the United Kingdom, Canada and Australia, the LMIs showed greater deterioration in labour markets during the post-crisis period, but now point to similar labour market conditions as the unemployment rate. The LMIs also provide additional information about wage developments for most advanced economies, above and beyond the unemployment rate, but do not fully account for the weak wages growth of recent years.
Appendix A: Principal Component Analysis
We use principal component analysis (a dimensionality reduction technique) to summarise the range of labour market variables into one index for each advanced economy in our sample. The index is a linear combination of the labour market variables called a principal component. We use the first principal component, which explains as much variation in the data as possible. This follows similar work done by other central banks.[8] The results are relatively robust to variable choice, and multiple subsets of the data were tested. For interpretability purposes a varimax rotation (as in Hakkio and Willis 2014a) and least absolute shrinkage and selection operator regression (as in Tibshirani 1996) were also tested; these had broadly similar results to what is presented in the text. A key question in the principal component analysis application here is how to treat non-stationary variables. Differencing such variables eliminates statistical issues but reduces the interpretability of the results and employs less informative indicators (e.g. change in the unemployment rate rather than the unemployment rate itself). We take an approach that uses the variables in levels, motivated by the observation that in most instances a non-stationary variable is an artefact of the observed data, and detrend the variables where a trend clearly exists (and is expected) and a deviation from that trend is more meaningful for assessing cyclical conditions; in this respect our approach is similar to Zmitrowicz and Khan (2014). All variables are standardised (with a mean of zero and a standard deviation of one).
| Japan | Euro area | United Kingdom | Canada | Australia | |
|---|---|---|---|---|---|
| Unemployment rate | ✓ | ✓ | ✓ | ✓ | ✓ |
| Youth unemployment rate | ✓ | ✓ | ✓ | ✓ | |
| Hours worked | ✓* | ✓* | ✓* | ✓* | ✓* |
| Participation rate | ✓* | ✓* | ✓* | ✓* | ✓* |
| Employment | ✓** | ✓** | ✓** | ✓** | ✓** |
| Vacancy rate | ✓* | ✓ | |||
| Vacancy-to-unemployed ratio | ✓* | ✓ | ✓ | ✓ | |
| Long-term unemployment rate | ✓* | ✓ | ✓ | ✓ | ✓ |
| Quits rate | ✓* | ||||
| Persons with a second job | ✓* | ✓* | |||
| Underutilisation | ✓ | ✓ | ✓ | ||
| Unemployment beneficiaries | ✓* Claimant count rate |
✓ Regular employment insurance beneficiaries |
|||
| Survey measures (Employment sub-indices of listed surveys) |
✓ Economy Watchers: Current and Future Employment Conditions Manufacturing PMI |
✓ Consumer survey Industry survey Manufacturing PMI |
✓ Manufacturing PMI Services PMI |
✓ Bank of Canada Business Outlook Survey |
✓ NAB Business Survey |
|
(a) ✓ included in the LMI; * detrended by taking the deviation from a moving average; ** year-ended growth rate Sources: ABS; CEIC Data; Eurostat; Markit Economics; MIC; OECD; RBA; Thomson Reuters |
|||||
Appendix B: Regression Results
| Constant | Unemployment rate | Labour Market Indicator(b) | Adjusted R2 | |
|---|---|---|---|---|
| United States | 3.97*** | −0.22*** | 0.38 | |
| 3.97*** | −0.22*** | 0.74*** | 0.55 | |
| Canada | 6.13*** | −0.49*** | 0.15 | |
| 9.29** | −0.93 | −0.17 | 0.11 | |
| Japan | 3.98*** | −1.06*** | 0.41 | |
| 4.13*** | −1.06*** | 0.25*** | 0.47 | |
| Euro area | 5.43*** | −0.35*** | 0.60 | |
| 5.43*** | −0.35*** | 0.05 | 0.62 | |
| United Kingdom | 6.59*** | −0.64*** | 0.44 | |
| 11.32*** | −1.40*** | −0.52*** | 0.54 | |
| Australia | 5.63*** | −0.42*** | 0.20 | |
| −0.38 | 0.49** | 0.52*** | 0.42 | |
|
(a) ***, **, * indicate significance at the 1, 5, and 10 per cent level,
respectively. Robust standard errors used. We use: average hourly earnings
for the United States and Canada; average monthly cash earnings for
Japan; compensation of employees for the euro area; average weekly
earnings for the United Kingdom; and the wage price index for Australia.
The sample period varies by economy based on data availability: 1992–2018
(United States), 1998–2018 (Canada), 1997–2018 (Japan),
2001–17 (euro area), 2001–18 (United Kingdom) and 1998–2018
(Australia). Sources: Authors' calculations |
||||
Footnotes
Alexandra Baker is from Economic Analysis Department and Meika Ball completed this work in Economic Analysis Department. [*]
For further details, see Arsov and Evans (2018) and Bishop and Cassidy (2017). [1]
Underutilisation also occurs when workers are employed in roles below their skill level due to shortages of suitable employment, though this is not captured by our measure of underemployment. We use a heads-based measure of underemployment for Australia for comparability with other economies. The hours-based measure, which includes part-time workers who would like to work more hours while remaining part time, also remains elevated (see RBA (2017) for details). [2]
Data on marginally attached workers are available for the euro area, United States and Canada. For Japan and the United Kingdom only partial data on marginally attached workers are used. As the data for Australia are only available annually, we exclude it. In saying that, the relative movement of these series is only minimally affected by the inclusion of the marginally attached. [3]
The long-term unemployment rates are not comparable across economies, as the definition of ‘long term’ varies: it is 27 weeks in the United States and one year in the euro area, Japan, Canada, the United Kingdom and Australia. [4]
Bova, Jalles and Kolerus (2016) find deteriorations in labour market matching (outward shifts in the Beveridge curves) for the United States, United Kingdom and Australia; but more mixed developments for a sample of euro area economies (including an inward Beveridge curve shift for Germany and an outward shift in Portugal). [5]
The labour market variables included for each economy vary with data availability (see Appendix A for details). The indices are therefore more appropriately compared with their own histories rather than across countries. The results seem relatively robust to methodology and variable choice, including constructing the indices without the inclusion of the unemployment rate variable. We acknowledge that there is some judgement involved in constructing such indices. [6]
Although the Bank of Canada produces its own Labour Market Indicator using a similar technique, we construct our own to allow for a longer history, monthly data, and to exclude wages growth as a variable (Zmitrowicz and Khan 2014). The Bank of Canada's Labour Market Indicator moves broadly in line with the unemployment rate and our LMI. [7]
Details on the United States index developed by the Kansas City Fed are at Hakkio and Willis (2014b), the Bank of Canada's Canadian Labour Market Indicator was developed in Zmitrowicz and Khan (2014), and the Reserve Bank of New Zealand constructed a similar series for New Zealand (Armstrong, Kamber and Karagedikli 2016). The Australian Treasury also previously developed an Australian index (Grant et al 2016). [8]
Variables used in the United States Labor Market Conditions Index can be found at Hakkio and Willis (2014a). [9]
References
Armstrong J, G Kamber and Ö Karagedikli (2016), ‘Developing a labour utilisation composite index for New Zealand’, Reserve Bank of New Zealand Analytical Notes 2016/04, April.
Arsov I and R Evans (2018), ‘Wage Growth in Advanced Economies’, RBA Bulletin, March.
Bishop J and N Cassidy (2017), ‘Insights into Low Wage Growth in Australia’, RBA Bulletin, March, pp 13–20.
Bishop J, L Gustafsson and M Plumb (2016), ‘Jobs or Hours? Cyclical Labour Market Adjustment in Australia’, RBA Research Discussion Paper 2016–06, September.
Bova E, J Jalles and C Kolerus (2016), ‘Shifting the Beveridge Curve: What Affects Labor Market Matching?’, IMF Working Paper No WP/16/93.
Brouillette D, K Gribbin, J Guénette, J Ketcheson, O Kostyshyna, J Lachaine and C Scarffe (2017), ‘A Canada-US Comparison of Labour Market Conditions’, Bank of Canada Staff Analytical Note 2017-4.
Brown A and R Guttmann (2017), ‘Ageing and Labour Supply in Advanced Economies’, RBA Bulletin, December, pp 37–46.
Cusbert T (2017), ‘Estimating the NAIRU and the Unemployment Gap’, RBA Bulletin, June, pp 13–22.
Dhillon Z and N Cassidy (2018), ‘Labour Market Outcomes for Younger People’, RBA Bulletin, June.
Grant A, W Gillies, R Harris and M Ljubic (2016), ‘An Australian Labour Market Conditions Index’, Treasury Working Paper No 2016–04.
Hakkio C and J Willis (2014a), ‘Background Information for the KC Fed's Labor Market Conditions Indicators’, Federal Reserve Bank of Kansas City, August.
Hakkio C and J Willis (2014b), ‘Kansas City Fed's Labor Market Conditions Indicators (LMCI)’, The Macro Bulletin, August.
Harding R (2017), ‘Corporate Japan hit by severe labour shortages’, FT.com site, 26 November. Available at <https://www.ft.com/content/b3c9a338-d27c-11e7-8c9a-d9c0a5c8d5c9>.
IMF (International Monetary Fund) (2017), ‘Recent Wage Dynamics in Advanced Economies: Drivers and Implications’, World Economic Outlook, October, pp 73–116.
Naganuma S and Y Uno (2016), ‘Long-Term Unemployment in Japan’, Bank of Japan Research LAB No. 16-E-1, April.
OECD (2016), ‘Recent labour market developments and the short-term outlook’, OECD Economic Outlook, 2016, pp 19–60.
RBA (Reserve Bank of Australia) (2017), ‘Box B: Underemployment and Labour Market Spare Capacity’, Statement on Monetary Policy, February, pp 38–40.
RBA (2018), ‘Box B: The Recent Increase in Labour Force Participation’, Statement on Monetary Policy, May, pp 33–34.
Tibshirani R (1996), ‘Regression Shrinkage and Selection via the Lasso’, Journal of the Royal Statistical Society, 58(1), pp 267–288.
Zmitrowicz K and M Khan (2014), ‘Beyond the Unemployment Rate: Assessing Canadian and U.S. Labour Markets Since the Great Recession’, Bank of Canada Review, May, pp 42–53.