Bulletin – June 2017 Global Economy Conditions in China's Listed Corporate Sector
- Download 632KB
Abstract
The financial statements of listed companies provide a detailed insight into the broader conditions faced by businesses in China. Listed firms have deleveraged over the past few years, although declining profitability has reduced their capacity to cover interest payments, especially for state-controlled firms. High leverage and declining profitability in the real estate and construction sectors remain a concern, especially given these sectors have been a key driver of economic growth in recent years.
Background
The financial health of China's companies has important implications for economic growth and financial stability in China. In particular, high and rising debt, combined with slower economic growth, has sparked concerns about economic and financial risks and spillovers to China's trading partners, including Australia (RBA 2016, p 4). As such, accurately assessing conditions in the corporate sector is very important.
While some official data on corporate financial positions are published, they cover only a limited number of sectors, and are based on surveys of firms above a certain size.[1] Additionally, the aggregate nature of these data precludes firm-level distributional analysis. The detailed quarterly financial statements of listed companies are a useful alternative data source for analysing conditions faced by China's corporate sector and its financial health.
China has two mainland stock exchanges, in Shanghai and Shenzhen. By the end of 2016, around 3,000 non-financial companies were listed on these exchanges, with a combined book value of almost CNY50 trillion in assets.[2] This represents a small, but growing, share of China's broader corporate sector. Listed companies are estimated to have made up just over 5 per cent of non-financial enterprise assets in 2014, while listed company debt was around 10 per cent of the official measure of China's non-financial corporate debt in 2016.[3]
Manufacturing companies are the most common type of listed company, and account for around 40 per cent of total listed company assets (Table 1). Mining companies' share of total listed company assets has declined over the past few years, while construction and real estate companies' shares have grown strongly. Relative to the broader corporate sector, manufacturing, mining and construction firms appear to be somewhat over-represented in the listed company sample, while real estate firms are under-represented.[4]
| 2006 | 2016 | |||||
|---|---|---|---|---|---|---|
| Industry | Number | Total Assets | Number | Total Assets | ||
| CNY trillion | Share state controlled | CNY trillion | Share state controlled | |||
| Manufacturing | 767 | 2.6 | 79 | 1,944 | 18.0 | 63 |
| Mining | 49 | 0.8 | 97 | 75 | 6.3 | 96 |
| Services | 299 | 1.2 | 87 | 605 | 7.3 | 69 |
| Construction | 37 | 0.1 | 76 | 90 | 6.0 | 92 |
| Real estate | 121 | 0.4 | 72 | 129 | 6.1 | 67 |
| Other(a) | 130 | 0.9 | 95 | 142 | 3.5 | 92 |
| Total | 1,403 | 6.1 | 85 | 2,985 | 47.3 | 75 |
|
(a) Includes utilities, agriculture and other sectors Sources: RBA; WIND Information |
||||||
Services firms are also probably under-represented, given that many services firms are smaller and so are less likely to be listed.
As at the end of 2016, the majority of listed companies were classified as privately owned or controlled firms (‘private firms’), and their share had increased over the past several years.[5] Private firms have also increased their share of the total assets of listed companies, but the bulk of listed company assets remain state owned or state controlled (‘state firms’), because these firms are larger on average. Listed private firms are most prevalent in the real estate and manufacturing industries, but are relatively uncommon in the mining, construction and utilities industries.
Because the industry and ownership composition of the listed sector differs from that of the wider corporate sector, aggregate data for the listed sector might not be representative of broader trends in the economy. Listed companies are also likely to be much larger than the average firm, and benefit from greater access to debt and equity financing. Nonetheless, the financial statements provided by listed companies offer an unusually detailed insight into the conditions and risks facing Chinese firms.
Leverage
A commonly cited concern for China has been the extent to which its economic growth has relied on rapid growth of credit, especially in the corporate sector (IMF 2016). Non-financial corporate debt has increased as a share of GDP from 110 per cent in 2008 to 210 per cent in 2016 (BIS 2017 p 253), increasing the vulnerability of the sector to a negative financial or economic shock. The Chinese authorities have highlighted corporate deleveraging as an important part of the economy's structural reforms (NDRC 2017).
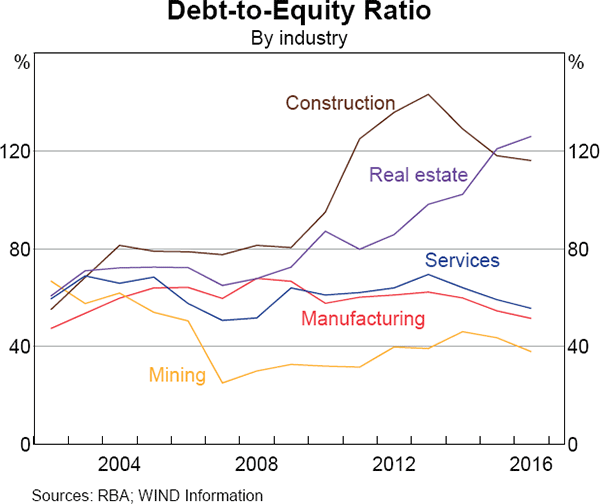
The rise in corporate sector leverage in the aftermath of the 2008–09 stimulus is evident in a range of metrics for listed companies (Graph 1).[6],[7] Most of the run-up in leverage occurred among state firms, which have remained more highly leveraged, on average, than private firms. By industry, the increase in leverage was most noticeable in the construction and real estate sectors (Graph 2). The high leverage of firms in these sectors increases the risk of financial distress should conditions in the property market deteriorate.
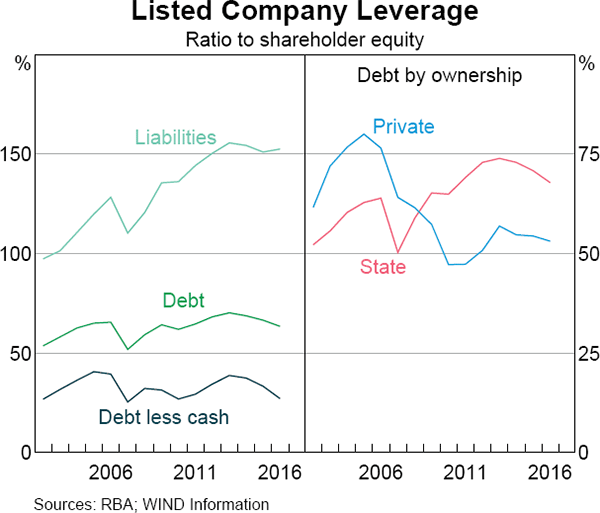
A number of factors may mitigate the risks posed by this general run-up in leverage. First, the increase in interest-bearing debt has been less than the increase in total liabilities, which reduces the direct interest costs faced by firms.[8] Second, the increase in debt has been partially offset by an increase in holdings of cash and cash equivalents (see ‘Liquidity and Payments’ below). Finally, over the past few years, listed firms have, on average, begun to deleverage. This has occurred across both state and private firms, and most industries.[9]
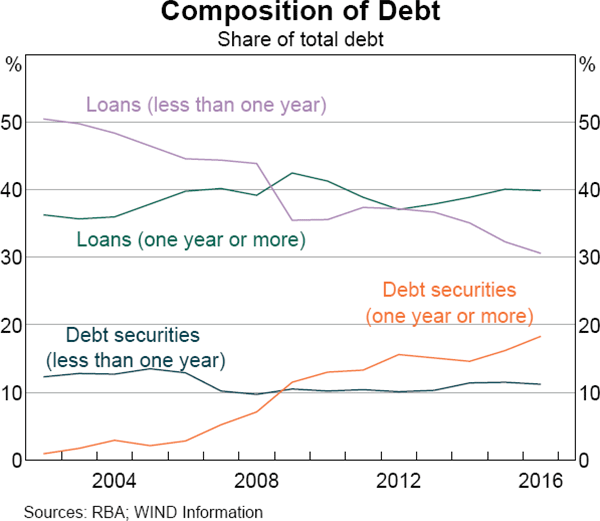
The composition of debt held by firms has changed substantially over time, as China's financial system has developed (Graph 3). A much greater share of debt is now held in the form of debt securities (notes and bonds) with a term of more than one year, providing firms with more stable funding, although some may find it more difficult to roll over debt securities than short-term loans.
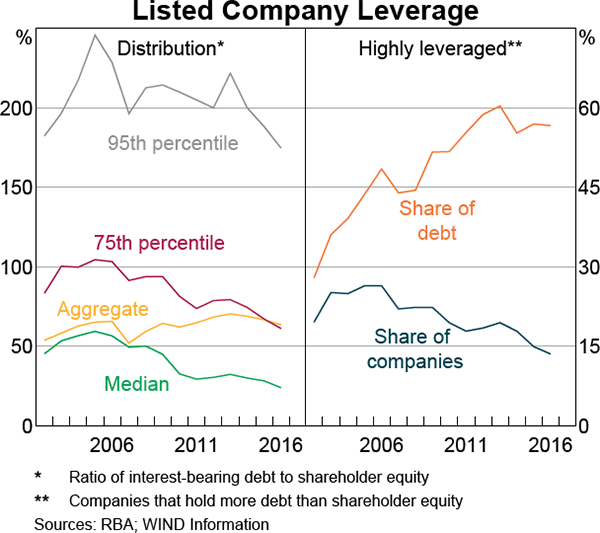
While this aggregate assessment of listed corporate leverage suggests some reduced risk in recent years, the distribution of leverage is a cause for concern. The share of companies that are ‘highly leveraged’ (i.e. hold more interest-bearing debt than equity) has declined over the past decade, but the share of debt held by these highly leveraged firms has increased; these companies now hold half of all listed company debt (Graph 4). The higher concentration of debt among the most leveraged firms suggests that the vulnerability of firms most exposed to a negative shock to their revenue or profits has increased.
Profitability
Profitability of listed companies has been declining since the 2008–09 stimulus, especially for state-controlled firms and firms in the mining, manufacturing and services sectors (Graph 5).[10]
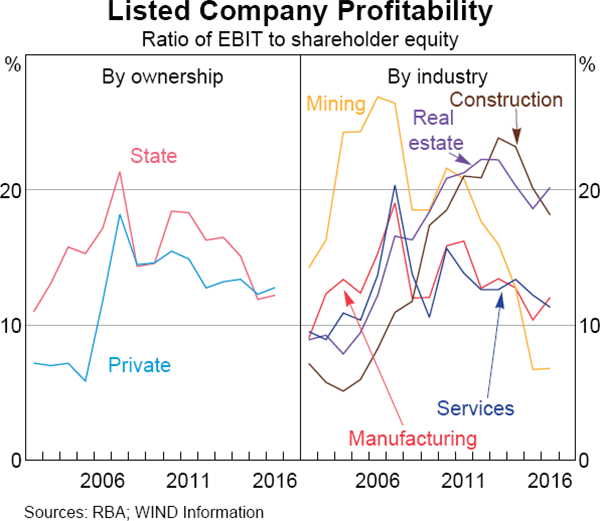
While the profitability of firms in building-related sectors (real estate and construction) rose to relatively high levels in the aftermath of the stimulus, it has declined over the past few years. The higher operating profitability of state firms over much of the sample was largely offset by their higher effective tax rates and interest costs (due to their higher leverage).[11] After interest and tax payments (i.e. net profit, rather than EBIT), private companies were more profitable than state companies in 2015 and 2016, after several years of similar profitability.
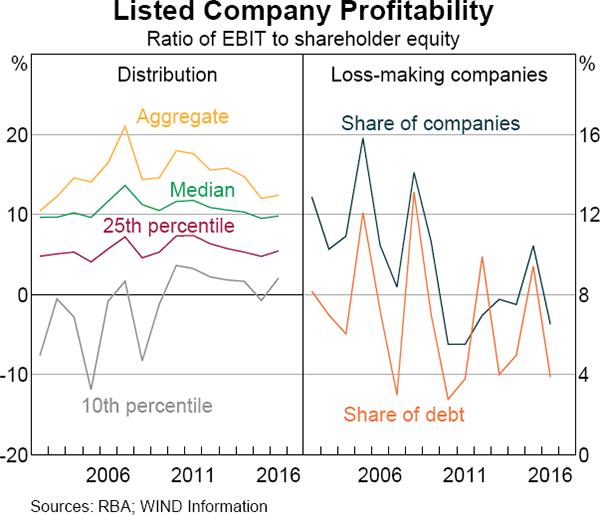
The proportion of listed firms that are loss making fell sharply in 2016, after increasing for several years (Graph 6). The share of loss-making firms was higher for state firms than for private firms in 2016, and most common in the mining industry, consistent with its lower average profitability.
Interest Servicing
The implied interest rate paid on debt by listed companies has declined over the past few years, consistent with a series of reductions in benchmark lending interest rates by the People's Bank of China and corresponding declines in average lending rates (Graph 7).[12] This has supported firms' profitability (by reducing interest payments for a given amount of debt) and allowed them to increase leverage by more than would otherwise be possible (because servicing debt is easier).
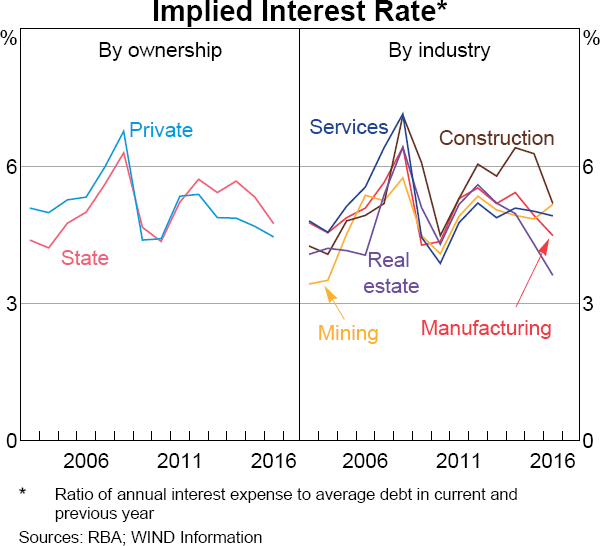
A commonly cited view is that state firms receive loans on better terms from banks (Yi and Liang 2016). This is not directly supported by the listed company data, with state firms having faced higher average implied interest rates than private firms over the past few years, in aggregate and by industry.[13] However, this may be because the interest subsidy that state firms receive is offset by their lower average creditworthiness.
A simple regression of the listed company data suggests that, after controlling for various factors that influence creditworthiness, state firms do face lower (although not significantly different) interest rates relative to private firms.
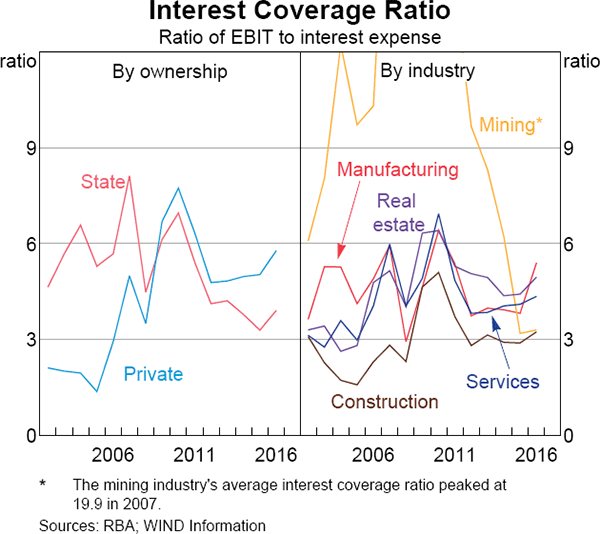
Despite the decline in implied interest rates and leverage of listed firms over the past few years, falling profitability has resulted in a decline in the interest coverage ratio (how many times annual earnings can pay interest expenses), entirely driven by the state sector (Graph 8).[14] The interest coverage ratios of private firms have been greater than those of their state counterparts in recent years, due to their lower indebtedness. Across industries, changes in interest coverage have been mixed, although all saw an increase in 2016. Construction firms have the lowest level of average interest coverage, while mining company interest coverage has declined in recent years from very high levels.
Liquidity and Payments
An important source of risk for firms is the maturity mismatch between their assets and liabilities. While a firm may be solvent, with relatively low debt and sufficient profitability, a shortage of liquid assets or, equivalently, an abundance of short-term liabilities, can leave it vulnerable to a negative shock. Non-interest-bearing debt liabilities, especially purchases made on credit (i.e. accounts payable), can also be a source of exposure not apparent in debt ratios such as those discussed above.
The reduction in short-term debt from almost 20 per cent of assets in 2005 to 10 per cent in 2016 has led to an improvement in firms' liquidity. Firms have also increased their holdings of cash in the past few years, resulting in a positive net liquidity position (the difference between cash and short-term debt liabilities) in aggregate (Graph 9). Several private-sector reports attribute this increase in cash holdings by listed firms to a combination of accommodative monetary conditions and a lack of profitable investment opportunities (evidenced in the wider corporate sector by an increase in corporate demand deposits) (Yeung and Qu 2016). These reports argue that companies are using the abundance of liquidity to ‘hoard’ cash rather than to invest. Accordingly, a tightening of financial conditions may result in firms running down their stocks of cash.
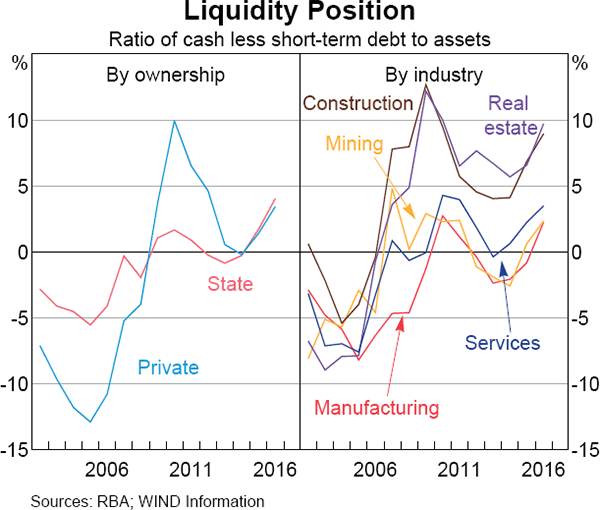
State and private listed companies have had similar liquidity positions in recent years, after several years in which private firms' liquidity positions were much higher. The increase in liquidity has also been relatively broad based across industries, although firms in the manufacturing and mining sectors still hold relatively high levels of short-term debt compared to cash. Construction and real estate companies continue to have relatively stronger liquidity positions, largely because they hold more long-term debt. The liquidity positions of ‘highly leveraged’ companies have improved in the past few years, despite their average leverage increasing, due to a shift towards longer-term debt.
Despite the recent increase in liquidity, the time taken for listed firms to make and receive payments has risen significantly over the past decade (Graph 10). On average in 2016, it took around 90 days for companies to pay suppliers, and around 50 days to receive payment from customers.[15] These periods have been increasing through a combination of greater use of credit sales and purchases and a longer time to resolve those transactions. Days of inventory outstanding have also been increasing, driven entirely by state firms. The cash conversion cycle – the time between payment for goods and services provided by suppliers and receiving payment from sales – fell in 2016.[16] This was due to a sharp increase in the time taken to pay suppliers for both private and state firms.
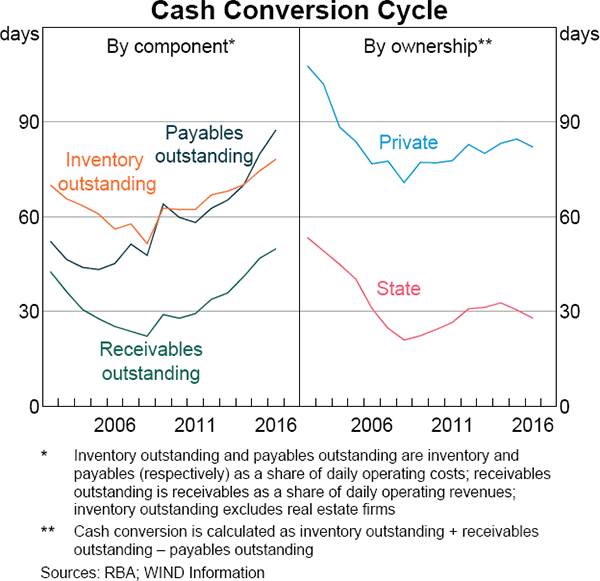
There are substantial variations in cash conversion by ownership and industry. State companies have tended to delay payment to suppliers longer, and have had to wait a shorter time to receive payments from customers than their private counterparts. By industry, real estate and construction companies have taken the most time to pay suppliers, and construction firms have also taken much longer to receive payment from customers than firms in other industries.
Assessment
Although listed companies represent only a small subset of the total number of firms in China, many of the trends seen in listed company financial measures reflect broader conditions in the Chinese economy. The increase in corporate debt in China, and slowing of overall economic growth, are mirrored in the higher leverage and weaker revenue streams of listed firms over the past decade. By the same token, accommodative financial conditions, reflected in lower interest rates, have assisted in reducing the cost of debt for listed companies across a wide range of industries and contributed to more liquid corporate balance sheets. The improvement in economic conditions in 2016 is also reflected in a broad-based, if modest, improvement in several listed company indicators, including profitability, liquidity and interest coverage.
However, the listed company data point to a number of areas of fragility in the Chinese corporate sector. The erosion of profitability across the whole sample of companies over the past decade has coincided with an increase in the time taken by firms to receive cash from their operations. Another consistent theme is the relatively more vulnerable position of state firms, which have higher leverage, greater declines in profitability and weaker capacity to service interest on their debt than private firms. The high concentration of debt in the most leveraged firms increases the chance that failures among these firms would be more broadly disruptive.
Several industry trends are also worth noting. The high leverage and declining profitability of listed real estate and construction firms highlight the vulnerability of those sectors and the risk they pose, given the importance that residential construction has played in supporting economic growth in recent years (Cooper and Cowling 2015). The low profitability and liquidity of manufacturing firms is also notable, given the historical importance of this sector to the Chinese economy. Lower profitability, particularly in the manufacturing and real estate sectors, is also likely to have contributed to the overall slowing in Chinese investment. A tightening of monetary conditions over 2017, as has been signalled by some Chinese officials, may support the deleveraging process. However, this is also likely to reduce profitability and increase the cost of debt to firms, especially to those with greater leverage.
Footnotes
The author is from Economic Group [*]
China's National Bureau of Statistics (NBS) publishes aggregate data on the balance sheets of industrial (mining, manufacturing and utilities), real estate and construction firms with annual revenue exceeding CNY20 million. [1]
Data are sourced from financial statements collated by WIND Information. Companies listed with either ‘A’ or ‘B’ shares (B shares are open to foreign investment) on either stock exchange are included, but companies with multiple listings are counted only once. The sample is unmatched, so it includes all companies listed on the exchange at each point in time. Around 100 companies have been delisted since 2000. Roberts and Zurawski (2016) find that the broad features of this dataset are similar if a matched sample is used. [2]
Estimates of non-financial enterprise assets are from the Chinese Academy of Social Sciences, while the official measure of debt is the People's Bank of China's total social financing, excluding household loans and equity financing. [3]
This article uses industry classifications from the China Securities Regulatory Commission. The services industry group is a combination of several service-related industries. Listed companies in the financial industry category (CNY155 trillion in assets at the end of 2016) are excluded from this analysis. Comparisons of industry shares in the wider corporate sector are made using estimates of industry assets from the NBS surveys of industrial, construction and real estate firms. [4]
This article identifies state versus private firms using the ownership classification scheme from WIND Information. State companies include those classified as local or central state-owned companies, and public or collective enterprises. All others are classified as privately owned. The ownership classification is not time varying and is based on current ownership. A small number of companies in the sample have changed from state-owned to privately owned, or vice versa, which may result in some small discrepancies in the history of some of the state and private series. [5]
The 2008–09 economic stimulus was enacted by the Chinese authorities to minimise the impact of the global financial crisis on the economy. [6]
The results in this section are consistent with previous work examining China's corporate leverage using listed company data, including Chivakul and Lam (2015) and Roberts and Zurawski (2016). [7]
Interest-bearing debts are liabilities that require interest payments, i.e. loans and debt securities; other liabilities include accounts payable and funds received in advance. [8]
In contrast to the reduction in leverage seen in the listed company data, some broader estimates of corporate debt (e.g. the debt-to-GDP ratio) have continued to increase quickly in recent years. This difference largely reflects the different choice of denominator. Roberts and Zurawski (2016) find that the growth of debt in a matched sample from the same listed company dataset discussed here broadly matches the dynamics of China's official measure of debt. [9]
The measure of profitability used here is earnings before interest and tax (EBIT) as a ratio to equity. EBIT is a measure of operating profit and ignores variables such as the tax burden or operating structure of firms. [10]
The higher return on equity of state firms over this period also reflects their greater use of leverage. Leverage allows them to increase their profit relative to equity, even if the return on their assets declines. [11]
The implied interest rate is calculated as the current year's interest expense divided by the average of the current and previous year's stock of debt. Accordingly, this reflects the interest paid on all debt, including both loans and debt securities. [12]
This is corroborated by survey data from 2004/05 and 2011 cited in Lardy (2014, p 108), which suggest there is little difference in the interest rates paid on loans by comparable state and private firms. [13]
The greater risks this deterioration poses could be partially offset by the fact that state firms are presumably more likely to receive assistance from the government in the event of financial stress. [14]
These ratios are calculated using operating costs and revenue, which will include some costs/revenues that are not directly related to the purchase/sale of products. Accordingly, these measures probably underestimate the number of days outstanding. [15]
Cash conversion is measured by adding days of inventory and receivables outstanding and subtracting days of payables outstanding. [16]
References
BIS (Bank of International Settlements) (2017), BIS Statistical Bulletin, March.
Chivakul M and WR Lam (2015), ‘Assessing China's Corporate Sector Vulnerabilities’, IMF Working Paper WP/15/72.
Cooper A and A Cowling (2015), ‘China's Property Sector’, RBA Bulletin, March, pp 45–54.
IMF (International Monetary Fund) (2016), Global Financial Stability Report: Potent Policies for a Successful Normalization, World Economic and Financial Surveys, IMF, Washington DC.
Lardy N (2014), Markets over Mao: The Rise of Private Business in China, Peterson Institute for International Economics, Washington DC.
NDRC (National Development and Reform Commission) (2017), ‘Report on the Implementation of the 2016 Plan for National Economic and Social Development and on the 2017 Draft Plan for National Economic and Social Development’, 5 March. Available at <http://online.wsj.com/public/resources/documents/NPC2017_NDRC_English.pdf>.
RBA (Reserve Bank of Australia) (2016), Financial Stability Review, October.
Roberts I and A Zurawski (2016), ‘Changing Patterns of Corporate Leverage in China: Evidence from Listed Companies’ in C Fang, R Garnaut, L Johnston and L Song (eds), China's New Sources of Economic Growth, Volume 1, ANU Press, Canberra, pp 271–312.
Yeung R and D Qu (2016), ‘Is China in a “Liquidity Trap”?’, ANZ Research China Insights, 21 July.
Yi E and H Liang (2016), ‘How High is the Funding Cost for Private Investment?’, China International Capital Corporation Macro Brief, 21 July.