Bulletin – June 2017 Payments Banking Fees in Australia
- Download 353KB
Abstract
The Reserve Bank has conducted an annual survey on bank fees since 1997. The most recent survey suggests that banks' aggregate fee income increased at a relatively slow pace in 2016. Deposit and loan fee income continued to decline relative to the value of products on which these fees are levied. Greater use of electronic payment methods continued to support moderate growth in credit card and merchant service fee income.
Overview
The Reserve Bank's annual bank fee survey provides information on the fees earned by banks through their Australian operations.[1] The focus of the survey is on fee income generated through the provision of loans, deposit services and payment services. The 2016 survey included 16 institutions, capturing 90 per cent of the Australian banking sector by balance sheet size.[2] Fees earned from operations outside of Australia and other fee income obtained through funds management and insurance operations are excluded from this survey. This article summarises the results from the latest survey, covering banks' financial years ending in 2016.[3]
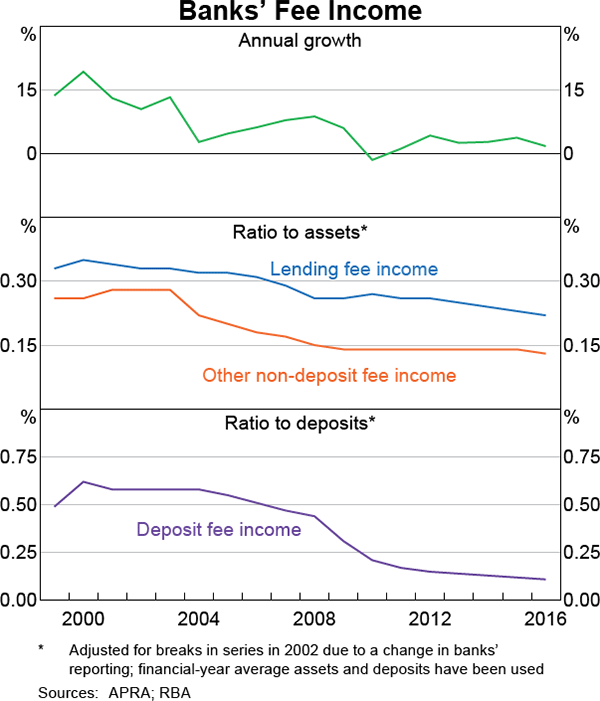
In 2016, domestic banking fee income from households and businesses grew at a relatively slow pace of 1.7 per cent, to around $12.7 billion (Table 1; Graph 1). Deposit and loan fee income relative to the outstanding value of products on which these fees are levied was slightly lower than in the previous year.
| Households | Businesses | Total | ||||
|---|---|---|---|---|---|---|
| Level $ million | Growth Per cent | Level $ million | Growth Per cent | Level $ million | Growth Per cent | |
| 2013 | 4,127 | 1.6 | 7,595 | 3.1 | 11,711 | 2.5 |
| 2014 | 4,169 | 1.0 | 7,862 | 3.5 | 12,031 | 2.7 |
| 2015 | 4,341 | 4.1 | 8,140 | 3.5 | 12,481 | 3.7 |
| 2016 | 4,408 | 1.5 | 8,291 | 1.9 | 12,699 | 1.7 |
|
Source: RBA |
||||||
Households
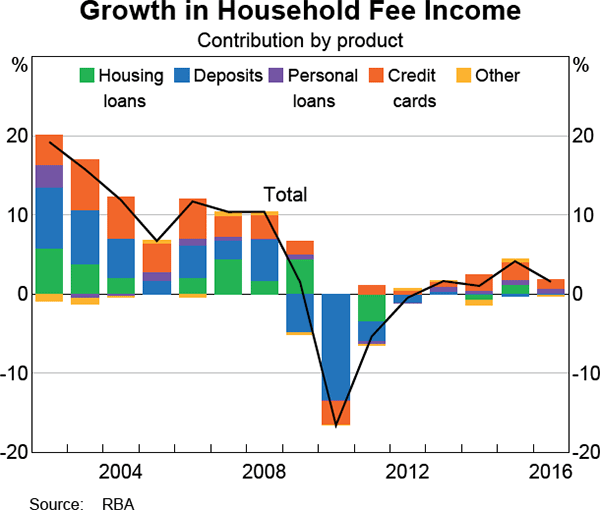
Banks' fee income from households grew by 1.5 per cent in 2016. This represented a slowing in growth from the previous year, reflecting lower growth in fee income from housing lending and credit cards (Graph 2; Table 2). Growth in fee income from personal lending reflected the inclusion of a loan portfolio previously not reported in the survey; excluding these new assets, fee income from this segment declined.
| 2014 | 2015 | 2016 | Annual growth 2016 |
Average annual growth 2010–15 |
|
|---|---|---|---|---|---|
| $ million | $ million | $ million | Per cent | Per cent | |
| Loans: | 2,967 | 3,139 | 3,203 | 2.1 | 1.1 |
| – Housing | 1,182 | 1,234 | 1,239 | 0.4 | −2.2 |
| – Personal | 366 | 391 | 415 | 6.1 | 2.5 |
| – Credit cards | 1,419 | 1,513 | 1,562 | 3.2 | 4.0 |
| Deposits | 1,122 | 1,109 | 1,104 | −0.5 | 1.1 |
| Other fees(a) | 80 | 93 | 89 | −4.9 | −0.2 |
| Total | 4,169 | 4,341 | 4,408 | 1.5 | 0.1 |
|
(a) Includes banking-related fee income from households that cannot be directly related to an individual deposit or loan account (e.g. travellers' cheques or foreign exchange fees) Source: RBA |
|||||
Growth in fee income from credit cards slowed in 2016 to slightly below the average since 2010, but remains the largest component of fee income from households. The growth in fees was supported by continued take-up of credit cards bundled with home loan packages. There were also more instances of fees being charged, with some banks no longer waiving fees for transferring a credit card balance to a new card provider. Higher unit fees also contributed to growth, with some banks increasing annual fees on rewards cards (Table 3).
| 2014 | 2015 | 2016 | Annual growth 2016 Per cent | |
|---|---|---|---|---|
| Annual fees ($) | ||||
| Non-rewards cards | 51 | 53 | 53 | 0.0 |
| Rewards cards | 186 | 185 | 191 | 3.3 |
| All cards | 134 | 133 | 137 | 3.3 |
| Other fees | ||||
| Foreign currency conversion fees (per cent of value) |
2.9 | 2.9 | 2.8 | −1.0 |
| Late payment fee ($) | 19 | 17 | 18 | 2.3 |
|
(a) Simple average fees for cards issued by a sample of seven banks; only cards that are available to new cardholders are included in the sample; note that changes in the sample affect the average fee; as at June of each year Sources: Credit card issuers' websites; RBA |
||||
Income from exception fees charged to households on credit card products continued to decline in 2016 (Graph 3). Despite some increases in unit fees for late payments (Table 3), the decline in exception fee income occurred because customers exceeded their credit limits or made late repayments less often. This trend was broad based across banks.
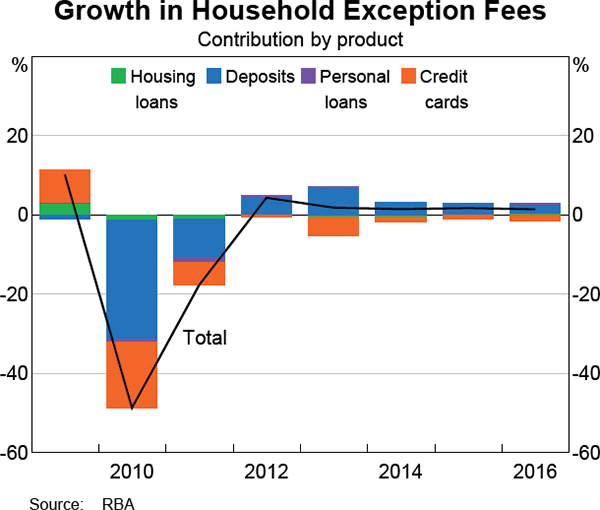
Fee income from housing loans increased only slightly, consistent with slower growth in loan approvals over the year. Banks continued to report that waivers or reductions in establishment fees were being offered. This more than offset a modest increase in exception fees, particularly those relating to the early termination of a fixed interest-rate period and dishonour fees.
Fee income from deposits declined slightly over 2016, following similarly small declines in recent years. The decline in deposit fee income in 2016 was broad based across most types of fees on deposit accounts, consistent with continued competition between banks for households' deposits. Banks reported that the decline in fee income was due to more fee waivers, reduced ATM charges owing to customers' increased use of contactless payments technology and EFTPOS cash-out options, and reduced balance enquiries arising from increased use of mobile banking applications. Banks reported that customers are continuing to shift away from traditional savings products, such as stand-alone accounts, to online savings products linked to transaction accounts which attract fewer fees. However, this was partially offset by an increase in income from more frequent occurrences of exception fees on transaction accounts, particularly dishonour fees.
Businesses
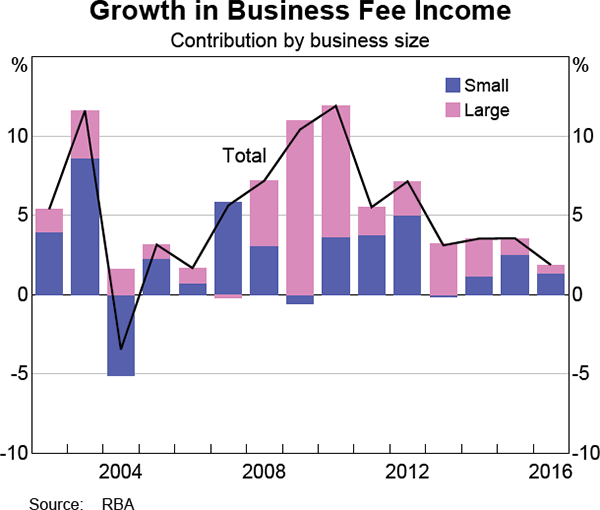
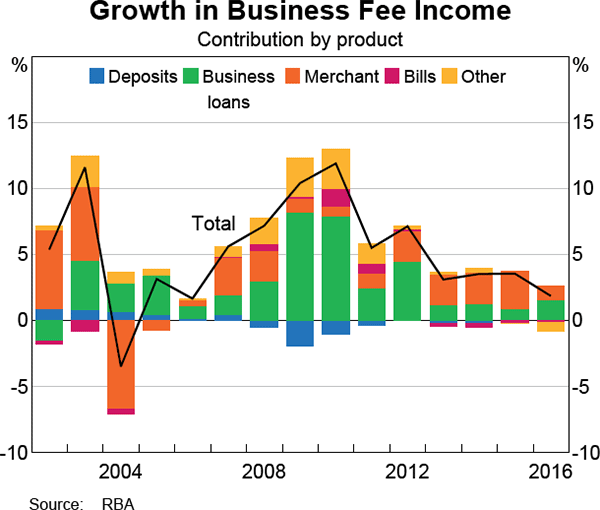
Total fee income from businesses increased by 1.9 per cent in 2016, around the slowest pace for a decade (Graph 4; Table 4). Slower growth was recorded for fee income from both small and large businesses. By product, growth in fee income was driven by increases in business loan fees and merchant service fee income from processing card transactions. Fee income from deposit accounts also increased slightly, while fee income from bank bills and other sources declined (Graph 5).
| 2014 | 2015 | 2016 | Annual growth 2016 | Average annual growth 2010–15 | |
|---|---|---|---|---|---|
| $ million | $ million | $ million | Per cent | Per cent | |
| Deposit accounts | 589 | 587 | 595 | 1.3 | −1.9 |
| – of which: exception fees(a) | 41 | 41 | 60 | na | −7.4 |
| Loans | 3,362 | 3,433 | 3,552 | 3.5 | 4.8 |
| – of which: exception fees(a) | 42 | 42 | 53 | na | −4.1 |
| Merchant service fees | 2,427 | 2,651 | 2,739 | 3.3 | 7.6 |
| Bank bills | 204 | 190 | 179 | −5.6 | 0.7 |
| Other(b) | 1,280 | 1,279 | 1,226 | −4.1 | 2.4 |
| Total | 7,862 | 8,140 | 8,291 | 1.9 | 4.5 |
| – of which: exception fees(a) | 83 | 83 | 113 | na | −5.8 |
|
(a) Exception fees in 2016 are impacted by a reporting methodology change Source: RBA |
|||||
The increase in business loan fees mainly reflected higher reported fee income from small businesses. However, changes to banks' reporting methodology accounted for around half of this increase; abstracting from these changes, small business fee income growth was modest. Fee income from loans to large businesses decreased slightly overall, driven by the major banks, who reported that this reflected competitive pressures and reduced new lending activity.
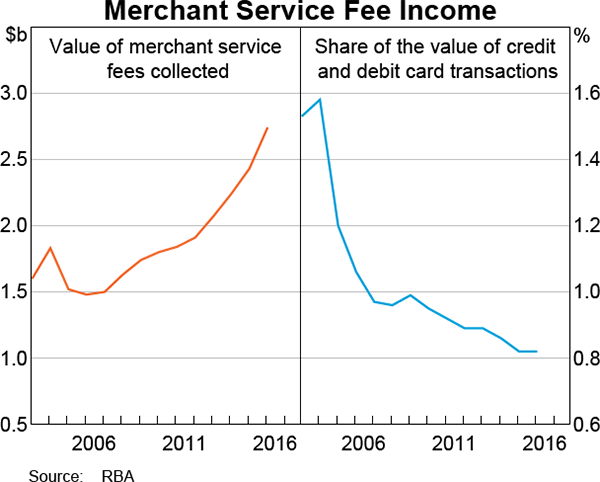
Growth in merchant service fee income was mainly attributable to increased transaction volumes, particularly for credit cards due to wider acceptance of contactless payments. Increased use of platinum and business credit cards, which attract higher interchange fees, also contributed to growth in merchant service fee income from small businesses. Nevertheless, growth in merchant service fee income was evenly spread across small and large businesses. The ratio of merchant service fee income to credit and debit card transactions was stable during 2016 after declining for much of the past decade (Graph 6).
Bank bill fee income declined over 2016, partly offsetting the growth in merchant service fee and loan fee income. This reflected a broad shift away from the use of bank bills amid encouragement from banks for customers to use alternative products.
Fee income from business deposits increased slightly, with most of the growth resulting from increased collection of account servicing fees from large businesses. Growth in deposit fee income from small businesses, which accounts for the majority of business deposit fee income, remained subdued. This was due mainly to lower deposit transaction volumes, although some banks also reported reduced unit fees.
Business loan and deposit exception fees increased during 2016, but this was driven by changes in reporting methodologies. Abstracting from this factor, exception fees were little changed.
Conclusion
Over the past five years, growth in banks' aggregate fee income has been relatively low and stable. Fee income from businesses has grown at a modest pace over this period, while fee income from households has been little changed. By product, this trend primarily reflects relatively flat aggregate deposit fee income and slow growth in aggregate loan fee income. This has offset faster growth in credit card and merchant service fee income, driven by increased transaction volumes as use of electronic payment methods has expanded.
Footnotes
The authors are from Domestic Markets Department. [*]
The data from the survey are published in the Reserve Bank's statistical table, ‘C9 Domestic Banking Fee Income’, and are subject to revision on the advice of the participating banks. [1]
Survey results have been affected by mergers and acquisitions among participating institutions and some changes in participants' methodology (where possible, this has been reflected in revisions to data reported in previous years). [2]
Apart from Table 3, all data from the survey are based on individual banks' financial years, which differ across banks. [3]