Bulletin – March 2013 Finance Developments in Banks' Funding Costs and Lending Rates
- Download the article 1.36MB
Abstract
This article updates previous Reserve Bank research on changes in the composition and cost of banks' funding and the impact of these changes on lending rates (Deans and Stewart 2012). The main findings are that the absolute levels of funding costs and lending rates have fallen over the past year, while spreads between these rates and the cash rate have widened. This latter development primarily reflects a continuation of strong competition for deposits. Over recent times, this competition has shifted from term deposits towards at-call savings deposits, and customers have responded to the shift in the relative returns on these products. Although the recent narrowing of spreads on long-term wholesale debt will eventually put downward pressure on funding costs, developments in deposit competition will have a larger impact on movements in funding costs. Lending rates have tended to move in line with funding costs over the past 12 months.
Introduction
In setting lending rates, banks consider a number of factors. A key consideration is their cost of funding, which is a function of the composition and price of different liabilities (Fabbro and Hack 2011). Banks also take into account the required risk premia, including the credit risk associated with loans and the liquidity risk involved in funding long-term assets with short-term liabilities. Choices related to banks' growth strategies, competitive pressures and the desire to provide a return to equity holders also affect banks' lending rates.
An important element in determining the overall cost of banks' funding is the level of the cash rate, which acts as an anchor for the broader interest rate structure of the domestic financial system. Nevertheless, changes in the level of compensation demanded by investors to hold bank debt, competitive pressures and non-price factors can exert significant influences on banks' funding costs. There is typically some delay before the full effect of changes in these factors flows through to funding costs and lending rates. In part, this reflects the time that it takes for balance sheet liabilities to be repriced, particularly those with longer terms to maturity. The Reserve Bank Board takes these developments into account when it determines the appropriate setting of the cash rate to ensure that the structure of interest rates faced by households and businesses is consistent with the desired stance of monetary policy.
Composition of Banks' Funding
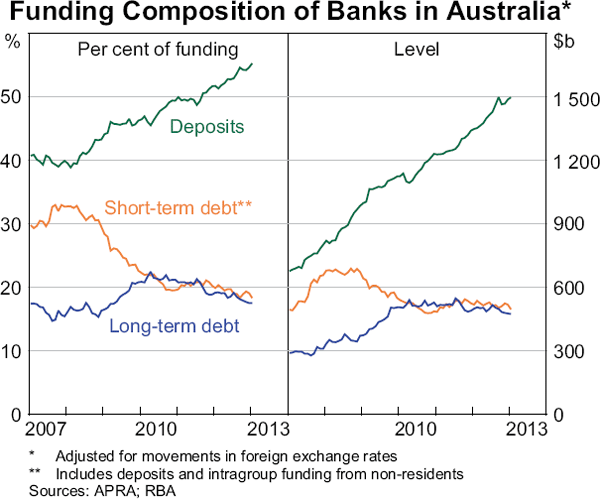
Banks operating in Australia have diverse funding bases. While the funding structure of individual banks can differ quite markedly from the aggregate, over the past five years there has been considerable change in the general composition of banks' funding. Most notably, there has been a broad-based shift away from the use of short-term wholesale debt, as well as the use of securitisation (Graph 1). In contrast, there has been a sustained increase in the use of deposits. These shifts are consistent with a reassessment of funding risks by banks globally, as well as market and regulatory pressures for banks to secure more stable funding sources. Most of the shift in the composition of funding occurred between late 2008 and 2010. However, the share of deposit funding has continued to increase, rising by 4 percentage points over the past 12 months to its current level of about 55 per cent of total funding.
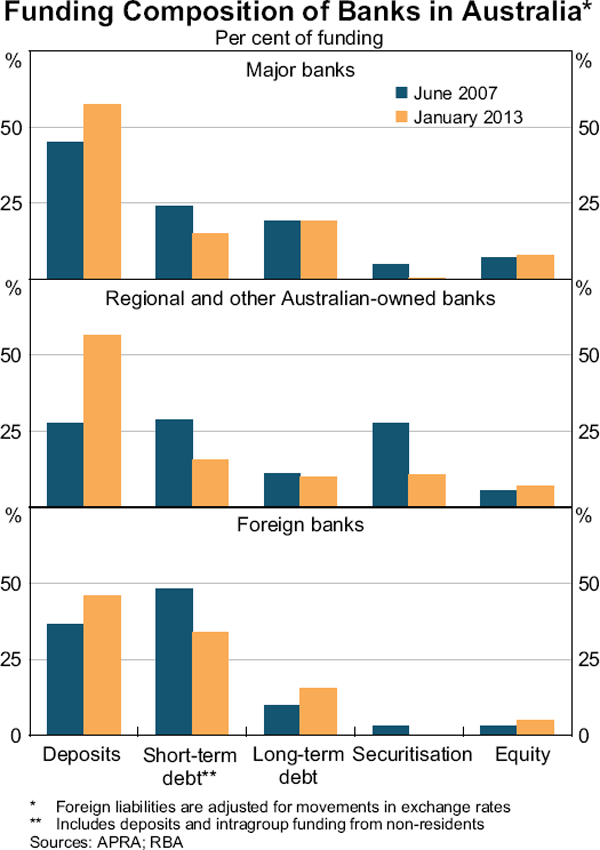
The increase in the share of funding sourced from deposits over recent years has occurred across all types of banks in Australia. This trend has been most pronounced for the regional and other smaller Australian-owned banks, with their share of funding sourced from deposit liabilities doubling since 2007. Prior to the global financial crisis, these institutions used securitisation more heavily as a form of funding. However, after the onset of the crisis, investor appetite for Australian residential mortgage-backed securities (RMBS) diminished and, while it has recovered somewhat, it remains below pre-crisis levels. As a result, the regional and other smaller Australian-owned banks have increased their use of deposits to fund their loan books.
Most of the growth in deposit liabilities had been driven by strong growth in term deposits, with the share of total funding sourced from term deposits increasing by 10 percentage points between June 2007 and early 2012. More recently, however, most of the growth in deposits has been in at-call savings deposits, reflecting developments in the pricing of these products. Transaction deposits, which typically offer near-zero interest rates, have diminished slightly as a share of funding.
The share of short-term wholesale debt funding has fallen from more than 30 per cent of total funding in the middle of 2007 to its current level of around 20 per cent, largely owing to lower issuance in the domestic market (Graph 2). The reduction in domestic issuance has been driven by a number of factors, including: domestic investors substituting away from certificates of deposit (CDs) towards more attractively priced term deposits; and banks reducing their cross-holdings of each other's paper.[1]
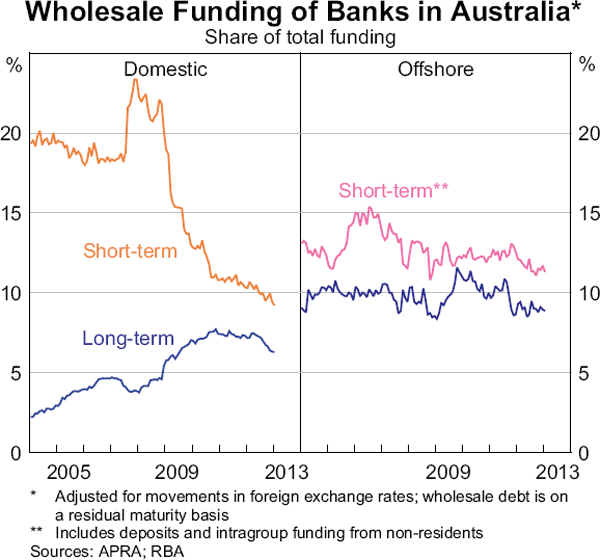
By contrast, the share of funding sourced from long-term wholesale debt markets has increased over the same period, although there has been a slight decline in the share of such funding sourced from the domestic market over the past 12 months.
This recent decline largely reflects banks funding new lending with new deposits, while using wholesale markets to roll over maturing debt or to retire existing government-guaranteed debt (Graph 3).[2]
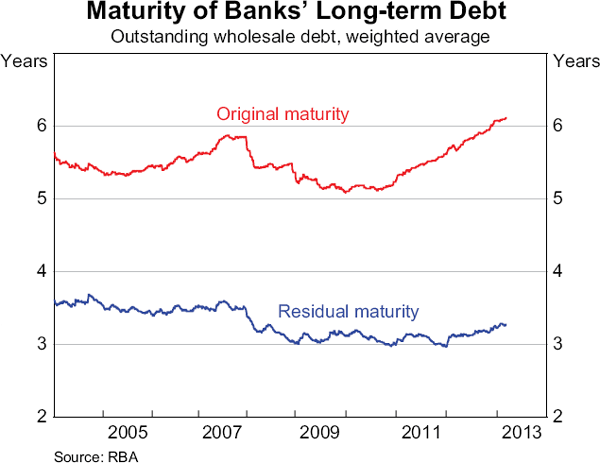
Throughout 2012, banks continued to increase the maturity of new bond issuance, partly through the issuance of covered bonds, which were introduced in October 2011 (Graph 4).[3] In total, there has been around $50 billion of covered bonds issued by Australian banks, with issuance occurring at maturities of up to 19 years. The longer maturity of covered bond issuance reflects their higher credit ratings, given their dedicated collateral backing, and the expanded investor base to which these securities appeal. Overall, these securities have been issued with an average maturity that is about one year longer than unsecured issuance. The maturity of unsecured long-term wholesale bond issuance has also increased to be around its pre-crisis level.[4] There has also been a slight increase in the issuance of RMBS over the past year, although it remains at around one-quarter of its value prior to the crisis. More recently, there has been a further pick-up in the issuance of RMBS as banks have taken advantage of a narrowing in spreads.
Cost of Funding[5]
Reflecting the general decline in interest rates, the absolute level of banks' funding costs fell during 2012, although the decline was less than the reduction in the cash rate. This largely reflected a sustained increase in the cost of deposits relative to the cash rate. Much of that increase occurred in the early part of 2012. Over the latter part of 2012, deposit rates moved broadly in line with the cash rate and relevant money market rates. The spread between the cost of outstanding wholesale debt and the cash rate continued to rise over 2012, although more recently there has been a significant narrowing in the spreads paid on newly issued debt.
Deposits
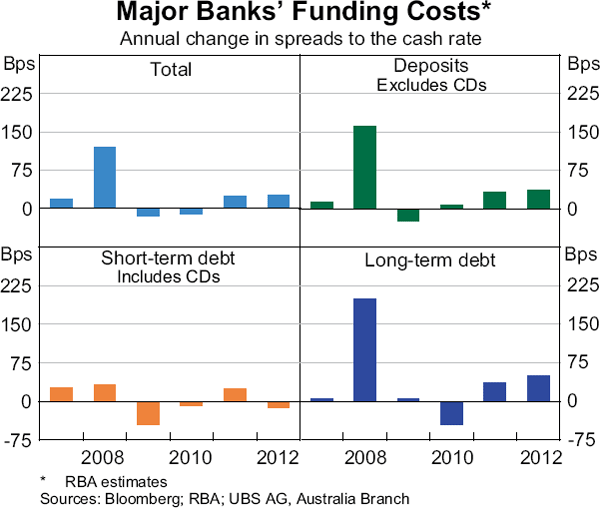
Competition for deposits remained strong throughout 2012, with the average interest rate offered by the major banks on their at-call savings and term deposit products rising relative to benchmark rates (Graph 5). While the average cost of total deposit funding for the major banks is estimated to have declined by 90 basis points, this was less than the 125 basis point reduction in the cash rate over the year.
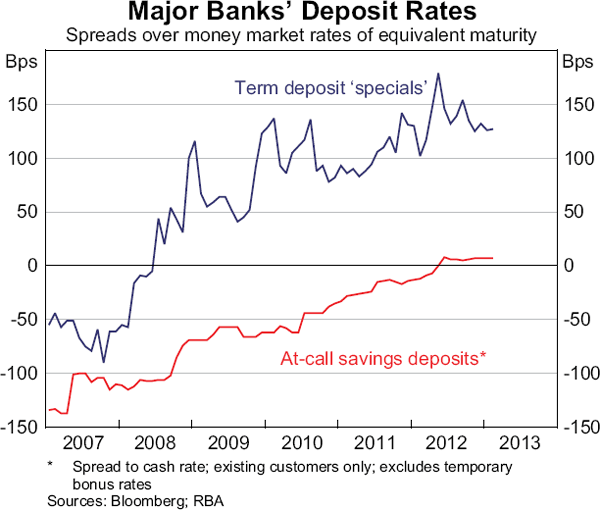
Until recently, competition for deposits had been most intense for term deposits. The spread of advertised term deposit ‘specials’ to wholesale benchmark rates of equivalent maturity paid by the major banks has increased by around 200 basis points since the onset of the global financial crisis. In addition, the major banks also offer an additional premium to some customers above their advertised term deposit rates. The size of these premiums varies depending on the nature of the customer relationship, the size of the deposit and the rates offered by other financial institutions. As these premiums paid to customers are negotiated on an individual basis, they are difficult to track over time.[6] Liaison with the major banks suggests that the average size of these premiums has not changed substantially over the past six months, with some customers offered premiums of up to 30 basis points.
Over the past year, there was a marked shift in competition towards at-call deposits. This has largely manifested itself as an increase in the rates offered on bonus saver accounts relative to term deposits around the middle of the year (Graph 6).[7] As a result of these more attractive rates, the volume of at-call deposit flows increased substantially, while some of the growth occurred at the expense of term deposits in the second half of the year.
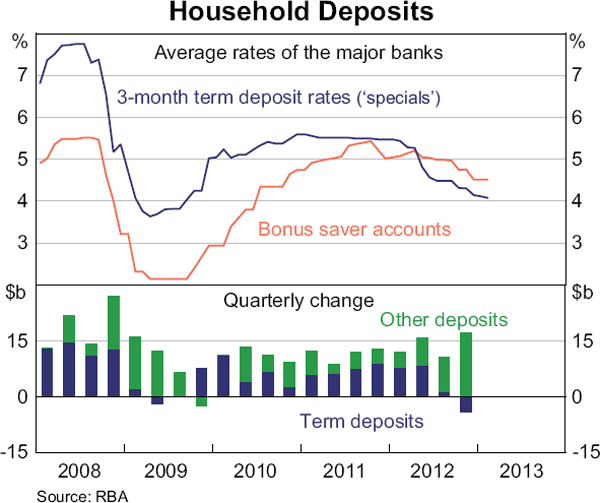
While the average rate on the major banks' transaction and at-call savings deposits fell by 80 basis points over 2012, spreads to the cash rate widened by 45 basis points. This is slightly more than the widening of spreads for term deposits relative to their benchmark rates. For transaction accounts and some cash management accounts, interest rates offered are generally very low and are typically not repriced following adjustments to the cash rate. Hence the difference between these rates and the cash rate have become less negative as the cash rate has decreased.
By contrast, traditional online savings accounts typically offer an interest rate close to the cash rate and these products are generally repriced in line with movements in the cash rate. Since these accounts were introduced in the late 1990s, most financial institutions have been offering such products. Increased competition for online deposits recently has resulted in a greater number of institutions offering attractive introductory rates for new customers. Nevertheless, the cost of these deposits, relative to the cash rate, has been little changed over the past year.
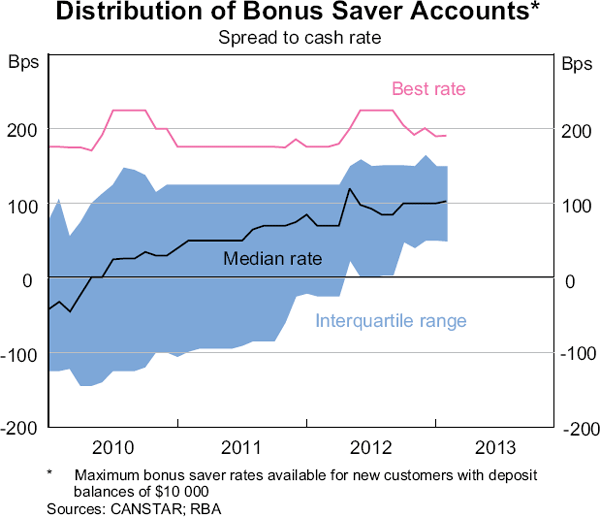
This is not the case for rates offered on bonus saver accounts, which have increased substantially over recent years (Graph 7). The median interest rate offered on bonus saver accounts by all institutions is now around 100 basis points above the cash rate; three years ago, bonus saver deposit rates were around 50 basis points below the cash rate. More recently, increased competition for these types of deposits has resulted in an increase in the number of financial institutions offering bonus saver accounts and a narrowing in the dispersion of bonus rates on offer.
Increased competition for bonus saver deposits by financial institutions is broadly consistent with the aim of securing stable deposit funding. In particular, the pricing characteristics of these accounts appeal to customers who want to earn a higher rate of interest while maintaining ready access to their deposits (although a withdrawal may involve foregoing the bonus rate of interest). The bonus nature of the interest payment discourages customers from reducing their deposit balances, which limits withdrawals from these accounts. By comparison, traditional online savings accounts do not typically penalise customers if they withdraw funds.
Despite the intensification in competition for deposits, the best rate offered on bonus saver accounts in the market has remained around 200 basis points above the cash rate in recent years.
Wholesale debt
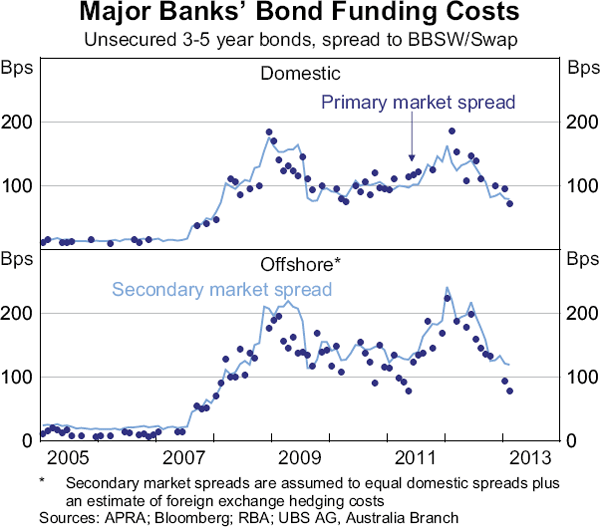
The absolute cost of issuing both secured and unsecured long-term wholesale debt has fallen over the past year, largely reflecting the decline in benchmark rates (Graph 8). Spreads on the major banks' unsecured bond issuance widened sharply at the end of 2011, reflecting a broad-based increase in the level of compensation demanded by investors globally for credit risk (Graph 9). However, these spreads have since narrowed with the improvement in financial market sentiment. In early 2013, spreads on the major banks' unsecured bonds fell to their lowest level since late 2009. While many banks have taken advantage of the decline in spreads to retire more expensive government-guaranteed debt, new issuance has generally been priced above the spreads at which maturing debt was issued, reflecting the fact that there remains some debt outstanding that was issued prior to the global financial crisis.
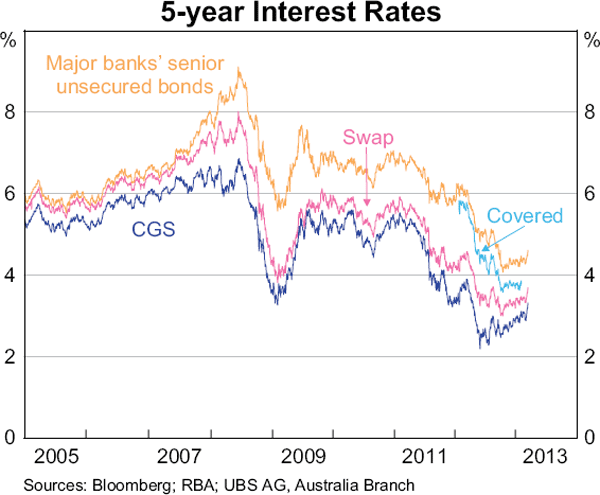
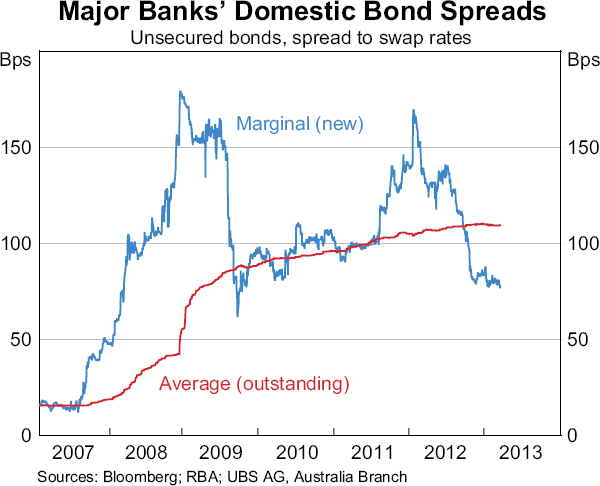
The significant decline in spreads over the second half of 2012 pushed the (marginal) cost of the major banks' new long-term wholesale debt below the weighted average cost of their outstanding bonds (Graph 10). However, the average cost of the outstanding stock of bonds, as measured by spreads to benchmark swap rates, continued to rise throughout 2012. This reflects both the timing of issuance and the historical spreads at which maturing debt was initially priced. In particular, around one-quarter of the major banks' 2012 maturing wholesale debt was issued prior to 2008 when spreads were considerably lower. Consequently, the spreads paid on maturing debt was noticeably lower than spreads paid on new debt issued in 2012. So as maturing debt was rolled over, the average spread of outstanding bonds increased. The timing of both issuance and any change in spreads will continue to have an influence on average long-term wholesale debt costs, with a portion of the major banks' debt maturing in 2013 having been issued below current market spreads. However, if current bond spreads are maintained, this will, in time, see the average cost begin to decline, as newly issued bonds are issued at lower spreads than those maturing.
Although the relative importance of short-term wholesale debt has diminished over recent years, it continues to account for around 20 per cent of banks' funding liabilities. A large proportion of this debt is issued as 1-month or 3-month bank bills or CDs, the spreads on which narrowed relative to the cash rate over 2012. This narrowing of spreads on short-term debt alleviated some of the upward pressure on total funding costs.
Overall cost of funding
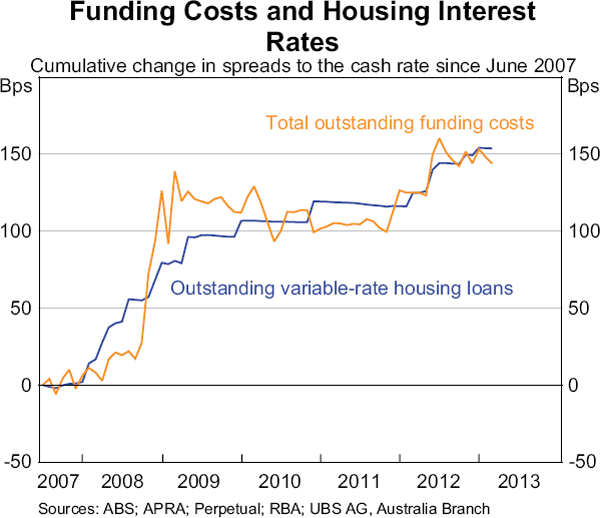
As noted previously, there are a number of factors that influence banks' total debt funding costs, including changes in risk sentiment and competition for funding sources. These factors affect both the price of banks' funding liabilities and the composition of their balance sheets. Taking the cost of the individual funding sources noted above and weighting them by their share of total bank funding provides an estimate of the overall change in banks' funding costs. This approach considers the effect of changes in both the price and composition of banks' funding liabilities and suggests that the major banks' cost of funding has increased by about 150 basis points relative to the cash rate since the onset of the global financial crisis (Graph 11).
Most of the increase in funding costs for the major banks occurred during late 2008 and early 2009, when the global financial crisis was at its most severe. From that period until mid 2011, the major banks' funding costs are estimated to have moved broadly in line with changes in the cash rate. Since then, however, increases in the cost of deposit funding and the level of compensation demanded by investors to hold bank debt, particularly in the first half of 2012, has seen estimated funding costs rise by a further 40–50 basis points relative to the cash rate. More recently, overall funding costs have been broadly unchanged; deposit rate spreads have been broadly constant, and the recent decline in long-term wholesale debt spreads have, to date, had little effect on outstanding funding costs.
For the regional banks, the evidence suggests that the overall increase in funding costs since the onset of the global financial crisis has been larger than the increase in funding costs experienced by the major banks. A large portion of this increase has been driven by the substantial shift in the composition of regional banks' funding liabilities away from securitisation and towards relatively more expensive deposit funding, as well as an increase in the cost of their deposits and wholesale debt funding.
Banks' Lending Rates
In setting lending rates, banks take account of the cost of funding liabilities and equity, as well as a risk margin designed to cover the expected losses from making a loan. In the 10 years leading up to the global financial crisis, banks' overall cost of funds followed the cash rate closely; risk premia were low and stable, and the relative importance of equity capital in funding banks' loan portfolios was fairly constant. Since the onset of the global financial crisis, the spread between lending rates and the cash rate has increased for all loan types. This has predominantly reflected an increase in debt funding costs. The variation in lending rates across different loan types reflects a reassessment of the relative riskiness of those loans.
During 2012, the average interest rate on outstanding variable-rate housing loans rose by about 40 basis points relative to the cash rate. This increase is consistent with the overall increase in banks' funding costs, suggesting that risk margins were largely unchanged (Graph 12). By contrast, the average interest rate on new variable-rate housing loans increased by around 35 basis points relative to the cash rate, reflecting a small increase in the average size of discounts offered by banks to new customers, as competition for mortgage lending remained strong throughout the year.
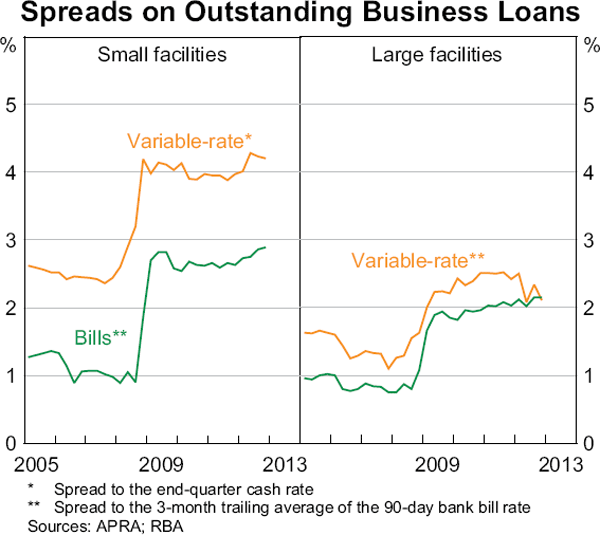
The interest rates on around two-thirds of business loans are typically set at a margin over the bank bill swap rate rather than the cash rate. Since 2009, spreads on both small and large business bill facilities have fluctuated within a tight range (Graph 13). However, after peaking in September 2011, the spread on outstanding variable-rate large business facilities has decreased, whereas spreads on other outstanding business lending have been gradually trending higher. By contrast, spreads on small business variable-rate lending increased in the first half of 2012. These loans are predominantly secured by residential mortgages and are therefore repriced in a similar manner to housing loans.
Net Interest Margins
Lending rates and funding costs are key drivers of changes in banks' net interest margins. During 2012, both lending rates and funding costs fell by similar amounts in absolute terms. Abstracting from changes in other factors, this suggests that the major banks' net interest margins should not have changed much. However, the net interest margins reported by the major banks contracted during 2012, although some banks have subsequently reported a widening of their margin in recent trading updates. In part, this reflects timing differences between balance sheet reporting dates and changes in both funding costs and lending rates, particularly those that have occurred since mid 2012. Changes in the composition of banks' assets, including holdings of liquid assets, the use of derivatives to hedge net interest income, and the amount of banks' equity funding will also influence banks' reported net interest margins. The average margin for the major banks continues to fluctuate within a fairly narrow range of between about 2¼ and 2½ per cent (Graph 14).
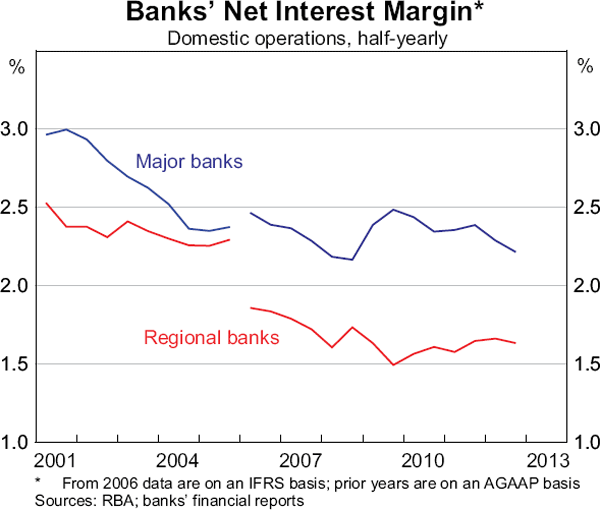
Net interest margins for the regional banks declined by less than the margins for major banks over the past year. In part, this reflects the relative increase in lending rates by the regional banks over 2012. Nonetheless, regional banks' margins continue to be lower than those of the major banks, reflecting their increased use of more expensive deposit funding, the higher cost of their wholesale debt funding compared with the major banks, and their larger share of lower-margin housing lending.
Footnotes
The authors are from Domestic Markets Department. [*]
For more information on changes in the short-term funding composition of Australian banks, see RBA (2012a). [1]
For further details on the buyback of government-guaranteed securities, see RBA (2013). [2]
For further details on covered bonds, see RBA (2012b). [3]
The onset of the global financial crisis saw a trend for bond issuance to occur at shorter terms. This reflected both supply and demand factors, with investors less willing to fund banks for an extended period and issuers preferring to borrow at shorter terms to avoid locking in high spreads for an extended period. For further details, see Black, Brassil and Hack (2010). [4]
The Reserve Bank uses a wide range of information to make the estimates presented in this article. It supplements the analysis with detailed discussions with financial institutions. [5]
The monthly retail deposit and investment rates published by the RBA (Statistical Table F4) are based on banks' advertised deposit rates, which do not include these premiums. [6]
Bonus saver accounts are those at-call savings accounts where the bank offers a bonus rate of interest to customers who meet certain conditions on deposits and/or withdrawals over a given period. [7]
References
Black S, A Brassil and M Hack (2010), ‘Recent Trends in Australian Banks' Bond Issuance’, RBA Bulletin, March, pp 27–33.
Deans C and C Stewart (2012), ‘Banks' Funding Costs and Lending Rates’, RBA Bulletin, March, pp 37–43.
Fabbro D and M Hack (2011), ‘The Effects of Funding Costs and Risk on Banks' Lending Rates’, RBA Bulletin, March, pp 35–41.
RBA (Reserve Bank of Australia) (2012a), ‘Box A: Funding Composition of Banks in Australia’, Financial Stability Review, September, pp 33–36.
RBA (2012b), ‘Box D: Covered Bond Issuance by Australian Banks’, Statement on Monetary Policy, February, pp 57–58.
RBA (2013), ‘Box D: Buybacks of Government Guaranteed Securities’, Statement on Monetary Policy, February, pp 54–55.