Bulletin – March 2013 Australian Economy Changes to the RBA Index of Commodity Prices: 2013
- Download the article 1.21MB
Abstract
This article summarises changes to be made to the RBA Index of Commodity Prices (ICP). In line with developments in export values over recent years, the weight of iron ore in the index will increase, while the weights for coal, gold and base metals will be reduced. Overall, these changes will result in minimal revisions to the ICP. Given the greater attention being paid to bulk commodities in economic assessments, the Bank will publish additional indices that will capture movements in the spot prices and average export prices of these commodities.
Introduction
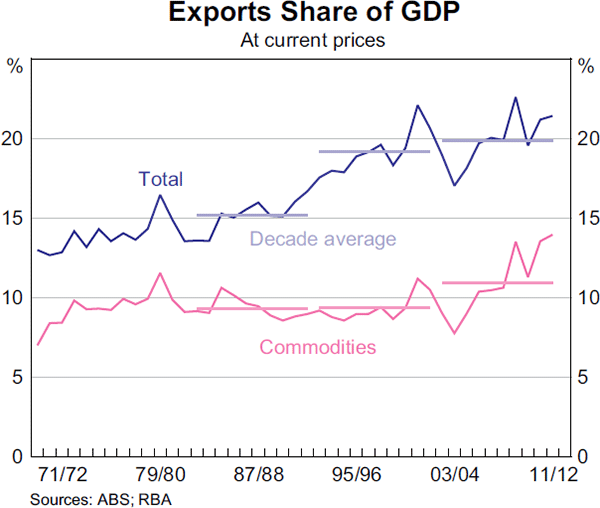
Commodity exports are an important source of income for the Australian economy. Over the past decade, commodity exports have on average accounted for more than 55 per cent of total export values and 11 per cent of GDP, well above the levels over the preceding decade (Graph 1). Because changes in export prices explain approximately three-quarters of the fluctuations in the growth of export values since 1990, developments in export prices can have a significant impact on export earnings and economic activity in Australia.
The ICP is intended to provide a timely indicator of the prices received by Australian commodity exporters. The ICP is a Laspeyres index, which means that it is a weighted average of recent changes in commodity prices, where the weight given to each commodity reflects its importance in total commodity export values in a base period.[1] The Bank periodically updates the base-period weights to maintain their relevance. In addition, the Bank also reviews the index to ensure that the commodities that are of importance to the Australian export market are included and that the price measures used for these commodities are appropriate.
Bank staff have recently completed such a review, updating the review conducted in 2009.[2] Commencing with the release of the index for March on Monday, 1 April 2013, the following changes will be made to the ICP:
- the index will be reweighted according to an average of export values in 2010/11 and 2011/12
- the index will be rebased so that the 2011/12 average is 100 (previously it was 2008/09)
- the price measure for crude oil will be changed from Tapis to Brent
- copper ore and lamb prices will be added and milk powder will be removed from the index.
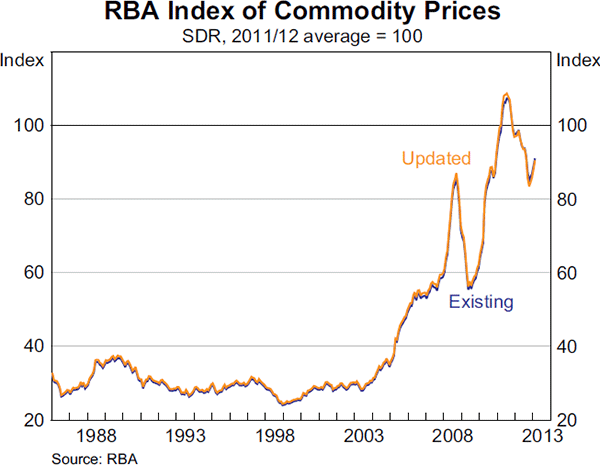
The index will be revised back to July 1982 incorporating these changes (Graph 2). The updated ICP will include 21 major commodities presently exported by Australia; these accounted for over 90 per cent of Australia's commodity export earnings in 2011/12. The relative importance of some commodities included in the index has changed and this has also resulted in revisions to the index. The effect of the revisions on the overall index is minor. The ICP continues to reflect the sharp run-up in commodity prices from 2004, peaking in 2011 and declining subsequently.
Reflecting the relative importance of bulk commodity exports to the Australian economy, the Bank will commence publishing an additional ICP based on spot price movements for the bulk commodities (namely iron ore, metallurgical coal and thermal coal). The Bank will also publish two bulk commodity subindices: one using the spot price movements for these commodities; and the other using their average export price movements. These subindices are described further below.
Reweighting and Rebasing the ICP
The updated weights for the ICP, shown in Table 1, are based on average export values in 2010/11 and 2011/12. The rationale for selecting two years of data for the weights calculation is to lessen the effect of temporary changes in export values on the ICP (e.g. resulting from extreme weather conditions). This approach is consistent with that used by the Australian Bureau of Statistics (ABS) in the calculation of its Export Price Index (ABS 2011).
| ICP weights(a) | Change(b) 2008/09 to 2010/11–2011/12 | |||
|---|---|---|---|---|
| Existing (2008/09) |
Updated (2010/11–2011/12) |
Price(c) | Volume(d) | |
| Rural commodities(e) | 10.3 | 10.9 | 7 | 19 |
| Wool | 1.1 | 1.4 | 46 | −4 |
| Beef and veal | 3.2 | 2.5 | −3 | −2 |
| Wheat | 3.2 | 3.2 | −18 | 50 |
| Barley | 0.6 | 0.7 | −10 | 44 |
| Canola | 0.4 | 0.6 | 4 | 95 |
| Sugar | 0.7 | 0.7 | 49 | 14 |
| Cotton | 0.3 | 1.1 | 54 | 189 |
| Milk powder | 0.8 | na | 4 | −9 |
| Lamb and mutton | na | 0.8 | 20 | −14 |
| Base metals(e) | 6.8 | 5.8 | 7 | −7 |
| Aluminium | 3.4 | 2.4 | −9 | −2 |
| Lead | 0.6 | 0.5 | 16 | −16 |
| Copper | 1.8 | 2.1 | 29 | 8 |
| Zinc | 0.6 | 0.5 | 13 | −4 |
| Nickel | 0.4 | 0.3 | 22 | −19 |
| Bulk commodities(e) | 56.5 | 57.5 | −5 | 22 |
| Iron ore | 21.8 | 32.7 | 29 | 33 |
| Metallurgical coal | 23.3 | 16.4 | −28 | 14 |
| Thermal coal | 11.4 | 8.4 | −22 | 10 |
| Other resources(e) | 26.4 | 25.8 | 9 | 0 |
| LNG(e) | 6.5 | 6.0 | −5 | 16 |
| Crude oil | 5.3 | 6.0 | 16 | 11 |
| Alumina | 3.8 | 2.9 | −13 | −2 |
| Gold | 10.8 | 8.0 | 27 | −31 |
| Copper ore | na | 2.8 | 48 | −1 |
| Total(e) | 100.0 | 100.0 | 0 | 14 |
|
(a) Commodity weights may not sum to subindex weights due to rounding Sources: ABARES; ABS; RBA |
||||
The bulk commodities have experienced the largest changes in their relative importance in the index since 2008/09. The weight for iron ore has increased significantly over recent years, reflecting a sharp increase in both the price of iron ore and the volumes of iron ore exports. The decline in the weights for metallurgical coal and thermal coal largely reflects falls in their prices. Other notable changes include a decline in the weight of gold (due to a fall in its export volumes, which more than offsets the increase in its price). The weight for the base metals included in the ICP has also fallen, while those for the rural commodities which are included in the index have increased slightly.
Changes to the Price Measures Included in the Index
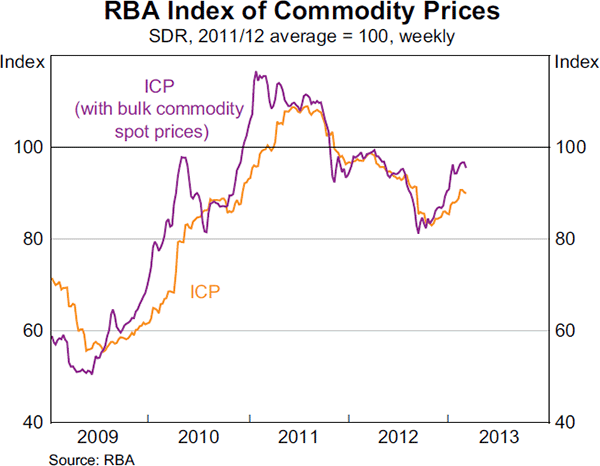
The prices included in the existing ICP for the bulk commodities are based on average export prices data from the ABS, which are a weighted average of the spot and contract prices. Average export prices also reflect variations in the quality of commodities exported, whereas spot and contract prices hold quality fixed; for example, a widely used spot price for iron ore is based on an iron content of 62 per cent. While the average export price is appropriate for measuring the actual prices received by Australian exporters, in recent years spot prices have become more relevant as Australian bulk commodity exporters have moved away from longer-term contract pricing arrangements to shorter-term arrangements, particularly for iron ore (RBA 2012). Average export prices may also be revised over time as more information about recent transactions becomes available to the ABS.[3] Consequently, in conjunction with the current ICP, the Bank will publish an additional index of commodity prices, which uses spot prices for the bulk commodities, commencing from January 2009 (Graph 3). This series generally moves closely with the current ICP, particularly since 2011, when shorter-term pricing arrangements became more prevalent. Nevertheless, there can still be periods of divergence, such as since late 2012, owing to the spot price for iron ore increasing more strongly than the average export price.
The measure of crude oil prices that has been used in the existing ICP is the Malaysian Tapis. Over recent years there has been a gradual shift away from using Tapis as an oil price benchmark in the Asia-Pacific region towards using Brent, which is also widely used as a benchmark globally (Dunn and Holloway 2012). In line with this trend, Brent crude oil will replace Tapis in the updated ICP from July 2010. Brent and Tapis crude oil move together quite closely, so there will be very little effect from this change on the ICP.
Details of the price measures used in the ICP are available in Appendix A.
New Subindices for Bulk Commodities
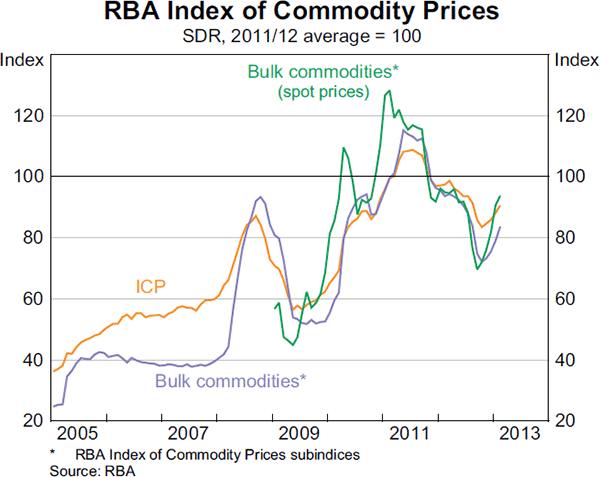
The share of the value of commodity exports accounted for by iron ore and coal has increased from 23 per cent in 2001/02 to 54 per cent in 2011/12; consequently the weight for the bulk commodities has also increased in the ICP. Reflecting the significance of the bulk commodities to Australian exports, two bulk commodity subindices will be published from April. One subindex is based on average export price movements since July 1982 (Graph 4). The other subindex is based on spot price movements from January 2009.
Changes to the Coverage of the Index
The Bank regularly reviews the composition of the ICP to ensure that it covers the major commodities exported by Australia. An input in determining whether a commodity is to be included in the ICP is its share of the total value of Australian commodity exports.
Australia exports a diverse range of metal ores and minerals. The value of copper ore exports has grown rapidly in recent years and it is now one of Australia's top 10 exported commodities. Given its increased importance, the copper ore price, using average export price data from the ABS, will be included in the index (Graph 5).
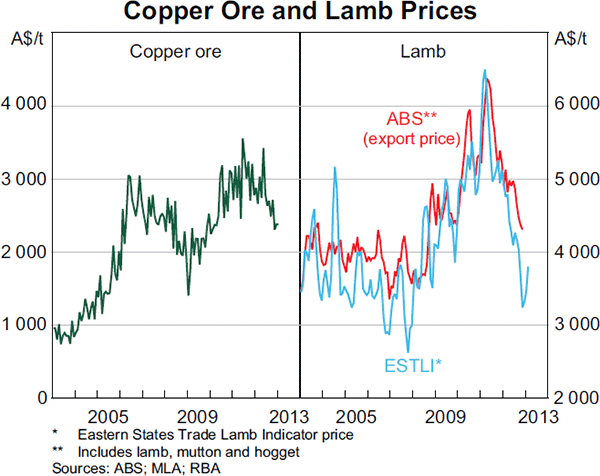
Lamb prices will also be added to the index. Over the past five years, the value of lamb and mutton exports has accounted for around 5 per cent of rural export receipts (lamb represents a large and increasing share of this category). The price of lamb to be used in the index is the daily Eastern States Trade Lamb Indicator (ESTLI) available from Meat and Livestock Australia (MLA). This is a timely benchmark price for Australian lamb and has similar trends over time to the ABS export price data. Lamb prices will also be included in the rural subindex.
The value of milk powder exports as a share of commodity exports has declined in recent years and now accounts for less than ½ per cent of the value of commodity exports. Consequently, milk powder will be excluded from the index.
Future Updates to the ICP
To maintain the relevance of the weights of the commodities included in the ICP, the Bank intends to update the ICP weights annually. This will be conducted in the March quarter of each year, and the updated weights will be published on the Bank's website. The weights will be calculated using export values in the preceding two financial years. The commodities included in the ICP will be reviewed approximately every five years.
Appendix A
| Commodity | Sources | Data description |
|---|---|---|
| Rural commodities | ||
| Wool | Australian Wool Exchange | National Price |
| Beef and veal | MLA | Average of beef prices to the United States and Japan |
| Wheat | ABARES | US Gulf price; HRW No 1 |
| Barley | Confidential | |
| Canola | Bloomberg | Canada Par Region |
| Sugar | Bloomberg | Sugar No.11 ICE |
| Cotton | Bloomberg | Cotlook A Index |
| Lamb | MLA | Eastern States Trade Lamb Indicator |
| Base metals | ||
| Aluminium | Bloomberg | London Metal Exchange (LME) spot price |
| Lead | Bloomberg | LME spot price |
| Copper | Bloomberg | LME spot price |
| Zinc | Bloomberg | LME spot price |
| Nickel | Bloomberg | LME spot price |
| Bulk commodities | ||
| Iron ore | ABS | Average export price |
| Bloomberg | Spot price – 62 per cent Fe Chinese landed price, adjusted for freight | |
| Metallurgical coal | ABS | Average export price |
| Energy Publishing | Spot price – Queensland premium hard metallurgical coal | |
| Thermal coal | ABS | Average export price |
| Thomson Reuters | Spot price – Newcastle thermal coal | |
| Other resources | ||
| LNG | Confidential | |
| Crude oil | Bloomberg | European Brent Blend |
| Alumina | ABS | Average export price |
| Gold | Bloomberg | Spot price |
| Copper ore | ABS | Average export price |
|
Source: RBA |
||
Footnotes
The authors are from Economic Analysis Department. [*]
For a detailed discussion of the construction of the ICP, see RBA (1998). [1]
See Noone and Park (2009) for details. [2]
The Bank makes preliminary estimates on the average export prices of iron ore, metallurgical coal and thermal coal based on spot prices and other market information before the actual data are available from the ABS. For further discussion, see Noone and Park (2009). [3]
References
ABS (Australian Bureau of Statistics) (2011), ‘Information Paper: Review of the Producer and International Trade Price Indexes’, ABS Cat No 6427.0.55.003.
Dunn S and J Holloway (2012), ‘The Pricing of Crude Oil’, RBA Bulletin, September, pp 65–74.
Noone C and A Park (2009), ‘Updating the RBA's Index of Commodity Prices’, RBA Bulletin, October, pp 13–17.
RBA (Reserve Bank of Australia) (1998), ‘Modifications to the Reserve Bank of Australia's Commodity Price Index’, RBA Bulletin, September, pp 1–4.
RBA (2012), ‘Box B: Iron Ore Pricing’, Statement on Monetary Policy, August, pp 15–16.