Bulletin – March 2011 Domestic Demand Growth in Emerging Asia
- Download the article 153KB
Abstract
Domestic demand has grown rapidly in emerging Asia for much of the past 30 years. As a consequence, its contribution to annual global growth has gradually increased, rising from ¼ percentage point in the early 1980s to almost 1 percentage point in recent years. Most of this increased contribution reflects strong growth in China and India, with around half arising from the expansion of household consumption and half from the increase in investment in these countries. Looking ahead, the contribution of domestic demand in emerging Asia to global growth is likely to continue to rise, underpinning Australia's resource export prospects.
Introduction
The expansion of domestic demand in emerging Asia has been a key driver of the region's overall growth for several decades. This article outlines the pace of domestic demand growth using recently updated annual national accounts data published by the United Nations that are comparable across a range of countries. It also discusses trends in household consumption and investment that lie behind this performance, the contribution of domestic demand growth in emerging Asia to global growth, and the outlook.
Domestic Demand and its Components
Domestic demand in the emerging Asia region has grown strongly, averaging 7 per cent a year over the past three decades.[1] The pace of growth has varied across the region. In China, domestic demand growth has been especially strong, averaging around 10 per cent in each of the past three decades. In India, domestic demand growth was initially less rapid – fluctuating around 6 per cent a year in the 1980s and 1990s – but its pace then picked up noticeably in response to the reforms introduced during the 1990s. In the rest of emerging Asia, domestic demand growth has been a little more moderate, and has been gradually declining over time (Graph 1).
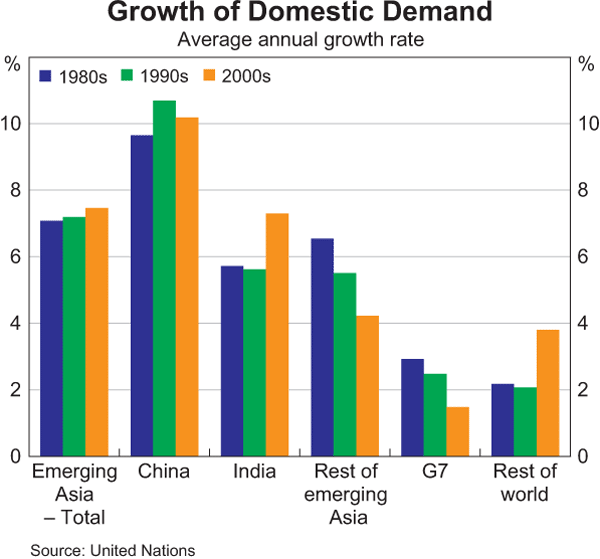
The pace of domestic demand growth in emerging Asia has consistently been much stronger than in many other regions of the world. This comparison is most noticeable for the G7 group of advanced economies, where annual growth of domestic demand has averaged around 2 per cent a year, with growth slowing over the past three decades. Growth in other regions of the world has also been lower than in the emerging Asia region.[2]
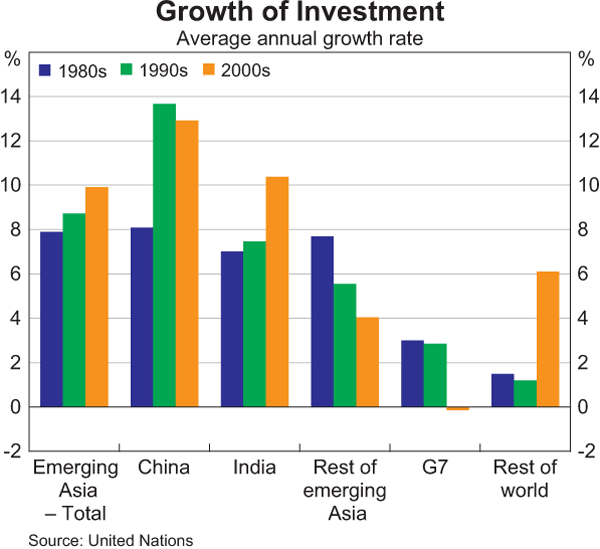
Turning to the main components of domestic demand, investment has grown especially rapidly in emerging Asia, much of it focused on housing and infrastructure. For the region as a whole, annual growth in investment spending averaged close to 9 per cent over the past three decades, and has been rising through time (Graph 2). The pace has varied somewhat between countries. At almost 11 per cent, the fastest average rate was recorded in China, with investment spending especially rapid in the 1990s and 2000s. India's average growth in investment spending was somewhat lower, at 8 per cent a year, although its pace has also picked up in recent years. Investment spending has been more moderate in the rest of emerging Asia and its pace has slowed over time. Compared with emerging Asia, investment spending has been a much smaller driver of economic growth in the G7 countries, and has declined significantly in recent years in the wake of the global financial crisis. Investment spending picked up sharply in the rest of the world in the 2000s reflecting strong growth in other emerging regions, including the recovery in the countries of the former Soviet Union after sharp declines in their output in the early 1990s.
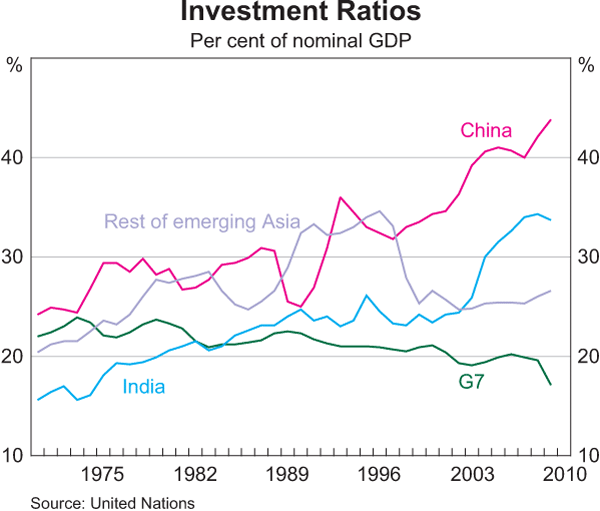
The rapid pace of investment growth in emerging Asia has underpinned large increases in the region's investment to GDP ratio. Aggregate investment has increased from around 26 per cent of nominal GDP in the early 1980s to 37 per cent of GDP in recent years. Until the late 1990s, the investment ratios in China and the rest of emerging Asia were increasing at around the same rate (Graph 3). However, after the Asian financial crisis, the investment to GDP ratio in the latter group of countries fell back while that in China continued to rise strongly. At 44 per cent of GDP, the investment to GDP ratio in China has reached historically high levels. In India, the investment ratio has also increased strongly of late, rising by 10 percentage points of GDP in just the last decade. However, at around 34 per cent of GDP, India's investment to GDP ratio is still far below that in China. In contrast, the investment ratio in the G7 countries has been a lower share of GDP and has declined over time.
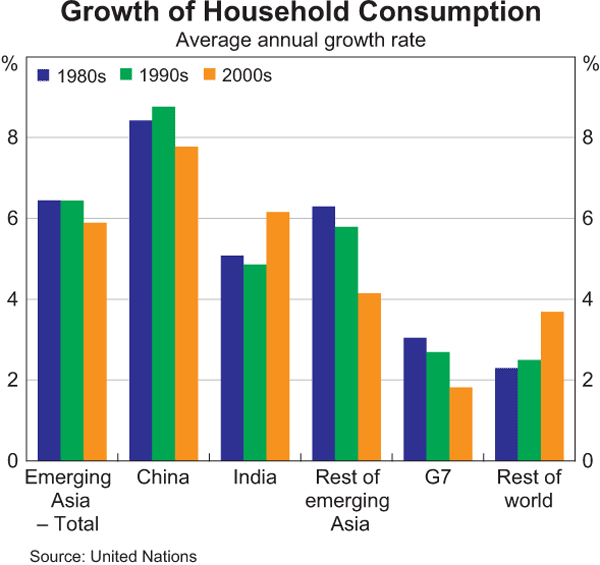
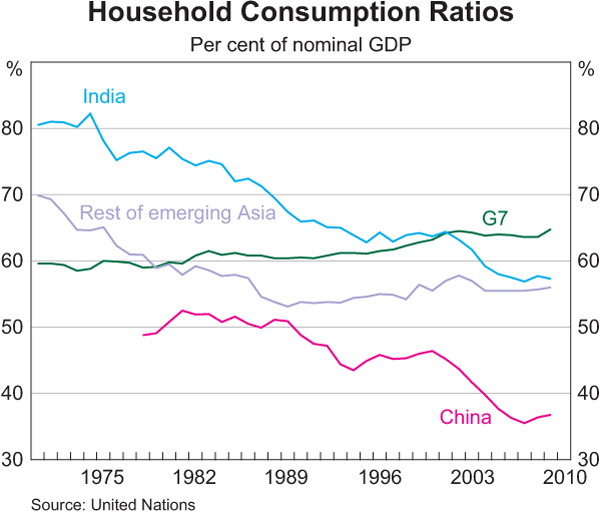
Compared with the pace of investment spending in the region, household consumption growth in emerging Asia has been more moderate, though still quite rapid by the standards of the rest of the world. Household consumption growth in emerging Asia averaged 6 per cent a year over the past three decades, more than double the pace of the G7 countries (Graph 4). At 8 per cent, average annual household consumption growth in China was the highest of the countries studied here – and has been quite stable over time – while growth in India and the rest of Asia averaged around 5 per cent a year.
While household consumption in China and India in particular has expanded at a solid rate for many decades, it has lagged that of overall GDP given the rapid growth in investment spending in these countries. As a consequence, household consumption to GDP ratios in China and India have declined, falling by around 15 percentage points over the past two decades, before stabilising in recent years (Graph 5). In contrast, household consumption has remained a significant driver of overall domestic demand growth in the G7. Its share has increased over time to over 60 per cent of nominal GDP, driven in particular by developments in the United States.
Contribution of Domestic Demand to Global Growth
The rapid growth in domestic demand in emerging Asia compared with that in other regions of the world has led to an increase over time in its contribution to global growth. In the 1980s, the share of emerging Asia in total global output was small, so despite rapid growth in domestic demand, its contribution to global growth remained low. However, as the economies of this region expanded, the contribution of their domestic demand growth to total global growth increased over time, rising steadily from ¼ percentage point in the early 1980s to average almost 1 percentage point in the past three years (Graph 6). In contrast, the contribution from the G7 countries to global growth has fallen over time. Indeed, the expansion of domestic demand in emerging Asia has accounted for most of the global growth in recent years, reflecting the impact of the global financial crisis on the G7 economies.
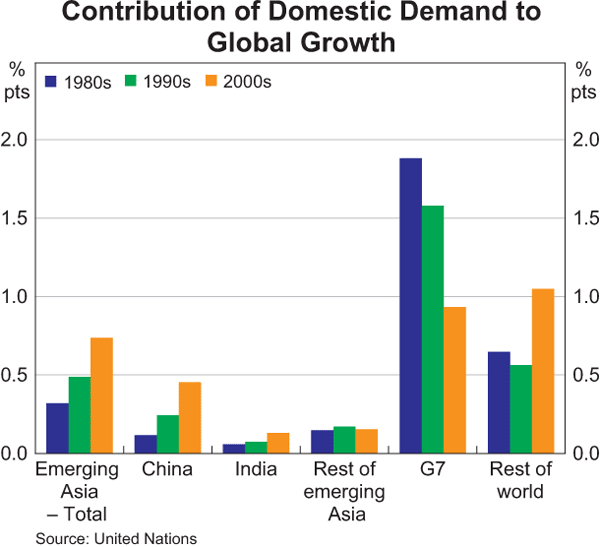
Almost all of the increase in the contribution of emerging Asia's domestic demand to global growth reflects the rapid growth in China and India. China accounted for over two-thirds of the increase and India comprised most of the balance. These contributions were split roughly equally between growth in investment and household consumption in these countries; while investment spending in China and India grew more rapidly than consumption, the size of its contribution to domestic demand growth was contained by its initially smaller share in total GDP.
Looking Ahead
Despite the rapid growth seen in recent decades, comparisons of investment and consumption indicators in emerging Asia with other countries suggest there is considerable scope for further increases in the region's domestic demand. While there could be set-backs and delays along the way, the current investment levels in emerging Asia compared with those in the G7 countries suggest there is significant scope for this region (and other emerging regions) to ‘catch up’ to the production and productivity frontiers. Housing and public infrastructure needs alone are likely to be at the forefront of economic development in China and India. These factors could see investment continuing to expand strongly for some decades yet, which would underpin further increases in the contribution of the emerging Asia region's investment spending to global economic growth.
Household consumption in emerging Asia is also likely to be an important contributor to global growth. In China, India and the rest of emerging Asia, household consumption per capita is still well below that of the G7 countries. Assuming the pace of household consumption growth in emerging Asia continues to grow more rapidly than other regions of the world, its contribution to global growth will continue to rise. Furthermore, the current low per capita consumption levels in China and India and the rapid development of these economies suggest that, with appropriate supporting policies, the pace of household consumption and its share in GDP could increase over time.[3] Should this occur, the expansion of domestic demand in emerging Asia will continue to have a significant impact on Australia's resource export potential.
Footnotes
The author is from Economic Analysis Department. [*]
The data are available from 1970 to 2009. The real expenditure data are converted to US dollars based on market exchange rates in 2005. Using these data, ‘Emerging Asia’ in this article is defined as China, India, Hong Kong, South Korea, Singapore, Indonesia, Malaysia, the Philippines and Thailand. The investment data cited here refer to fixed asset investment; changes in inventories are excluded from the estimates of domestic demand. [1]
Very little of this reflects differences in population growth rates. China's population increased at an annual average rate of 1 per cent, India 2 per cent, the rest of emerging Asia 1½ per cent, and the G7 countries by 1 per cent over 1980–2009. [2]
For further details, see Baker and Orsmond (2010). [3]
Reference
Baker M and D Orsmond (2010), ‘Household Consumption Trends in China’, RBA Bulletin, March, pp 13–17.