Bulletin – March 2011 The Iron Ore, Coal and Gas Sectors
- Download the article 248KB
Abstract
The industrialisation of Asia – particularly China and India – has led to a strong increase in global demand for key resource commodities. The associated sharp rise in the prices of these commodities has underpinned a significant increase in the levels of Australia's resource investment, production and exports over the past five years, especially for iron ore, coal and liquefied natural gas (LNG). This article outlines some key features and recent developments in these three commodity sectors within Australia.
Overview
Australia has abundant supplies of natural resources, including the second largest accessible reserves of iron ore in the world and the fifth largest reserves of black coal.[1] Known accessible deposits of these commodities are sufficient to sustain Australia's current production levels for many decades, and ongoing exploration and technological advances could increase supply even further (Table 1). In addition, while small in terms of total global supply, Australia has significant natural gas reserves that can also be used as an energy source.
| Unit | Reserves | Annual production | Years of production(a) |
Reserves as share of world Per cent | Production as share of world Per cent | |
|---|---|---|---|---|---|---|
| Iron ore | Gigatonnes | 28 | 0.39 | 71 | 17 | 17 |
| Black coal | Gigatonnes | 44 | 0.45 | 98 | 7 | 6 |
| Gas | Trillion m3 | 3 | 0.05 | 63 | 2 | 2 |
|
(a) Years of production at current production levels Sources: ABARES; Geoscience Australia |
||||||
With the rise in demand for commodities – notably by emerging Asian economies – the value of Australia's resource exports increased sharply between 2005 and 2010. Resource exports now stand at 57 per cent of Australia's total exports, having increased from 41 per cent in 2005, with iron ore the largest and coal the second largest export. In part, this reflects a sharp rise in global prices, which increased at an average annual rate of 23 per cent for iron ore and 8 per cent for coal over the same period (measured in Australian dollars). The pace of export volumes growth was lower, with iron ore exports growing at close to 10 per cent a year and coal exports growing at around half that rate (Table 2).[2]
| Average annual growth 2005–2010 |
Share of total (values) |
|||||
|---|---|---|---|---|---|---|
| Volumes | Prices | Values | 2005 | 2010 | ||
| Resources sector | 4.9 | 11.0 | 16.6 | 41.4 | 56.7 | |
| – Iron ore | 10.6 | 22.8 | 35.7 | 5.9 | 17.3 | |
| – Coking coal | 4.9 | 9.2 | 14.8 | 8.2 | 10.5 | |
| – Thermal coal | 5.6 | 7.7 | 13.8 | 3.8 | 4.6 | |
| – LNG | 10.2 | 10.5 | 21.8 | 1.9 | 3.3 | |
|
Sources: ABS; RBA |
||||||
In addition to being a large share of total exports, Australia is also a major supplier of these commodities to the global market. Australia is the world's largest exporter of iron ore and coking coal – accounting for over one-third and one-half of global export supply, respectively – and the second largest exporter of thermal coal (Table 3). Some other countries are larger producers of these commodities than Australia, but they typically consume the bulk of their domestic production and hence have a less significant role in the global resource export market. This is particularly noteworthy for China, which is the largest producer of coking and thermal coal and a significant producer of iron ore but also the largest global consumer of these commodities. Similarly, the United States and India are the second and third largest producers of thermal coal, but are significant consumers of their own coal as well.
| Producers | Consumers | Exporters | Importers | ||||
|---|---|---|---|---|---|---|---|
| Coking coal | |||||||
| China | 52 | China | 59 | Australia | 54 | Japan | 26 |
| Australia | 16 | Europe | 8 | Indonesia | 15 | Europe | 21 |
| Russia | 7 | India | 7 | United States | 13 | China | 17 |
| United States | 6 | Japan | 7 | Canada | 9 | India | 12 |
| Indonesia | 4 | Russia | 6 | Russia | 5 | South Korea | 10 |
| Thermal coal | |||||||
| China | 49 | China | 51 | Indonesia | 28 | Europe | 25 |
| United States | 17 | United States | 16 | Australia | 19 | Japan | 15 |
| India | 10 | India | 10 | Russia | 15 | China | 14 |
| South Africa | 5 | Europe | 5 | Colombia | 10 | South Korea | 11 |
| Indonesia | 5 | South Africa | 3 | South Africa | 9 | Taiwan | 8 |
| Iron ore(a) | |||||||
| Australia | 25 | China | 54 | Australia | 39 | China | 69 |
| Brazil | 19 | India | 9 | Brazil | 29 | Japan | 12 |
| India | 16 | Russia | 8 | India | 13 | Europe | 10 |
| China | 15 | Europe | 7 | South Africa | 5 | South Korea | 5 |
| Russia | 6 | Japan | 7 | Canada | 3 | Taiwan | 1 |
|
(a) Chinese production and consumption iron ore figures are adjusted to correspond to the world average iron content Sources: ABARES; AME Group; International Energy Agency; RBA |
|||||||
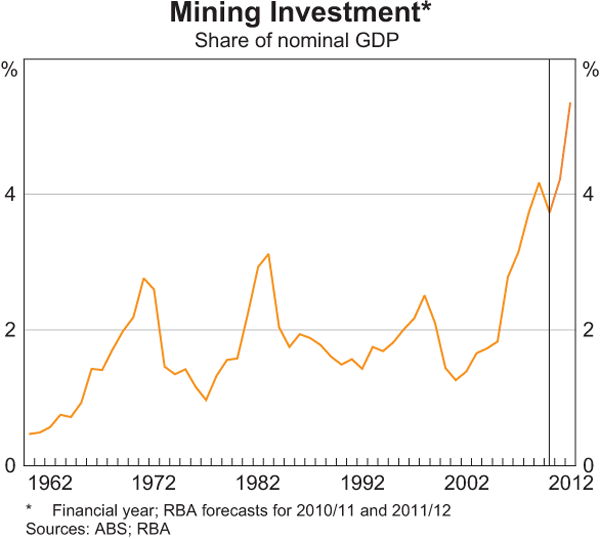
High global commodity prices and, more generally, the ongoing rapid growth in emerging Asian economies, have underpinned a large increase in mining investment in Australia. Mining investment has doubled – from around 2 per cent of GDP to 4 per cent of GDP – in just the past five or so years, with much of this increase driven by investment in the iron ore, coal and LNG sectors (Graph 1). Further significant investments in these sectors are expected in coming years, which will enable additional expansions of export capacity. These developments, as well as some key features of iron ore, coal and LNG production in Australia, are outlined in the rest of this article.
Iron Ore
Iron ore is a key input in the production of steel and occurs in two main forms – hematite which is red and has an iron ore content typically greater than 55 per cent, and magnetite which is black and has an iron ore content as low as 30 per cent. Up to now, all Australian commercial iron ore production has been hematite ore; while magnetite ore is the most abundant iron oxide in Australia, it requires more intensive processes to remove its impurities, which significantly increases production costs.
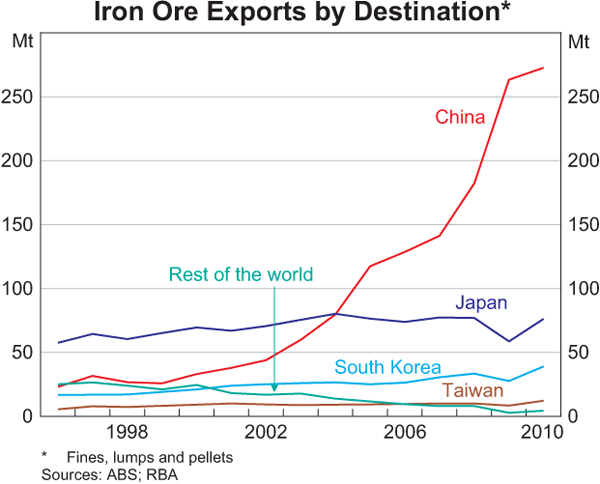
Western Australia accounts for 97 per cent of Australia's iron ore production, which is extracted from open-cut mines located mostly in the Pilbara region in the north west of the state. After being blasted off the working face, iron ore is crushed and screened to produce rock lumps (greater than 5 mm) or fines (less than 5 mm), and then transported to ports for shipping. Most of Australia's iron ore production is exported, predominantly to Asia. After rapid growth in the past decade, the main export market for Australia's iron ore is now China (almost 70 per cent of iron ore exports in 2010), with Japan and Korea importing most of the balance (Graph 2).
Projects operated by BHP Billiton and Rio Tinto account for over 80 per cent of Australia's iron ore production. Both producers have vertically integrated systems for mine, rail and port infrastructure. BHP Billiton exports from Port Hedland, while Rio Tinto exports from Dampier Port and Cape Lambert. Australia's third largest iron ore producer, Fortescue Metals Group (FMG), also operates in the Pilbara and exports iron ore from Port Hedland.
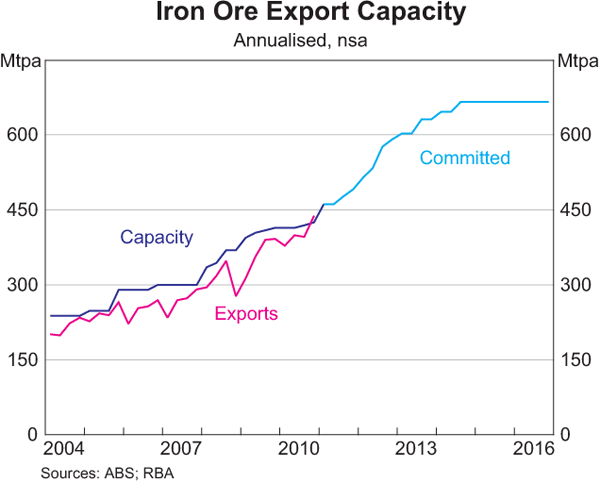
Iron ore companies have had significant expansion plans in place for several years. Much of BHP Billiton's Rapid Growth Project 4 has now been completed and Rapid Growth Project 5 is presently underway, which will increase the company's capacity to around 205 million tonnes per annum (mtpa) by late 2011. Rio Tinto and FMG have also recently committed additional mine and infrastructure expansions in the Pilbara. Rio Tinto committed expansions will raise its production capacity from 220 mtpa to an estimated 283 mtpa by 2013, while those of FMG will take production capacity from 55 mtpa to 155 mtpa. In addition, CITIC Pacific Mining is developing Australia's first magnetite mine, with upgrades to associated processing and transport infrastructure. Other proposed projects, mainly in the Pilbara and Mid West regions of Western Australia, are at various stages of planning and design. Overall, the investment projects already committed – which total around $35 billion – suggest that Australia's iron ore production and exports are likely to increase by around one-half over the next four years (Graph 3).
Coal
Black coal occurs in two main forms – thermal (or steaming) coal and coking (or metallurgical) coal.[3] Thermal coal is primarily used to generate electricity, including 80 per cent of Australia's electricity. Coking coal is mainly used in the production of steel; it is relatively scarce and hence attracts a higher price than thermal coal. The majority of Australia's black coal is of good quality, characterised by low ash and sulphur content. Almost all black coal production in Australia comes from New South Wales and Queensland. In New South Wales, black coal is mostly mined in the Hunter Valley. Mines in Queensland are more dispersed, though most are located in the Bowen Basin. In contrast to most global production, three-quarters of black coal in Australia is produced from open-cut mines, which generally enable a higher proportion of the coal deposit to be recovered compared with underground mining, thereby lowering production costs.
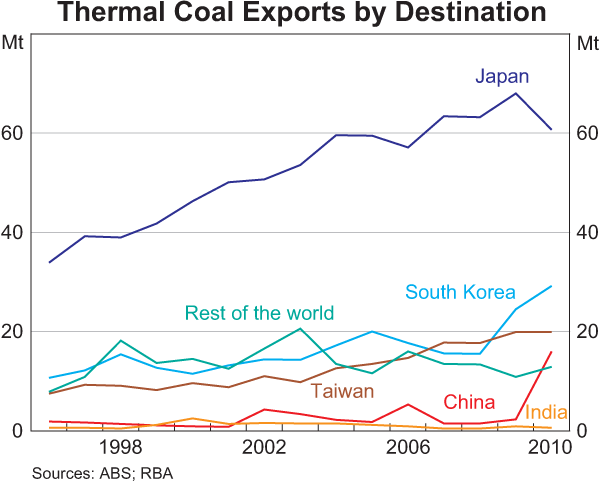
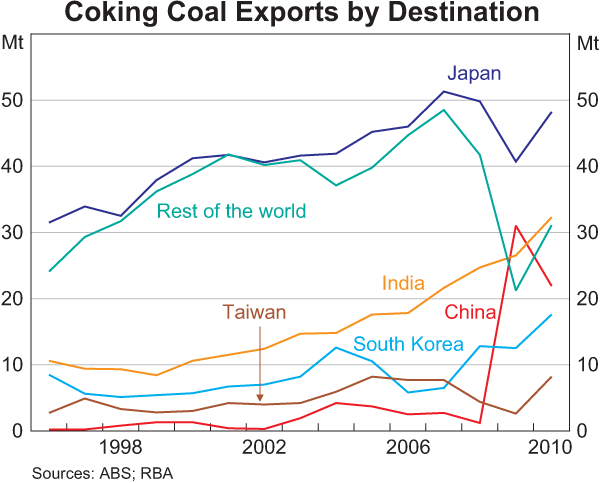
Around 80 per cent of Australia's black coal production is exported. Japan is the main export market (37 per cent of total coal exports in 2010), followed by Korea, China and India (Graphs 4 and 5). Most coal in Australia is transported by dedicated rail connections between mines and ports, and then shipped abroad in bulk carriers. In Queensland, coal is loaded at four ports – the Ports of Brisbane, Abbot Point (north of Mackay in Queensland), Gladstone and Hay Point. In New South Wales, coal is exported through Newcastle and Port Kembla.
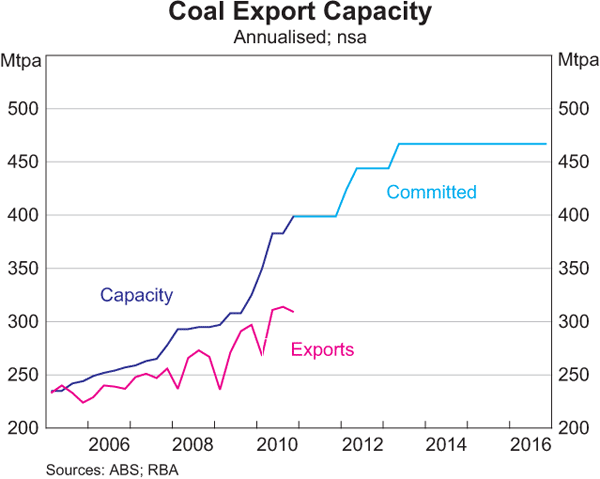
Like the iron ore sector, Australia's coal export capacity has expanded over the past five years following investments in both mine and infrastructure capacity. However, as noted earlier, the pace of volume growth has been comparatively low. In part this has reflected co-ordination difficulties among the various participants in the coal supply chain, especially in New South Wales, though there have been some recent steps to address these issues. In August 2009, the Hunter Valley Coal Chain Coordinator Limited was incorporated to plan and coordinate the daily operation and long-term capacity usage in that area. In addition, a new capacity framework arrangement was recently implemented in the Hunter Valley that requires producers to pay for their agreed infrastructure capacity regardless of their eventual usage. These new arrangements aim to better align incentives and remove obstacles to further capacity expansions.
Notwithstanding co-ordination issues, the ongoing high global coal prices have been an incentive to pursue several infrastructure projects across the eastern seaboard. These have included port expansions (in Newcastle and Abbot Point) as well as the rail networks that link the mines and ports (for example, the expansion of the rail network leading to Abbot Point). Several additional large port and rail expansions are also under consideration, and there are proposals for new mines in the Galilee Basin in Queensland. The mine and infrastructure expansions already under construction or committed – which total around $6 billion – suggest that coal export capacity will increase by around one-fifth over the next three years (Graph 6). There are also other possible projects being considered that would increase export capacity further.
Liquefied Natural Gas
While most of the world's natural gas production is supplied in gaseous form through large pipelines, natural gas can also be converted to a liquid. The conversion takes place in processing plants commonly referred to as ‘trains’ that remove impurities and condense gas volumes for easier transportation and storage. Although Australia holds less than 2 per cent of the world's known global reserves of natural gas, it is already the fourth largest producer of LNG after Qatar, Malaysia and Indonesia.
LNG can be produced from conventional and unconventional natural gas resources. Australia currently uses conventional gas resources from offshore fields for its LNG production. The gas is extracted by drilling rock formations that hold trapped reservoirs of natural gas. Two commonly known unconventional gas sources are coal seam methane (CSM) and shale gas. Recent technologies have improved the economics of extracting unconventional gas sources that can be used for LNG production.
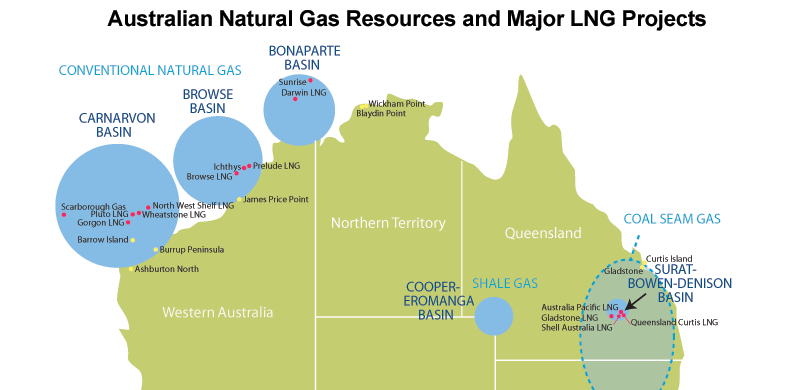
The largest proven gas reserves in Australia are located in the Carnarvon Basin in the north west of Western Australia (Figure 1). The Browse Basin and the Bonaparte Basin also have large reserves. In addition, there are large onshore unconventional reserves of CSM in the Surat and Bowen Basins that are of high purity.
Almost all of Australia's LNG production is exported to Asia. By far the largest export destination is Japan, which accounts for around 70 per cent of Australia's total LNG exports. China is Australia's second largest export destination following strong growth in export volumes, and its share of Australian LNG exports is expected to increase further in coming years.[4] LNG exports to India and Korea have also risen rapidly in recent years, albeit off a low base, and are expected to increase further.
Currently there are two operational LNG plants in Australia. The North West Shelf LNG project is Australia's biggest producing plant and accounts for over 80 per cent of Australia's total production. The onshore facility located in Karratha has been operational since 1989 and sources gas from various fields in the Carnarvon Basin, producing around 16 mtpa of LNG from five trains. The other plant is the Darwin LNG project, which commenced production of LNG in 2006. It sources gas from the Bonaparte Basin and exports from Wickham Point (near Darwin).
In addition to these existing operations, there are four LNG plants at various stages of construction. Most of the heavy construction work for the one-train Pluto Foundation Project has been completed (with production capacity of around 4 mtpa), and exports are expected to commence in late 2011. The Gorgon Project received investment approval in September 2009 and is one of the largest resource projects in Australian history. It involves the construction of three LNG trains with a total production capacity of 15 mtpa on Barrow Island, located around 65 kilometres off the Western Australian coast; first production is expected in 2014.
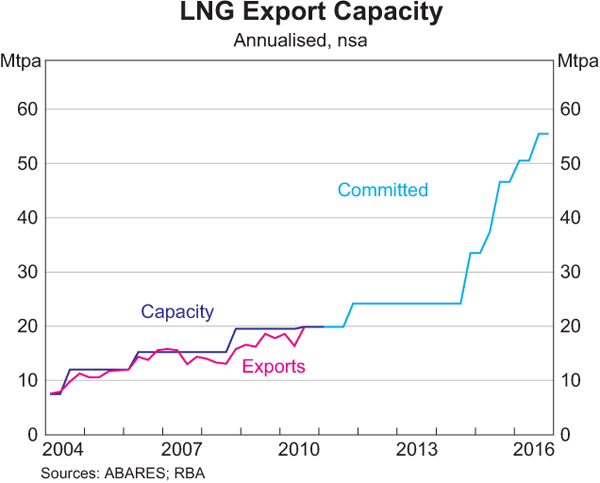
Following recent State and Federal environmental approvals, two CSM projects are also under construction, and will source gas from the Surat and Bowen Basins. The Queensland Curtis LNG Project was the first CSM project in the world to receive investment approval – in October 2010 – and will have production capacity of 8.5 mtpa from two trains, with production expected to start in 2014. In January 2011, the Gladstone LNG project received investment approval to build two trains with production capacity of almost 8 mtpa, with its first exports scheduled for 2015. A number of other large projects are at an advanced stage of consideration.[5] Overall, committed LNG investment totals around $72 billon, which is expected to take export capacity from 20 mtpa at present to more than 50 mtpa by 2016 (Graph 7). While projections about other projects are subject to considerable uncertainty, it is quite likely that LNG exports could expand further over coming years, and even start to approach coal and iron ore in terms of its contribution to Australia's total export earnings.[6]
Conclusion
The increased global demand for resources, notably from emerging Asia, is underpinning significant changes in Australia's resources sector. Export values have increased sharply, especially for iron ore, coal and LNG, as both global prices and volumes have increased. As a consequence, exports of these commodities now account for more than one-third of Australia's total exports. In response to the increase in global demand, many large investment projects have been initiated, that have boosted production capacity in Australia over the past five years or so. New projects either under construction or recently committed will see capacity expand significantly further, which will provide the opportunity for additional increases in resource export volumes for several years to come.
Footnotes
The authors are from Economic Analysis Department. [*]
Defined by Geoscience Australia as accessible economic demonstrated resources. Ukraine (18 per cent of global total) has the largest reserves of iron ore, while the four countries with larger reserves of black coal are the United States (31 per cent), Russia (22 per cent), China (14 per cent) and India (8 per cent). [1]
There are two main types of black coal – coking and thermal coal – the characteristics of which are outlined in a later section. [2]
Australia also has extensive reserves of brown coal, which are not exported but used for the production of electricity in Victoria. [3]
According to the International Energy Agency. [4]
Australia could also produce LNG from large-scale shale gas deposits in the Cooper-Eromanga basin, which borders Queensland and South Australia. Shale gas is found in sedimentary shale rocks, deep beneath the earth's surface. [5]
Australia also uses significant volumes of natural gas for domestic purposes, which are transported through domestic gas pipelines. [6]