Bulletin – June 2011 Global Commodity Markets – Price Volatility and Financialisation
- Download the article 559KB
Abstract
A significant increase in the level and volatility of many commodity prices over the past decade has led to a debate about what has driven these developments. A particular focus has been on the extent to which they have been driven by increased financial investment in commodity derivatives markets. This article examines the factors behind the increase in the level and volatility of commodity prices. The available evidence suggests that while financial investors can affect the short-run price dynamics for some commodities, the level and volatility of commodity prices appear to be primarily determined by fundamental factors.
Introduction
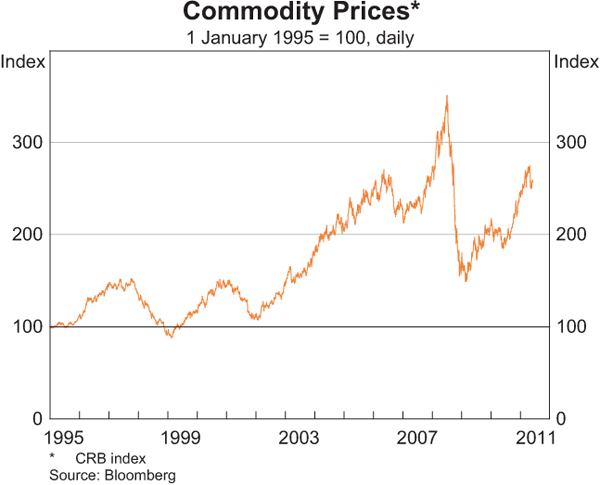
The past decade has witnessed a large increase in the prices of many commodities, despite significant falls during the global financial crisis (Graph 1). These increases have raised a number of concerns for policymakers, including the potential for rising commodity prices to feed into broader domestic inflation pressures, with some developing nations particularly concerned about rising food prices. The G-20 has committed to ‘work to address excessive commodity price volatility’, with a focus on the role played by the growing presence of financial investors in commodity markets. While speculators are present in commodity markets they do not appear to have contributed significantly to the level or volatility of prices except in the very short term. At this stage, the available evidence suggests that fundamental factors are the main determinants of commodity prices.
Fundamental Drivers of Recent Commodity Prices
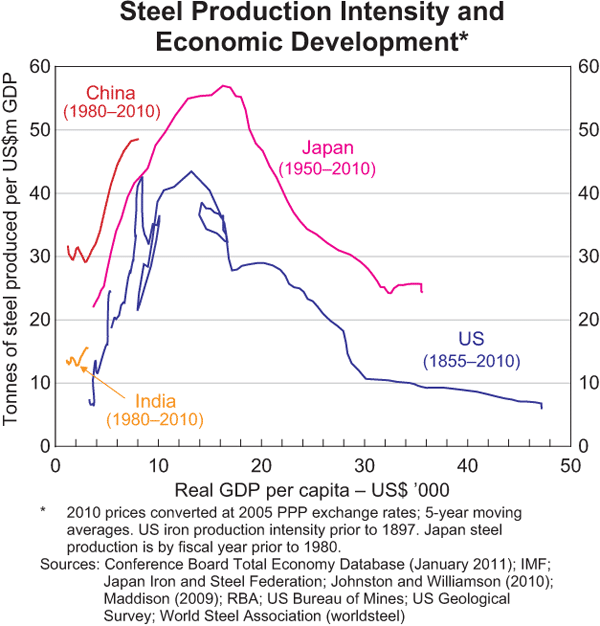
The substantial increase in commodity prices over the past decade has been supported by a number of fundamental drivers. One of the most significant has been the shift in the composition of global growth over this period, as emerging market economies – particularly China – have come to prominence as the engines of world growth. Since these emerging market economies are generally at a relatively commodity-intensive stage of development, there has been a corresponding shift in global demand towards commodities as these countries industrialise and expand their infrastructure (Graph 2). Food prices have also been affected by economic development, with the composition and volume of food intake changing as per capita income in these economies rises, generally resulting in a shift away from grains towards higher protein foods such as livestock and dairy, which have high resource footprints.[1] These trends are likely to continue for some years.
At the same time, supply has struggled to keep pace with the unexpectedly rapid rise in emerging market demand over the past decade. Relatively low and falling real commodity prices throughout the 1980s and 1990s resulted in low levels of investment in production capacity for some commodities. Given the long lead time to bring new production online for many commodities – such as the time to undertake mineral exploration and subsequently build a new mine – prices have increased substantially in order to clear the market, prompting a pick-up in investment.
Weather-related disturbances – droughts, floods, cyclones – in some key producer countries have also boosted the prices of a number of agricultural commodities over recent years. The imposition of export bans (often in response to food security concerns) has further contributed to global supply shortages of some food stocks at times. In addition, accidents and natural disasters have periodically reduced output at mines, including for copper and coal.
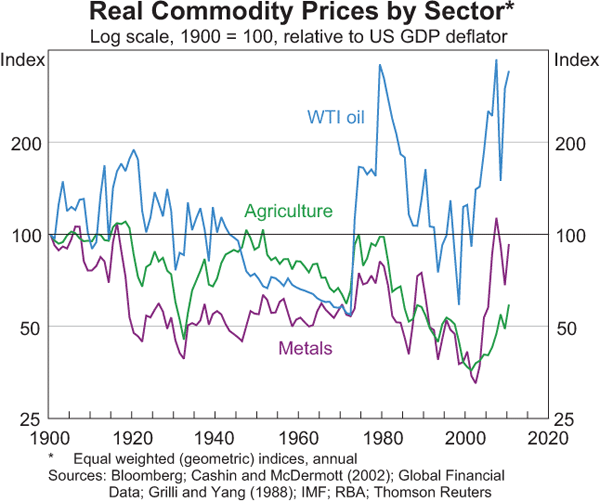
To place the recent price movements in a historical perspective, such a sharp increase in real commodity prices has not been seen since the 1970s (Graph 3). Following the 1970s episode, real commodity prices fell for most of the subsequent two decades. While oil and metals prices are quite high in real terms by historical standards, regaining or exceeding their levels of 40 years ago, real agricultural prices remain well below their previous peaks.
Commodity Price Volatility
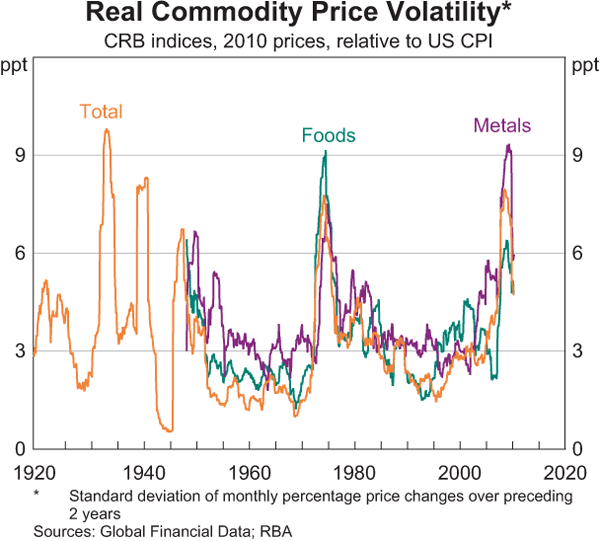
The recent increase in the level of commodity prices has been accompanied by a significant rise in the volatility of commodity prices (Graph 4). While price signals play an important role in boosting future supply and allocating existing supply, volatility in prices can hinder this process by generating uncertainty about future price levels. The primary focus of this article is on price volatility occurring over a period of months or longer, as this is the frequency at which it can materially affect firms' investment and production decisions. Shorter-term volatility is not inconsequential, however, as it can cause disruption within financial markets.
The recent increase in commodity price volatility raises two related questions: how does commodity price volatility typically compare to that of other prices? And how unusual is the current level of commodity price volatility?[2]
Starting with the first question, commodity prices do tend to be more volatile than many other prices in the economy because in the short term both global supply and demand for commodities are relatively price inelastic. For example, increasing the level of production takes time if new crops must be grown, mineral exploration undertaken or new mines built. Similarly, it can take considerable time to change consumption habits, such as shifting from coal-fired electricity generation to gas, or altering the share of more fuel efficient cars in the outstanding stock of automobiles. This sluggish response means that supply and demand shocks, due to weather events or natural disasters for example, can result in large price movements in order to clear the market.
The higher volatility of some commodity prices is also related to the fact that many commodities are traded in transparent, continuously priced markets – in contrast to many other goods and services. These commodity prices can thus reflect news and changes in economic (and financial) conditions more quickly than do consumer prices, which manifests as higher average volatility.
Commodity prices are sometimes considered to be even more volatile than other prices that adjust on a daily basis, such as financial prices. However, this is generally the result of comparing the prices of individual commodities to broad-based indices of certain asset classes. For example, the volatility of broad commodity indices is similar to that of broad equity indices, while the volatility of prices for individual commodities tends to be around that for individual share prices (Table 1).
| Jan 90–Jun 07 | Jul 07–May 11 | |
|---|---|---|
| Individual prices | ||
| Natural gas | 3.6 | 3.5 |
| WTI oil | 2.3 | 2.9 |
| Sugar | 2.1 | 2.7 |
| Rice | 1.7 | 1.8 |
| Wheat | 1.6 | 2.6 |
| Copper | 1.4 | 2.2 |
| Soybeans | 1.3 | 1.9 |
| Gold | 0.9 | 1.4 |
| Individual S&P 500 companies (average volatility) |
2.4 | 2.8 |
| Commodity and financial indices | ||
| S&P 500 energy index | 1.2 | 2.3 |
| Goldman Sachs Commodity Index |
1.2 | 1.9 |
| S&P 500 index | 1.0 | 1.7 |
| CRB index | 0.9 | 1.5 |
| US$ per A$ | 0.6 | 1.2 |
|
Sources: Bloomberg; RBA |
||
While commodity prices can be expected to be volatile relative to some other prices, commodity price volatility has recently been quite high relative to history at both an aggregate and sector level. The proximate cause of this heightened volatility was the global financial crisis, which saw very large falls and subsequent recoveries in a number of commodity prices, in line with large swings in actual and expected global demand through this period. This degree of commodity price volatility is, however, similar to that witnessed during other periods of large global shocks such as the Great Depression and the 1970s (Graph 4).
Financial Investment in Commodities
It has been suggested that, in addition to fundamental supply and demand factors, the activity of speculators in financial markets may have played a significant role in contributing to the increase in the level and volatility of some commodity prices in recent years. This section describes the growing presence of financial investors in commodity derivative markets, while the next section examines the evidence of the effect of this growth on observed commodity price dynamics over the past decade.
Financial markets provide a useful complement to physical commodity markets because they allow consumers and producers to hedge their exposures to movements in commodity prices. These markets exist precisely because prices can be volatile, and allow uncertainty about future price movements to be managed. For example, a farmer could purchase a forward contract at the time of planting a crop, to give certainty about the price that will be received upon harvest. Financial investors provide additional liquidity to these markets, and can improve price discovery.
In theory, there should be a relationship between futures prices and spot prices determined by the ‘cost of carry’. This is the opportunity cost of buying and holding a good or financial instrument versus purchasing a futures contract for delivery in the future. In the case of commodities, holding a physical commodity can incur large storage costs, complicating the ability of arbitrage to maintain the relationship. To the extent that such a relationship does hold, any increase in volatility in futures markets could lead to greater volatility in the spot market. However, the relationship also means that if supply and demand factors underpin the spot price, the futures price will be unable to significantly deviate from this fundamental price for an extended period of time.
Over the past decade, regulatory changes and the development of new financial products have allowed financial investors – who do not have a commercial exposure they need to hedge – greater access to commodity futures markets. Demand from investors has been strong, with the ‘search for yield’ prevalent in financial markets making commodities an appealing investment option. Additionally, influential research by Gorton and Rouwenhorst (2006) highlighted the diversification benefits of including commodities in a portfolio.[3] Some recent surveys of market participants have indicated that desire for return and diversification benefits remain the two key motivations for commodity investment.[4]
Reflecting these incentives, financial investment in commodities has grown rapidly, with assets under management approaching US$410 billion in the first quarter of 2011 (Graph 5). Most of the early investment in commodities was through broad-based commodity index funds, which use derivatives contracts to replicate the return of a specific commodity index, such as the Goldman Sachs Commodity Index. The majority of investment in recent years has been concentrated in exchange-traded products (ETPs) tracking commodities.[5] Almost all non-precious metal commodity ETPs use derivatives to give investors an exposure to commodities, with only a few holding the physical commodities. The analysis here focuses on investors' activities in commodity derivative markets.
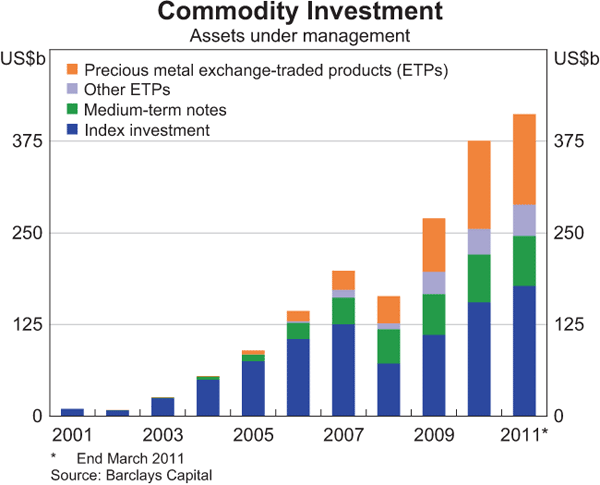
Although a large share of ETPs track precious metals – particularly gold and, to a lesser extent, silver – these commodities have long been considered financial products and subject to speculative activity. Precious metal ETPs buy and store the underlying physical commodity, providing an obvious mechanism for investment to affect prices. Also, unlike other commodities, they typically have a smaller role as an input to production but are prominent as a store of value. Reflecting this, these commodities have not been the focus of global discussions by policymakers, including at the G-20.
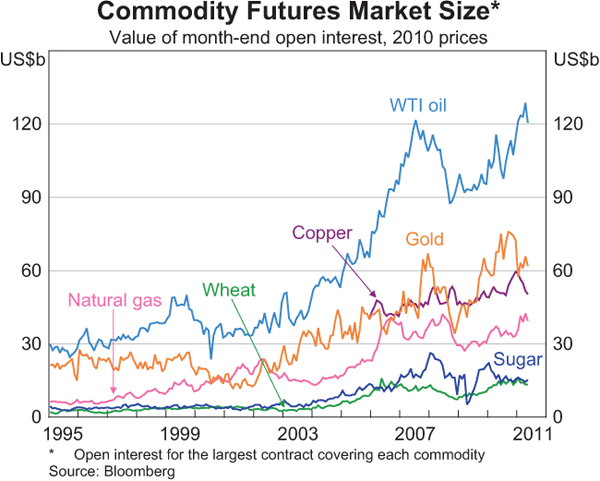
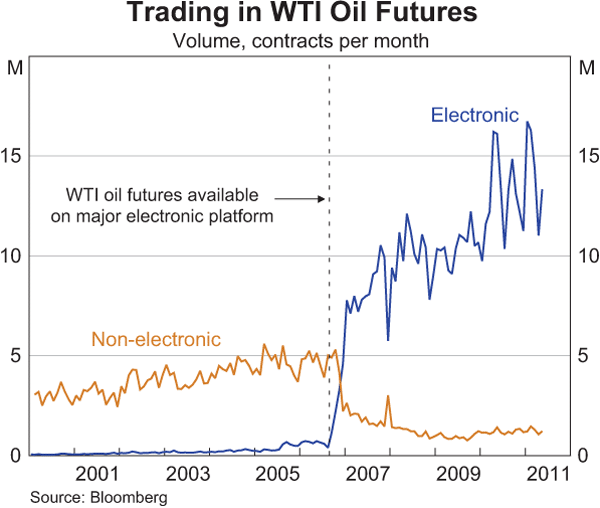
A widely used measure of the size of commodity derivatives markets is the value of open positions in major commodity futures contracts, which has increased substantially since 2001 (Graph 6).[6] Much of this growth is due to the increasing presence of financial investors. The value of open positions represents the financial claims over future production at a given point in time (although some of these positions will ultimately be ‘closed out’, meaning that no physical delivery of the commodity takes place). Turnover of these derivative contracts has grown significantly over the same period, although part of this can be attributed to greater ease of access due to the introduction of full electronic trading on commodity futures exchanges (Graph 7).[7]
While commodity prices have risen rapidly over recent years as commodities have emerged as an asset class for investors, the size of financial investment still remains modest relative to underlying physical commodity markets (Table 2).[8] Measures of total open interest are generally much smaller than the value of production and inventories, but turnover in futures markets can be significantly larger than measures of physical market size.[9] Although a good deal of this turnover is likely to be speculative, the comparatively small level of open interest suggests much of this trading is very short term in nature.
| Physical market(a) | Financial market (exchange traded) |
|||||
|---|---|---|---|---|---|---|
| Annual production | Annual exports | Inventories (end period) |
Annual turnover | Open interest(b) | ||
| Oil(c) | 2,395 | 206(e) | 312 | 22,843 | 193 | |
| Natural gas(d) | 584 | 67 | na | 2,084 | 29 | |
| Coal(e) | 844 | 124 | na | 24 | 4 | |
| Copper(e) | 143(f) | 44(d) | 6 | 10,891 | 81 | |
| Iron ore | 222 | 117 | na | na | na | |
| Gold(e) | 104 | na | na | 6,249 | 76 | |
| Corn | 130 | 16 | 23 | 1,093 | 20 | |
| Wheat | 143 | 28 | 41 | 602 | 14 | |
| Soybeans | 199 | 68 | 29 | 4,775 | 41 | |
| Rice | 235 | 16 | 50 | 35 | 1 | |
| Sugar | 81 | 27 | 14 | 4,425 | 27 | |
|
(a) RBA estimates based on volumes and indicative world prices Sources: ABARES; Bloomberg; CFTC; IEA; RBA; USDA |
||||||
The Effect of Financial Investment
While the role of financial investment in commodities has clearly increased over the past decade, this does not necessarily imply that financial investors have significantly altered price dynamics. A number of factors suggest that, at least for most commodities, the effect has been small.
First, price increases have been just as large for some commodities that do not have well-developed financial markets as for those that do. For example, the prices of iron ore and coal, which do not have large derivatives markets, have increased by as much as prices for most commodities that are actively traded in financial markets (Graph 8). These price increases reflect broad fundamentals, being underpinned by strong demand (particularly from China) and supply constraints. Similarly, the falls in prices during the global financial crisis are consistent with the sharp fall in global growth at that time.
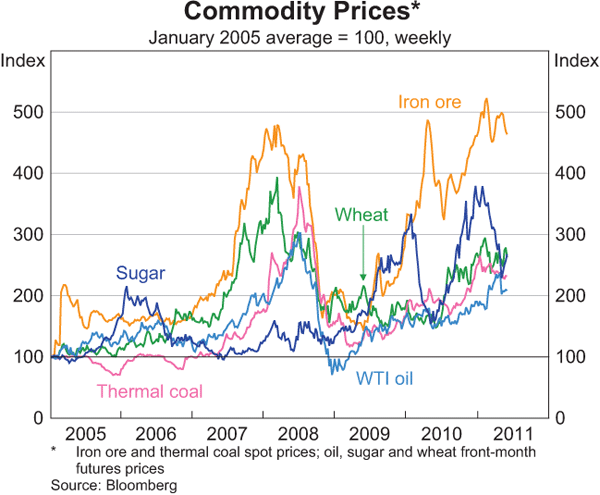
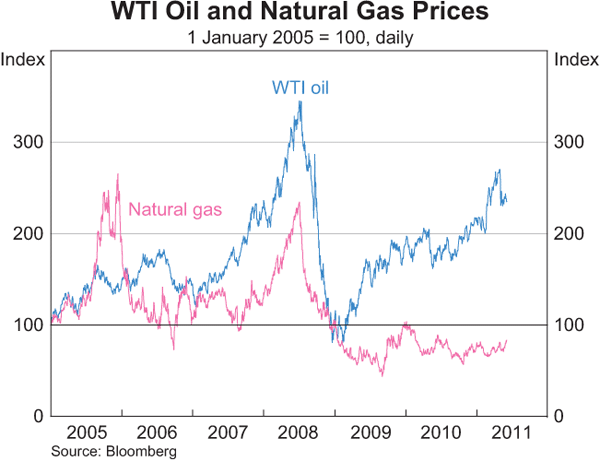
Second, there is significant heterogeneity in price behaviour between commodities, even among those that have large, active derivatives markets. For instance, the prices of oil and natural gas have diverged significantly in recent years, particularly since the start of 2009, despite the associated derivatives markets both growing strongly over recent years (Graphs 6 and 9). The divergence is due to the rapid growth in supply of natural gas in the United States (where these prices are measured) due to technological developments in the shale gas sector. This suggests that even where there has been a large increase in financial investment, fundamentals remain the dominant factor determining commodity prices (except perhaps in the very short run).
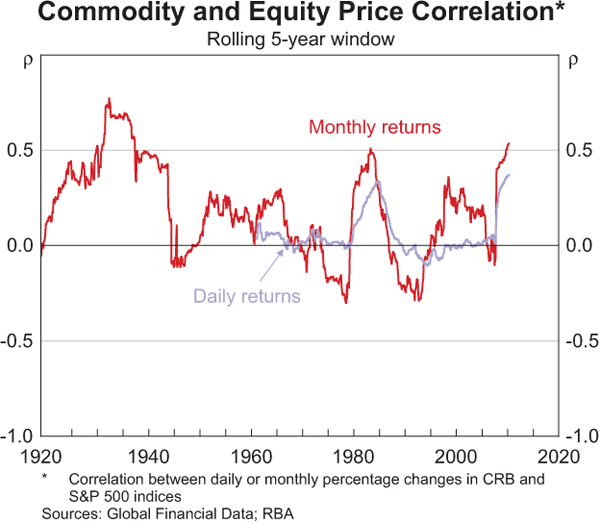
Third, the recent increase in the correlation between commodity prices and other financial prices – which is commonly cited as evidence that financial speculators are affecting prices – is not unusual in a historical context. Episodes of increased correlation between commodity and equity prices have occurred in the past at times when financial investment played little, or no, role in commodity markets (Graph 10). This indicates that asset and commodity prices tend to move together more closely when they are affected by common shocks, such as during the Great Depression period and late 1970s.[10] This is unsurprising given the large swings in global demand and supply during these periods, which are fundamental drivers of both equity and commodity prices. The most recent episode is thus not unusual in this regard, given the very large global shocks that occurred; the early 2000s, when the correlation between commodity and equity prices was almost zero at a daily frequency, is not an appropriate benchmark for the crisis period.
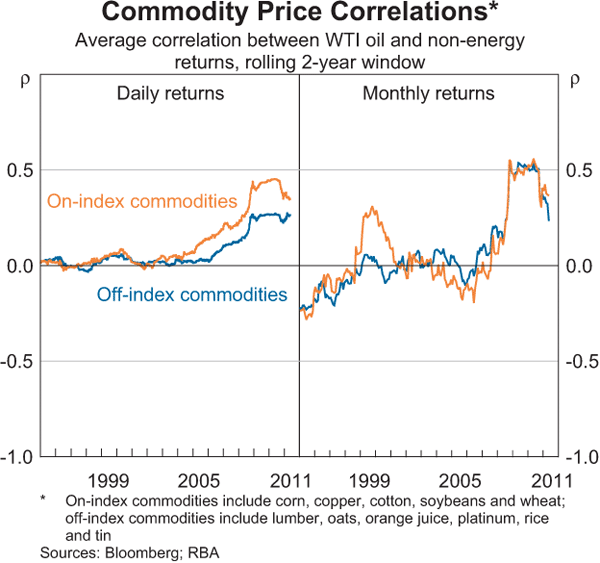
Fourth, the evidence of a relative increase in the price correlation between commodities that make up the major commodity indices – and which are thus invested in by index funds – is mixed. We would expect the behaviour of ‘on-index’ commodity prices to be more similar, relative to ‘off-index’ commodities, if index funds were affecting price dynamics. Daily correlations between oil and other major on-index commodity prices did in fact rise significantly from 2004, although there is also a noticeable increase in the correlation between oil and off-index commodity prices from 2006 (Graph 11). Monthly correlations, however, show little discernible difference in the development of on- and off-index commodity price correlations. While this supports the argument that index fund behaviour affects the price dynamics of on-index commodities, the effect appears to be quite short-lived. The increased correlation among commodity prices more broadly suggests that other (fundamental) market forces tend to dominate.
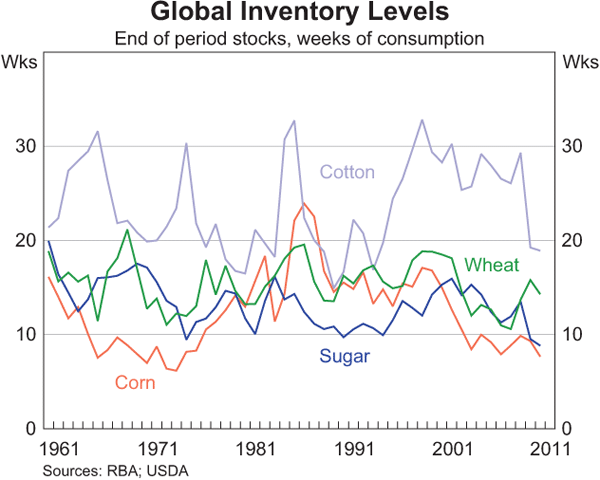
Fifth, there has not been a large increase in commodity inventories that we would expect to accompany speculation-driven price rises. The available – albeit limited – data show that global inventory levels for a range of commodities have been declining and are currently below their long-run averages (Graph 12). That said, it is possible that the producers of extracted commodities – such as oil – effectively control their ‘in the ground’ inventories by limiting production. This is difficult to gauge.
Finally, the academic literature on this topic has generally not supported the proposition that financial investors significantly affect commodity prices over longer time horizons. A number of empirical studies, including by the Commodity Futures Trading Commission, OECD and the IMF, find minimal evidence of speculators' positions driving prices.[11] Gilbert (2010) and Phillips and Yu (2010) do find indications of ‘bubble-like’ behaviour in some commodity markets, but this is only found for a small number of days concentrated mainly around the peak in prices in 2008. Gilbert also finds evidence that index investors contributed to price increases in crude oil, copper and aluminium. However, the measure of index investment is based on investors' positions in agricultural futures markets (as these were the only data available) and no evidence of an impact is found in physical agricultural markets. Others, such as Tang and Xiong (2010), find evidence of a closer relationship between commodity prices and other asset classes after 2004, although any differences in terms of the effect on ‘on-index’ and ‘off-index’ commodities do not appear to be economically significant, as discussed above.
Conclusion
Commodity prices are currently both high and volatile relative to the past few decades, consistent with the physical supply and demand fundamentals that underpin these markets. However, the increase in prices and volatility is not unprecedented, having occurred during other large global supply and demand shocks throughout the past century. There is a lack of convincing evidence (at least to date) that financial markets have had a materially adverse effect on commodity markets over time periods of relevance to the economy. It is possible that speculators have had some effect on commodity price volatility, but their contribution would appear to be relatively small – particularly when compared with the contribution from fundamental factors – and short term in nature.
Footnotes
The authors are from International Department. [*]
See Rayner, Laing and Hall (2011). [1]
There are a number of ways to measure commodity price volatility, with no clear ‘best’ approach in all circumstances. This article uses the standard deviation of percentage changes in prices over a set time period, or ‘window’, but in most cases the broad results do not materially change when other approaches are used. [2]
A draft of Gorton and Rouwenhorst's paper was released in 2004. [3]
See, for example, Barclays Capital (2010). [4]
See Kosev and Williams (2011) for more details on ETPs. [5]
This is consistent with the growth in futures open interest in other asset classes such as equities over this period. [6]
Note that maintaining a particular portfolio composition (or tracking an index) can generate significant turnover volumes, simply to rebalance the portfolio as prices change. This involves selling commodities which have had price rises and buying those for which prices have fallen. Hence this should mitigate price movements rather than exacerbate them, as is sometimes suggested. [7]
Table 2 aggregates turnover and open interest at major exchanges, to provide a comparison with global physical markets. This is different to Graph 6, which uses time series of the open interest in the largest exchange-traded contract for each commodity as an indicative measure of the growth in commodity futures markets. [8]
Although these measures give a broad sense of the size of financial investment in commodity markets relative to the physical market, the two concepts are not directly comparable. Open interest and inventories are stocks at a given point in time, while production, exports and turnover are flows over a period of time. [9]
The increased correlation from the late 1970s shock does not appear in the graph until the early 1980s due to the phase-shift associated with the 5-year rolling window. [10]
See, for example, Buyuksahin, Brunetti and Harris (2010), Irwin and Sanders (2010) and IMF (2011). [11]
References
Barclays Capital (2010), ‘Commodity Investors Seek Absolute Returns, Active Strategies, Barclays Capital Survey Finds’, News release, 9 December.
Buyuksahin B, C Brunetti and J Harris (2010), ‘Is Speculation Destablilizing?’, Commodity Futures Trading Commission Working Paper.
Cashin P and C McDermott (2002), ‘The Long-run Behaviour of Commodity Prices: Small Trends and Big Variability’, IMF Staff Papers 49, pp 175–199.
Gilbert C (2010), ‘Speculative Influences on Commodity Futures Prices 2006–2008’, UNCTAD Discussion Paper No 197.
Gorton G and KG Rouwenhorst (2006), ‘Facts and Fantasies about Commodity Futures’, Financial Analysts Journal, 62, pp 47–68.
Grilli ER and MC Yang (1988), ‘Primary Commodity Prices, Manufactured Goods Prices, and the Terms of Trade of Developing Countries: What the Long Run Shows’, The World Bank Economic Review, 2(1), pp 1–47.
IMF (International Monetary Fund) (2011), ‘A Barrel of Oil or a Bottle of Wine: How do Global Growth Dynamics Affect Commodity Prices?’, IMF Working Paper.
Irwin SH and DR Sanders (2010), ‘The Impact of Index and Swap Funds on Commodity Futures Markets: Preliminary Results’, OECD Food, Agriculture and Fisheries Working Paper No 27.
Johnston L and SH Williamson (2010), ‘What Was the U.S. GDP Then?’,
MeasuringWorth.
Available at: <http://measuringworth.com/usgdp/>.
Kosev M and T Williams (2011), ‘Exchange-traded Funds’, RBA Bulletin, March, pp 51–59.
Maddison A (2009), ‘Statistics on World Population, GDP and Per Capita
GDP, 1-2008 AD’.
Available at: <http://www.ggdc.net/Maddison/Historical_Statistics/horizontal-file_02-2010.xls>.
Phillips P and J Yu (2010), ‘Dating the Timeline of Financial Bubbles During the Subprime Crisis’, Cowles Foundation Discussion Paper No 1770.
Rayner V, E Laing and J Hall (2011), ‘Developments in Global Food Prices’, RBA Bulletin, March,
pp 15–21.
Tang K and W Xiong (2010), ‘Index Investing and the Financialization of Commodities’, NBER Working Paper No 16385.
World Steel Association (2010), Steel Statistical Yearbook
2010, World Steel Association, Brussels,
pp 29–33. Available at: <http://www.worldsteel.org/pictures/publicationfiles/SSY
2010.pdf>.